| Param | Original file | Final file |
|---|---|---|
| Filename | modeM0/AS1A05_188T01_9000002520_16975cztM0_level2.evt | modeM0/AS1A05_188T01_9000002520_16975cztM0_level2_quad_clean.evt |
| Size (bytes) | 515,940,480 | 99,578,880 |
| Size | 492.0 MB | 95.0 MB |
| Events in quadrant A | 3,094,284 | 651,740 |
| Events in quadrant B | 3,596,091 | 661,289 |
| Events in quadrant C | 3,740,514 | 637,639 |
| Events in quadrant D | 4,754,326 | 612,428 |
| Mode M9 | |||
|---|---|---|---|
| Quadrant | BADHDUFLAG | Total packets | Discarded packets |
| A | 0 | 14 | 0 |
| B | 0 | 15 | 0 |
| C | 0 | 15 | 0 |
| D | 0 | 15 | 0 |
| Mode M0 | |||
|---|---|---|---|
| Quadrant | BADHDUFLAG | Total packets | Discarded packets |
| A | 0 | 13541 | 2 |
| B | 0 | 14971 | 2 |
| C | 0 | 15309 | 2 |
| D | 0 | 18465 | 3 |
| Mode SS | |||
|---|---|---|---|
| Quadrant | BADHDUFLAG | Total packets | Discarded packets |
| A | 0 | 132 | 0 |
| B | 0 | 132 | 0 |
| C | 0 | 132 | 0 |
| D | 0 | 132 | 0 |
| Quadrant | Total seconds | Saturated seconds | Saturation percentage |
|---|---|---|---|
| A | 6487 | 33 | 0.508710% |
| B | 6487 | 197 | 3.036843% |
| C | 6487 | 77 | 1.186989% |
| D | 6486 | 276 | 4.255319% |
Noise dominated data is calculated using 1-second bins in cleaned event files. If a bin has >2000 counts, and if more than 50% of those come from <1% of pixels, then it is considered to be noise-dominated and hence unusable.
| Quadrant | # 1 sec bins | Bins with >0 counts | Bins with >2000 counts | High rate bins dominated by noise | Noise dominated (total time) | Noise dominated (detector-on time) | Marked lightcurve |
|---|---|---|---|---|---|---|---|
| A | 7608 | 6489 | 11 | 11 | 0.14% | 0.17% | 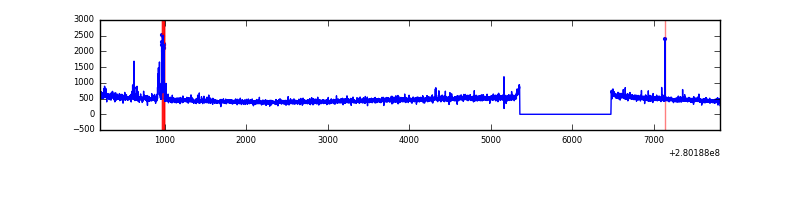 |
| B | 7608 | 6489 | 90 | 90 | 1.18% | 1.39% | 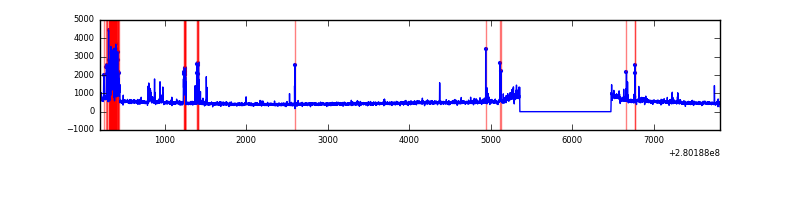 |
| C | 7608 | 6489 | 0 | 0 | 0.00% | 0.00% | 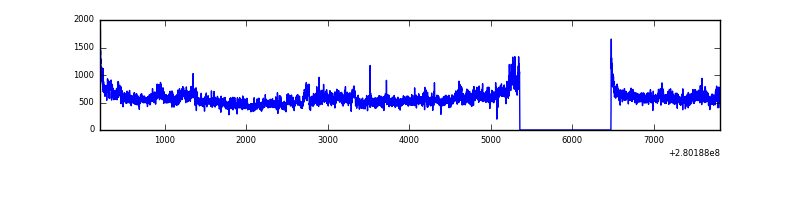 |
| D | 7607 | 6488 | 216 | 216 | 2.84% | 3.33% | 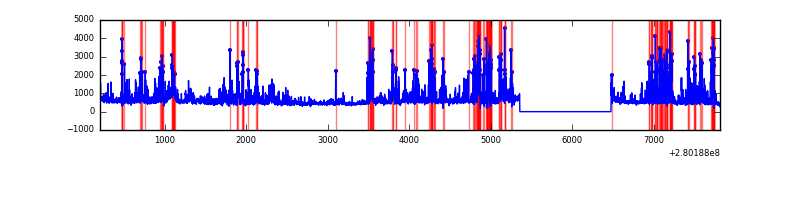 |
Top three noisy pixels from each quadrant. If the there are fewer than three noisy pixels in the level2.evt file, extra rows are filled as -1
| Pixel properties | Quadrant properties | ||||||
|---|---|---|---|---|---|---|---|
| Quadrant | DetID | PixID | Counts | Sigma | Mean | Median | Sigma |
| A | 15 | 174 | 89219 | 563.58 | 778 | 762 | 157.0 |
| A | 12 | 189 | 10606 | 62.72 | 778 | 762 | 157.0 |
| A | 0 | 226 | 6811 | 38.54 | 778 | 762 | 157.0 |
| B | 3 | 64 | 320115 | 2131.22 | 781 | 760 | 149.8 |
| B | 0 | 197 | 80332 | 531.03 | 781 | 760 | 149.8 |
| B | 4 | 216 | 30843 | 200.76 | 781 | 760 | 149.8 |
| C | 3 | 233 | 646039 | 3627.42 | 759 | 765 | 177.9 |
| C | 14 | 238 | 118904 | 664.12 | 759 | 765 | 177.9 |
| C | 0 | 207 | 17192 | 92.34 | 759 | 765 | 177.9 |
| D | 1 | 52 | 1908760 | 10521.61 | 745 | 723 | 181.3 |
| D | 2 | 234 | 25680 | 137.62 | 745 | 723 | 181.3 |
| D | 13 | 238 | 13945 | 72.91 | 745 | 723 | 181.3 |
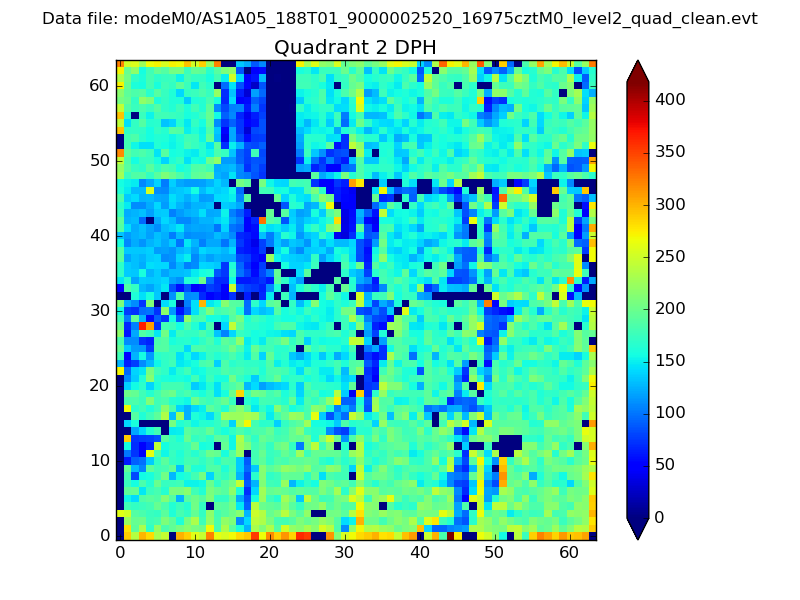
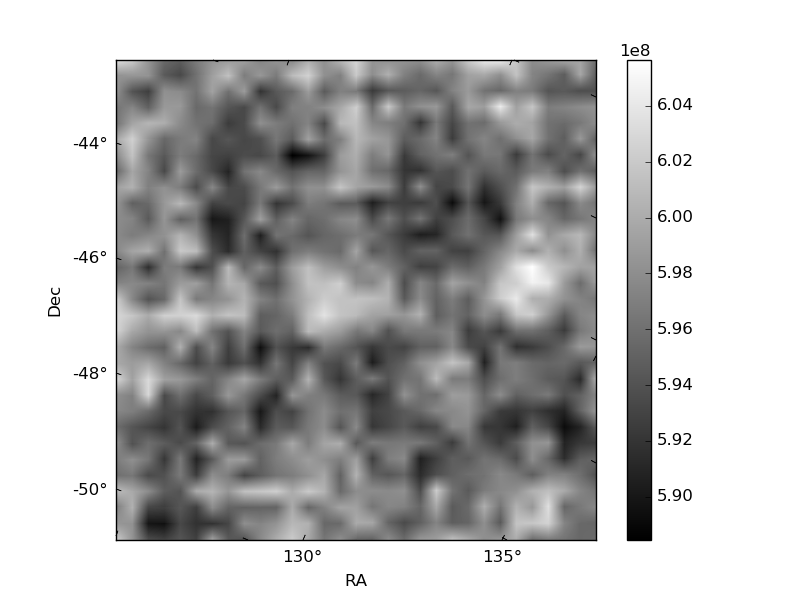
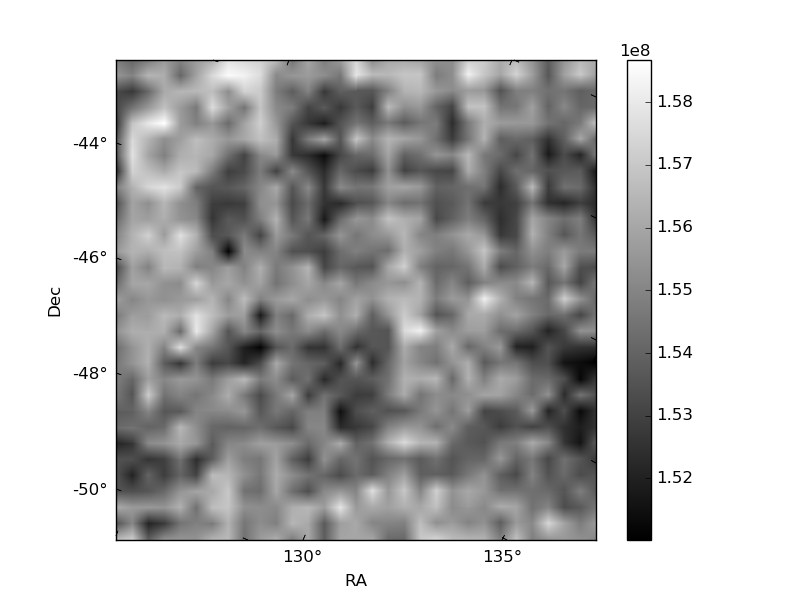
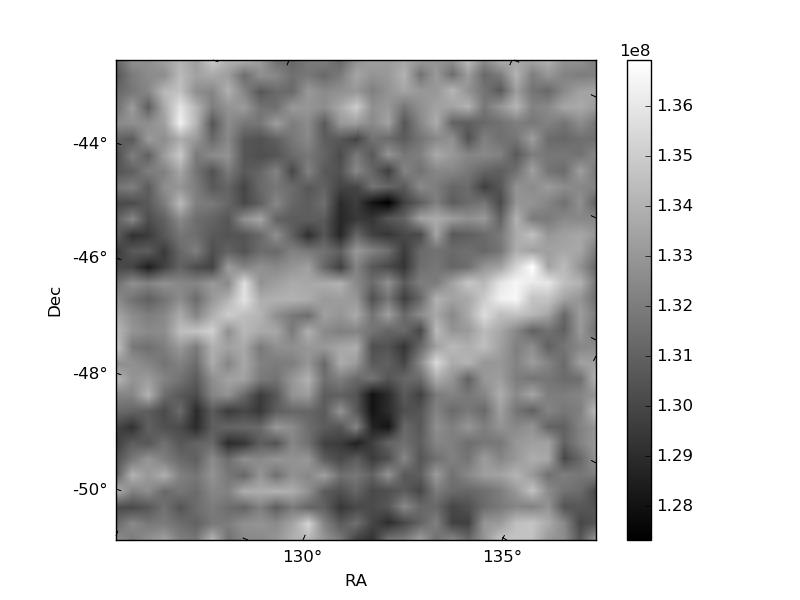
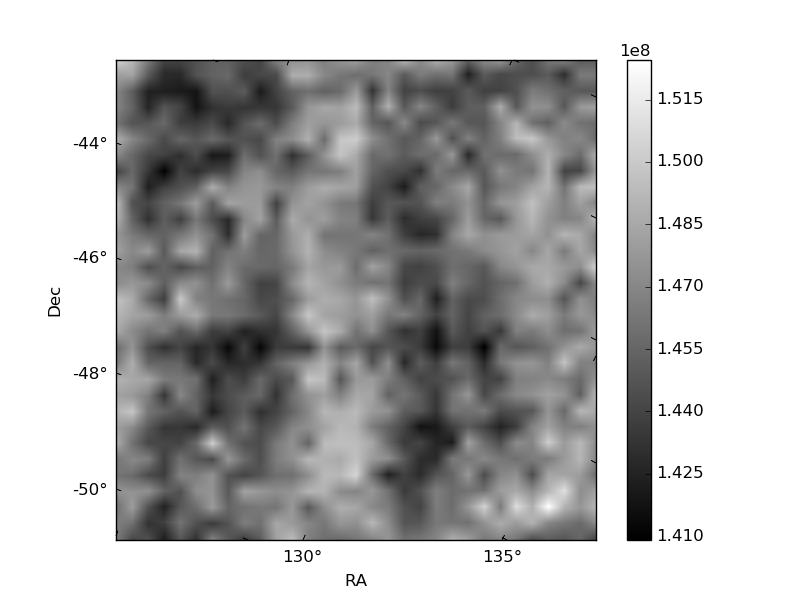
Histogram calculated using DETX and DETY for each event in the final _common_clean file
| Quadrant A | 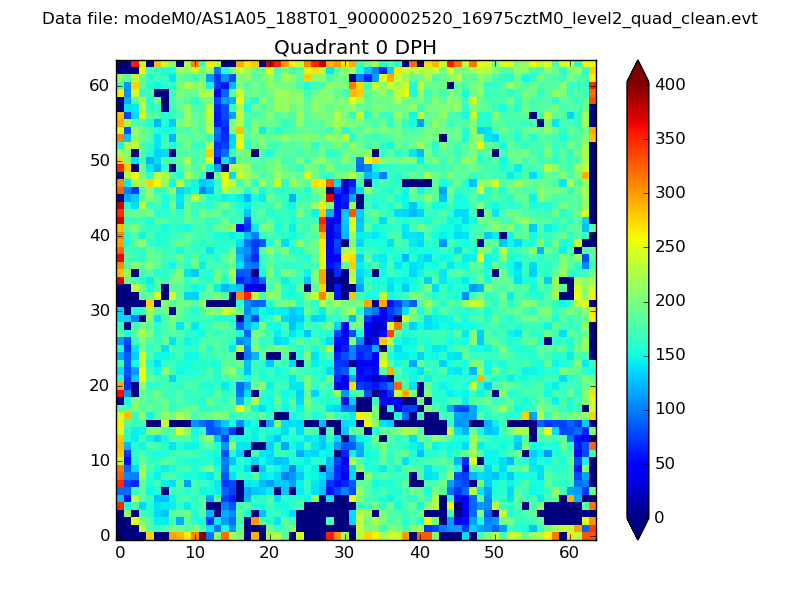 |
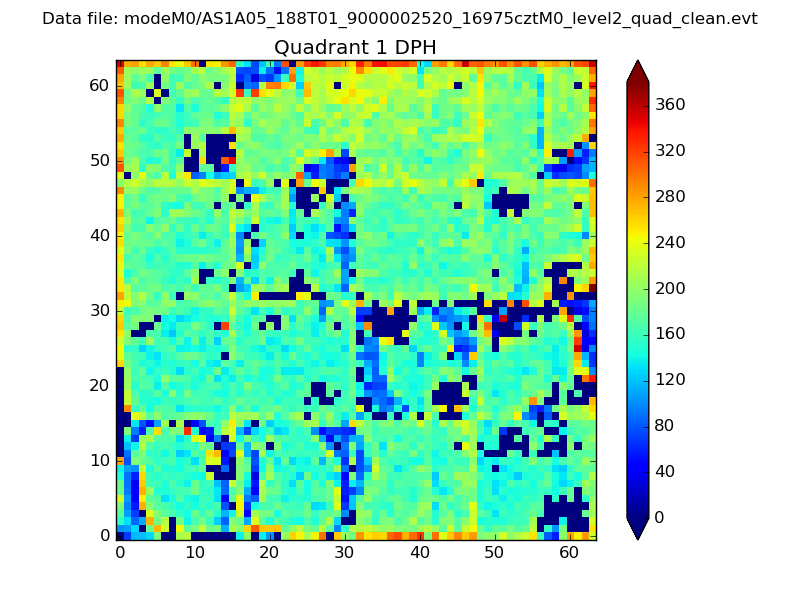 |
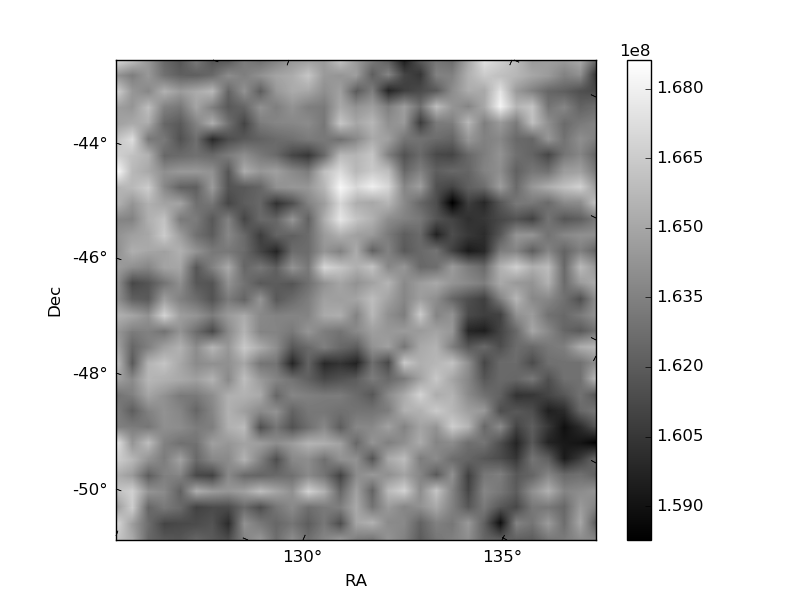
Quadrant B |
|---|---|---|---|
| Quadrant D | 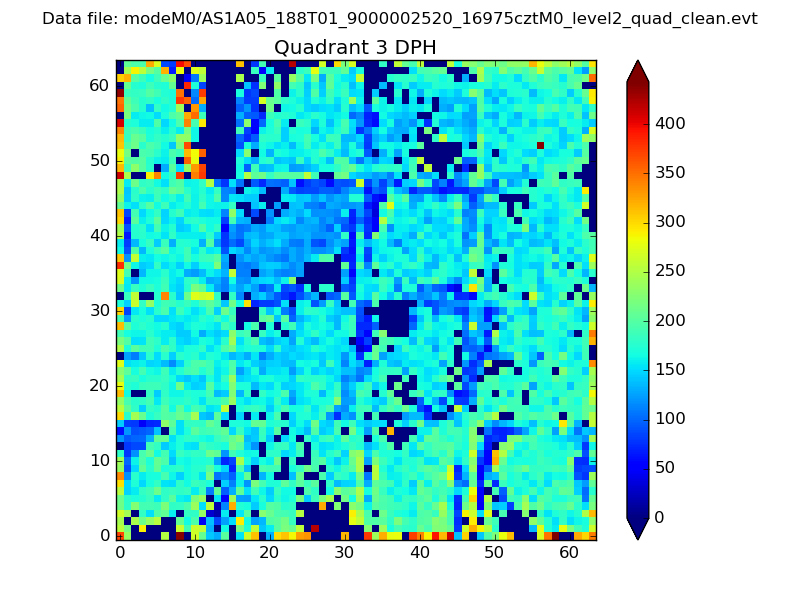 |
 |
Quadrant C |
| Plot type | Count rate plots | Images |
|---|---|---|
| Comparison with Poisson distribution Blue bars denote a histogram of data divided into 1 sec bins. Red curve is a Poisson curve with rate = median count rate of data. |
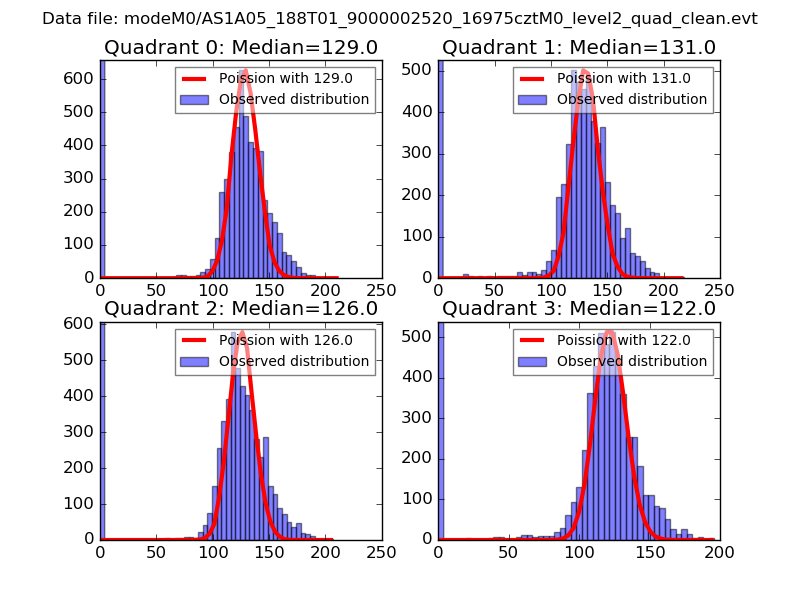 |
 |
| Quadrant-wise count rates Data is divided into 100 sec bins |
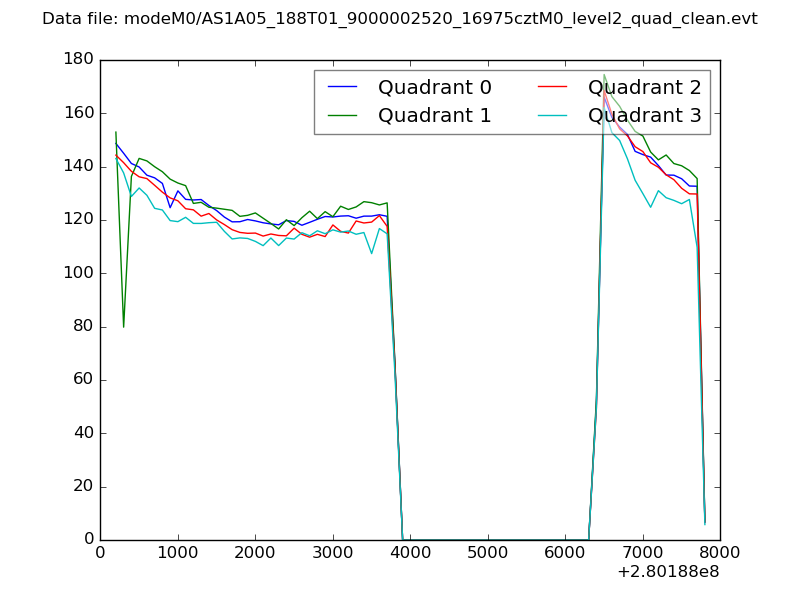 |
|
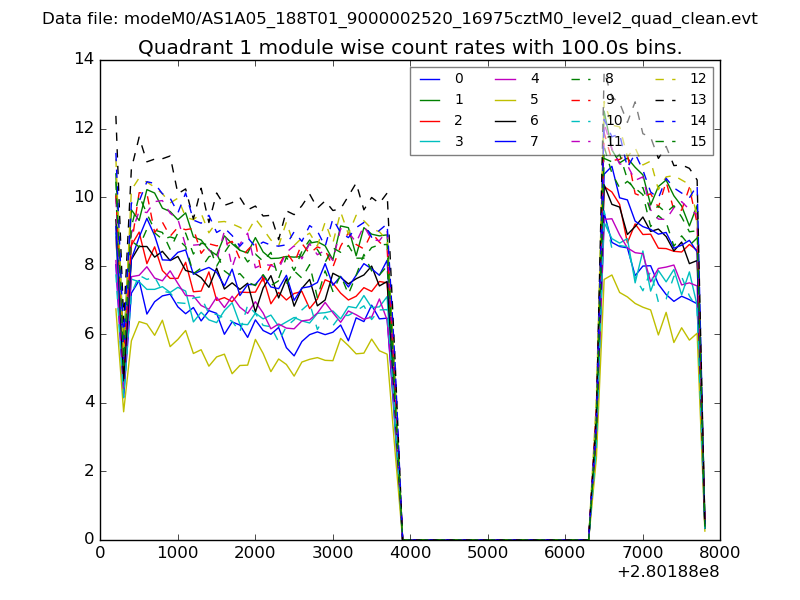
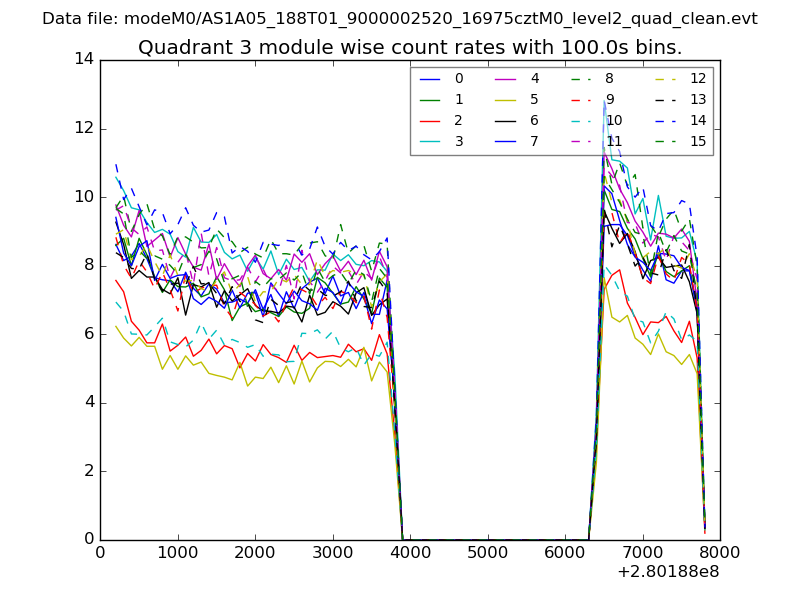
| Module-wise count rates for Quadrant A Data is divided into 100 sec bins |
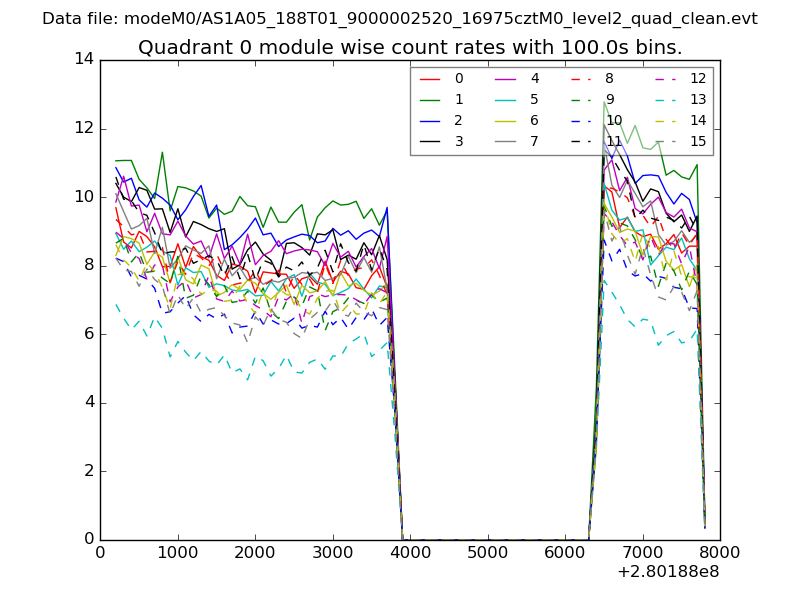 |
 |
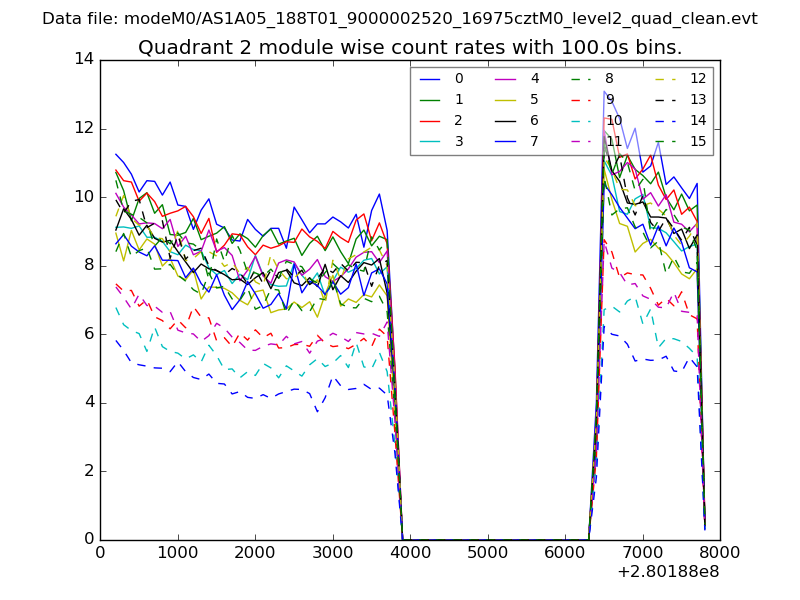
| Module-wise count rates for Quadrant B Data is divided into 100 sec bins |
 |
 |
| Module-wise count rates for Quadrant C Data is divided into 100 sec bins |
 |
 |
| Module-wise count rates for Quadrant D Data is divided into 100 sec bins |
 |
 |
| Parameter | Plot |
|---|---|
| CZT HV Monitor | 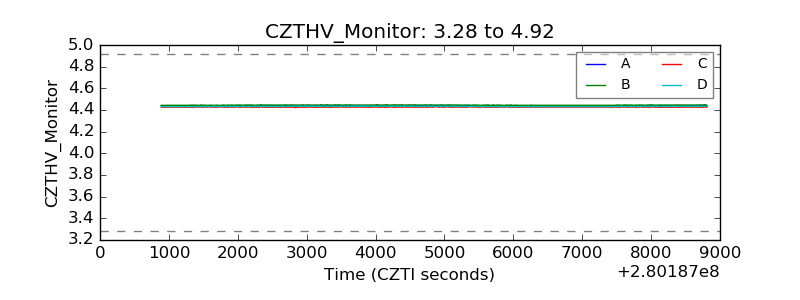 |
| D_VDD | 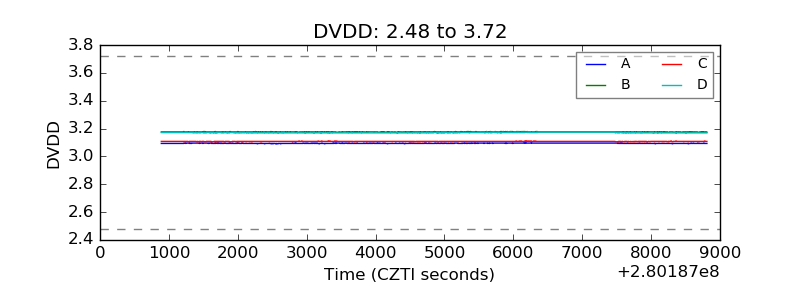 |
| Temperature 1 | 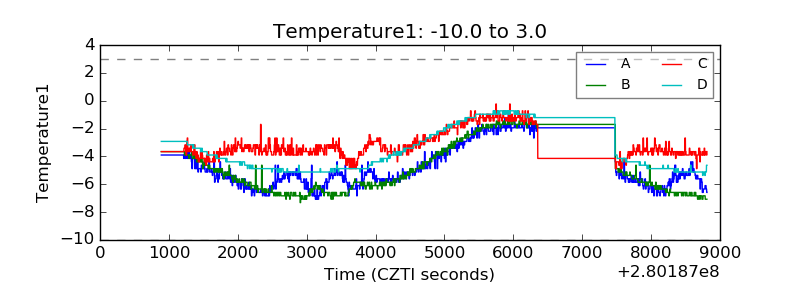 |
| Veto HV Monitor | 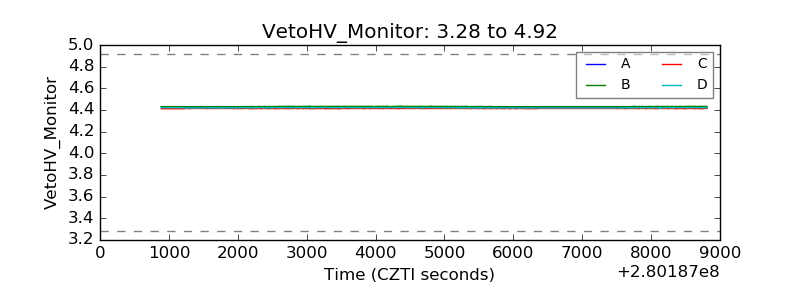 |
| Veto LLD | 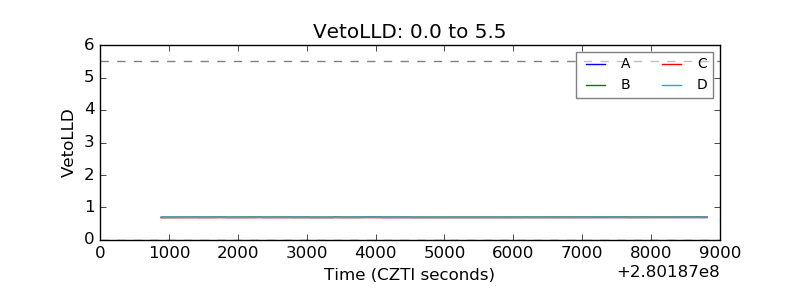 |
| Alpha Counter | 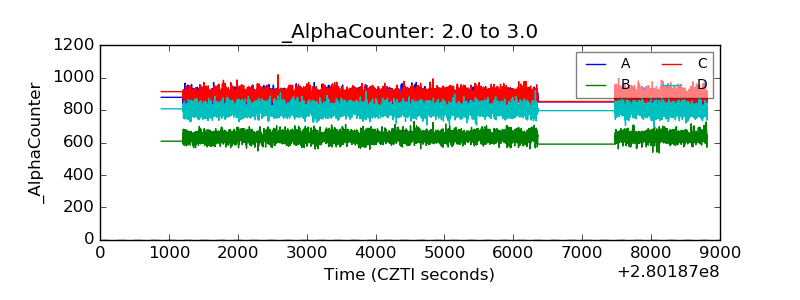 |
| _CPM_Rate | 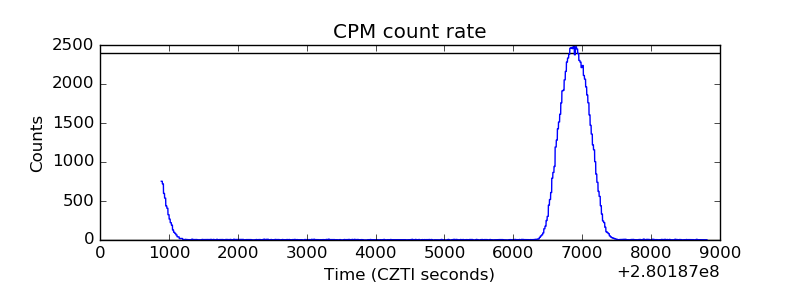 |
| CZT Counter | 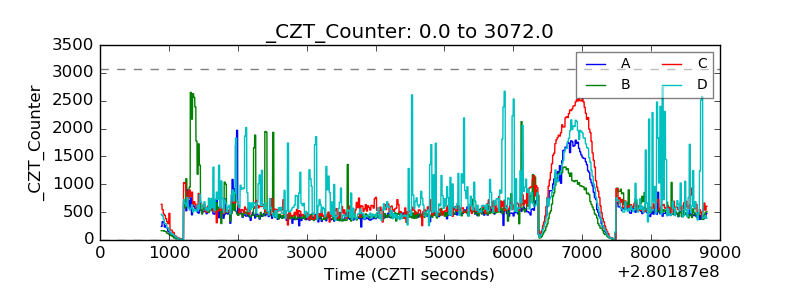 |
| +2.5 Volts monitor | 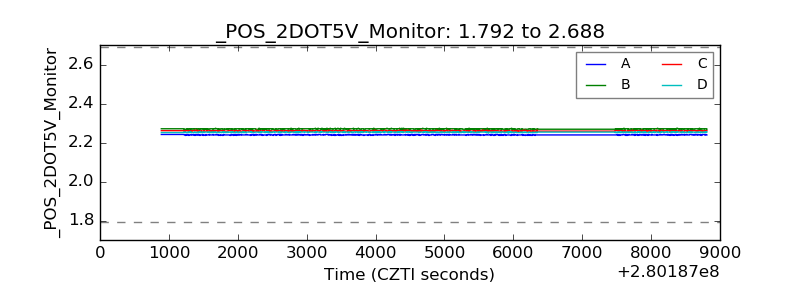 |
| +5 Volts monitor |  |
| _ROLL_ROT | 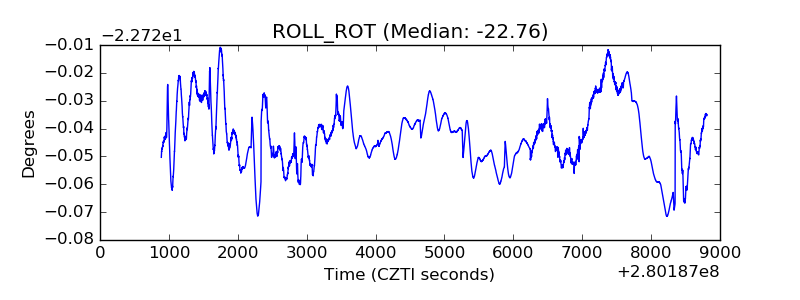 |
| _Roll_DEC |  |
| _Roll_RA | 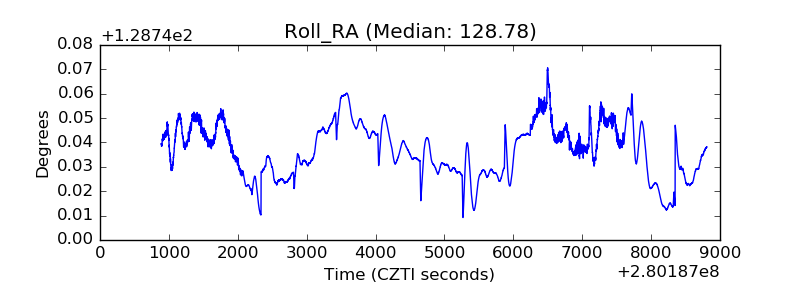 |
| Veto Counter | 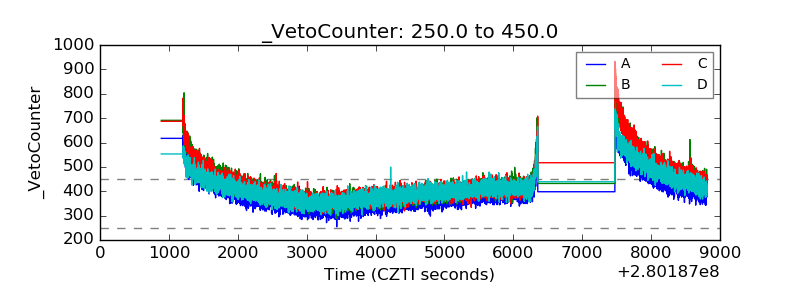 |