| Param | Original file | Final file |
|---|---|---|
| Filename | modeM0/AS1A05_188T01_9000002520_16976cztM0_level2.evt | modeM0/AS1A05_188T01_9000002520_16976cztM0_level2_quad_clean.evt |
| Size (bytes) | 306,005,760 | 65,813,760 |
| Size | 291.8 MB | 62.8 MB |
| Events in quadrant A | 1,873,036 | 430,586 |
| Events in quadrant B | 1,992,835 | 445,410 |
| Events in quadrant C | 2,298,331 | 424,845 |
| Events in quadrant D | 2,825,044 | 404,601 |
| Mode M9 | |||
|---|---|---|---|
| Quadrant | BADHDUFLAG | Total packets | Discarded packets |
| A | 0 | 8 | 0 |
| B | 0 | 9 | 0 |
| C | 0 | 9 | 0 |
| D | 0 | 9 | 0 |
| Mode M0 | |||
|---|---|---|---|
| Quadrant | BADHDUFLAG | Total packets | Discarded packets |
| A | 0 | 8322 | 1 |
| B | 0 | 8659 | 1 |
| C | 0 | 9374 | 1 |
| D | 0 | 11162 | 1 |
| Mode SS | |||
|---|---|---|---|
| Quadrant | BADHDUFLAG | Total packets | Discarded packets |
| A | 0 | 82 | 0 |
| B | 0 | 82 | 0 |
| C | 0 | 82 | 0 |
| D | 0 | 82 | 0 |
| Quadrant | Total seconds | Saturated seconds | Saturation percentage |
|---|---|---|---|
| A | 4075 | 4 | 0.098160% |
| B | 4075 | 17 | 0.417178% |
| C | 4075 | 19 | 0.466258% |
| D | 4075 | 195 | 4.785276% |
Noise dominated data is calculated using 1-second bins in cleaned event files. If a bin has >2000 counts, and if more than 50% of those come from <1% of pixels, then it is considered to be noise-dominated and hence unusable.
| Quadrant | # 1 sec bins | Bins with >0 counts | Bins with >2000 counts | High rate bins dominated by noise | Noise dominated (total time) | Noise dominated (detector-on time) | Marked lightcurve |
|---|---|---|---|---|---|---|---|
| A | 4076 | 4076 | 1 | 1 | 0.02% | 0.02% | 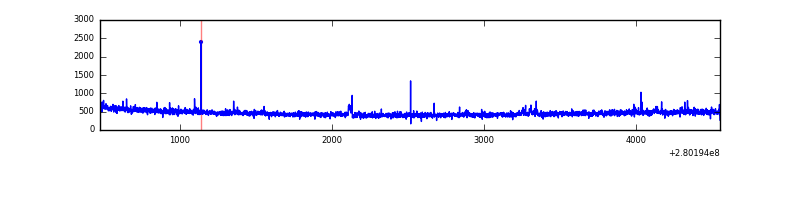 |
| B | 4076 | 4076 | 3 | 3 | 0.07% | 0.07% | 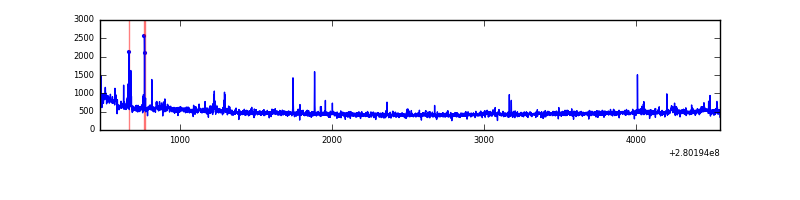 |
| C | 4076 | 4076 | 0 | 0 | 0.00% | 0.00% | 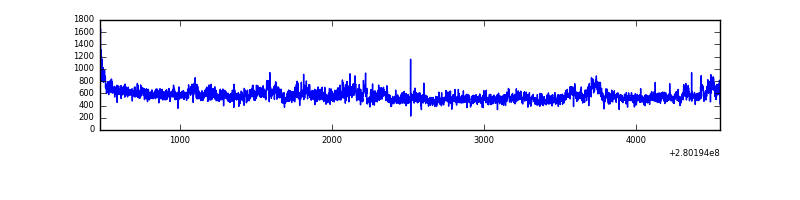 |
| D | 4076 | 4076 | 177 | 177 | 4.34% | 4.34% | 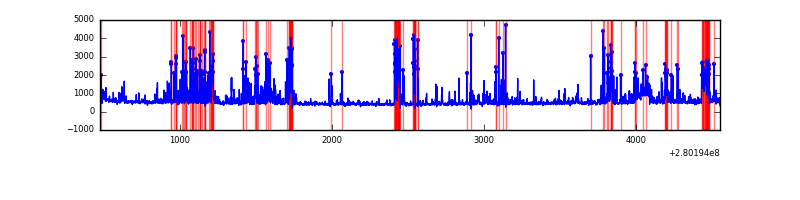 |
Top three noisy pixels from each quadrant. If the there are fewer than three noisy pixels in the level2.evt file, extra rows are filled as -1
| Pixel properties | Quadrant properties | ||||||
|---|---|---|---|---|---|---|---|
| Quadrant | DetID | PixID | Counts | Sigma | Mean | Median | Sigma |
| A | 15 | 174 | 26278 | 265.9 | 478 | 468 | 97.1 |
| A | 12 | 189 | 7602 | 73.5 | 478 | 468 | 97.1 |
| A | 0 | 226 | 4101 | 37.43 | 478 | 468 | 97.1 |
| B | 3 | 64 | 40846 | 440.08 | 485 | 474 | 91.7 |
| B | 0 | 197 | 26826 | 287.26 | 485 | 474 | 91.7 |
| B | 0 | 229 | 12433 | 130.36 | 485 | 474 | 91.7 |
| C | 3 | 233 | 373981 | 3363.52 | 473 | 476 | 111.0 |
| C | 14 | 238 | 74790 | 669.22 | 473 | 476 | 111.0 |
| C | 0 | 207 | 3493 | 27.17 | 473 | 476 | 111.0 |
| D | 1 | 52 | 1064952 | 9464.02 | 463 | 450 | 112.5 |
| D | 2 | 234 | 15211 | 131.23 | 463 | 450 | 112.5 |
| D | 2 | 152 | 7531 | 62.95 | 463 | 450 | 112.5 |
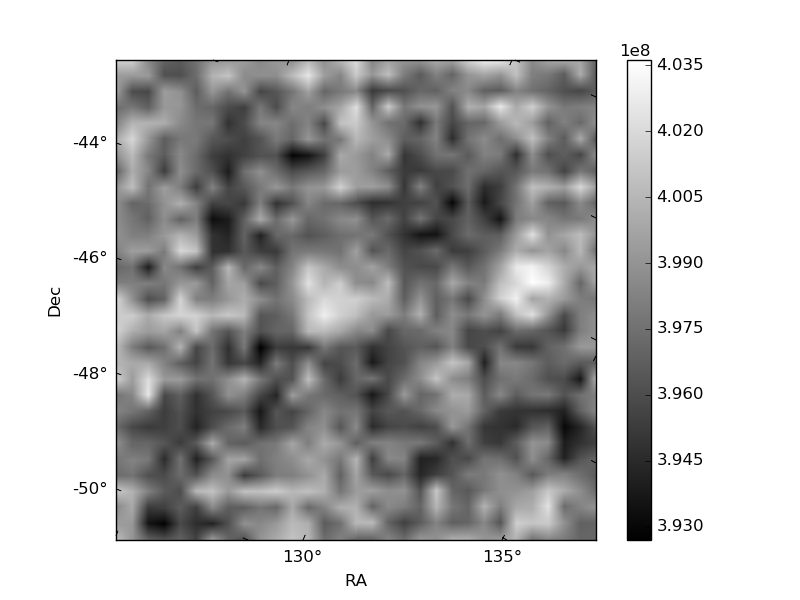
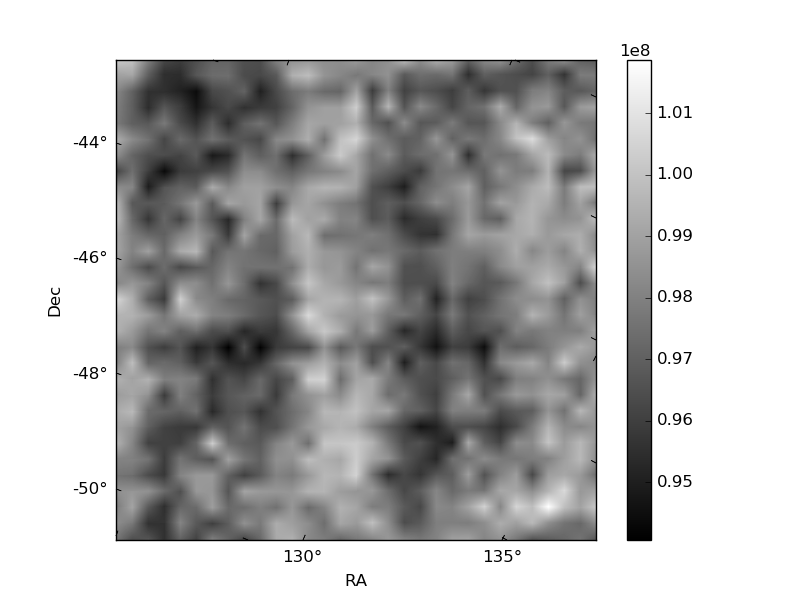
Histogram calculated using DETX and DETY for each event in the final _common_clean file
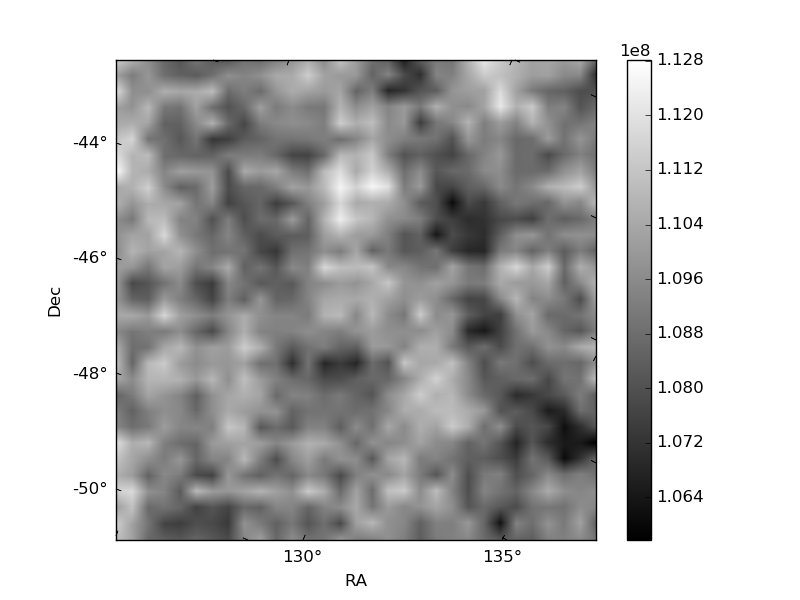
| Quadrant A | 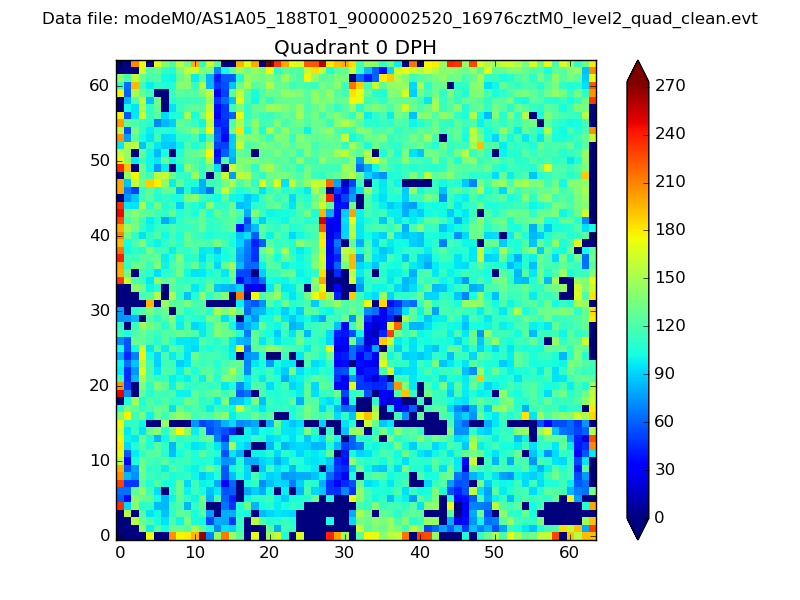 |
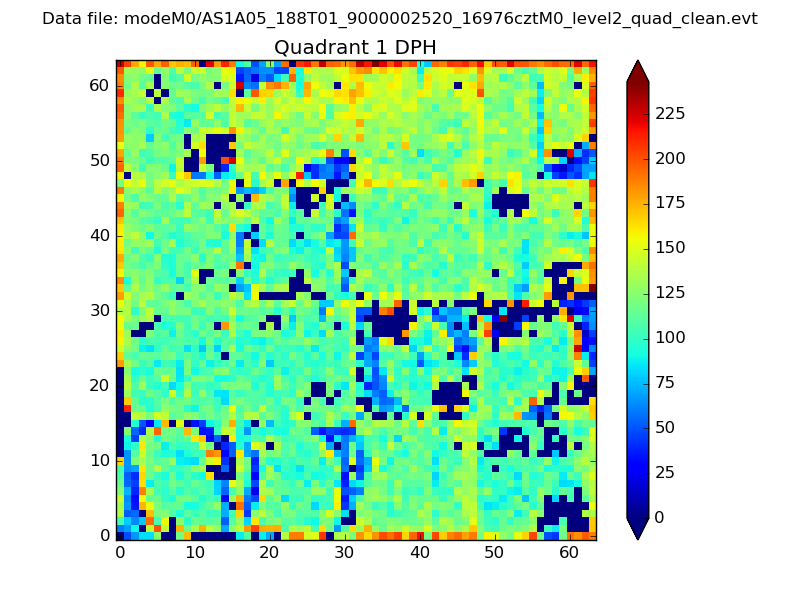 |
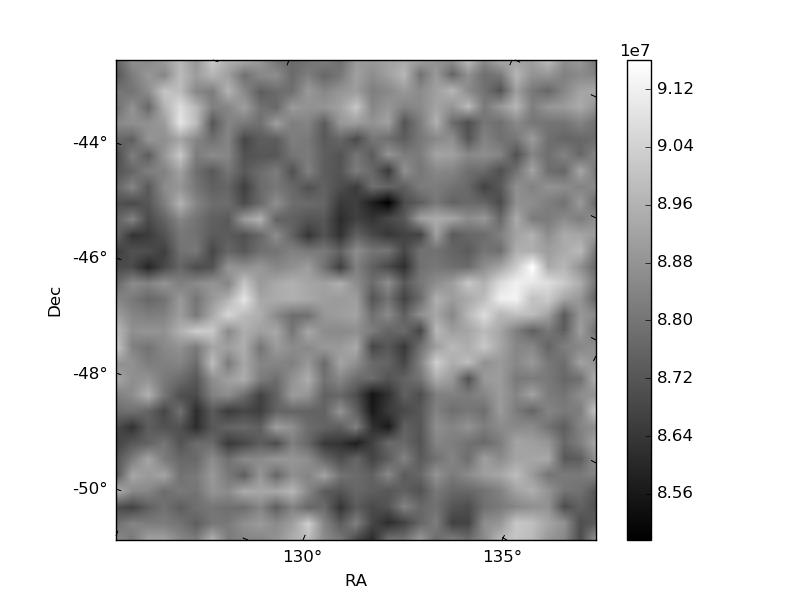
Quadrant B |
|---|---|---|---|
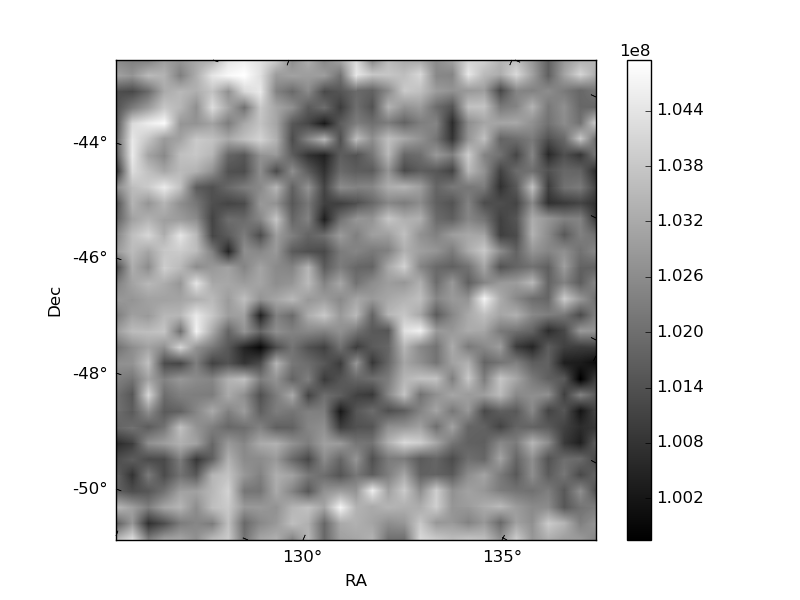
| Quadrant D | 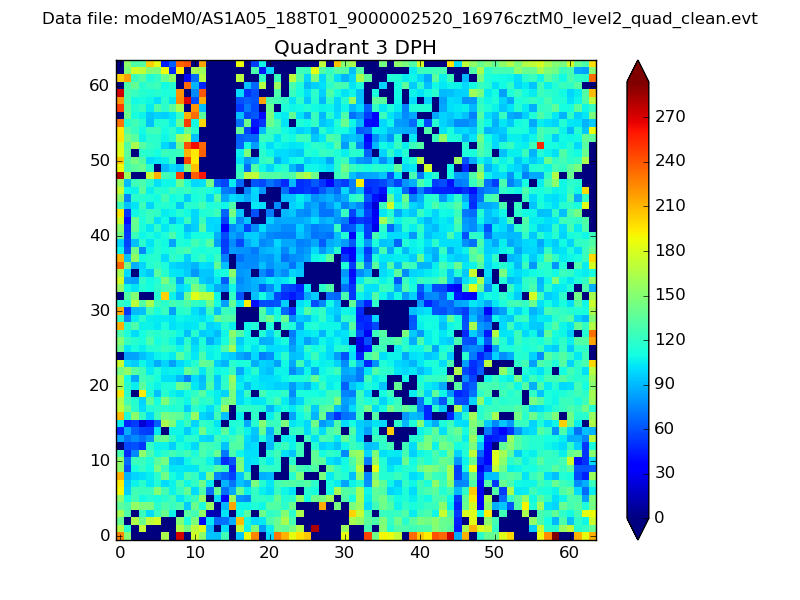 |
 |
Quadrant C |
| Plot type | Count rate plots | Images |
|---|---|---|
| Comparison with Poisson distribution Blue bars denote a histogram of data divided into 1 sec bins. Red curve is a Poisson curve with rate = median count rate of data. |
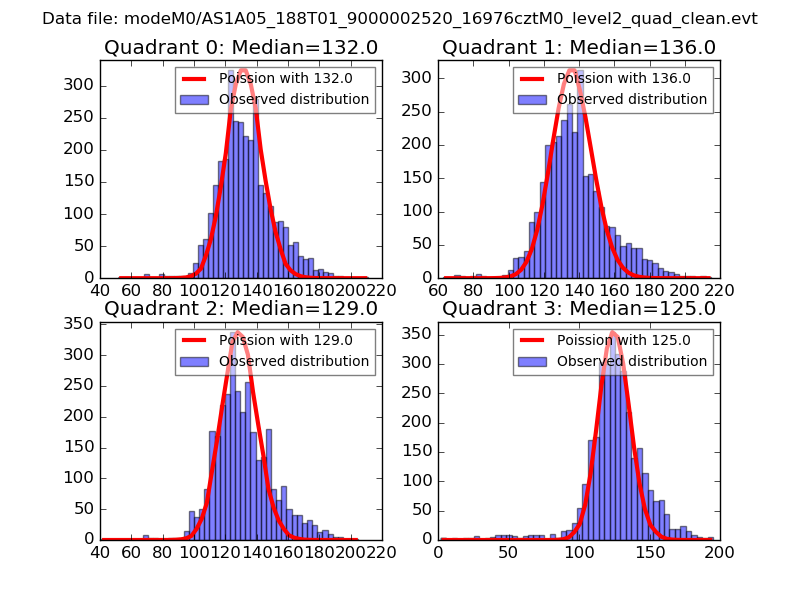 |
 |
| Quadrant-wise count rates Data is divided into 100 sec bins |
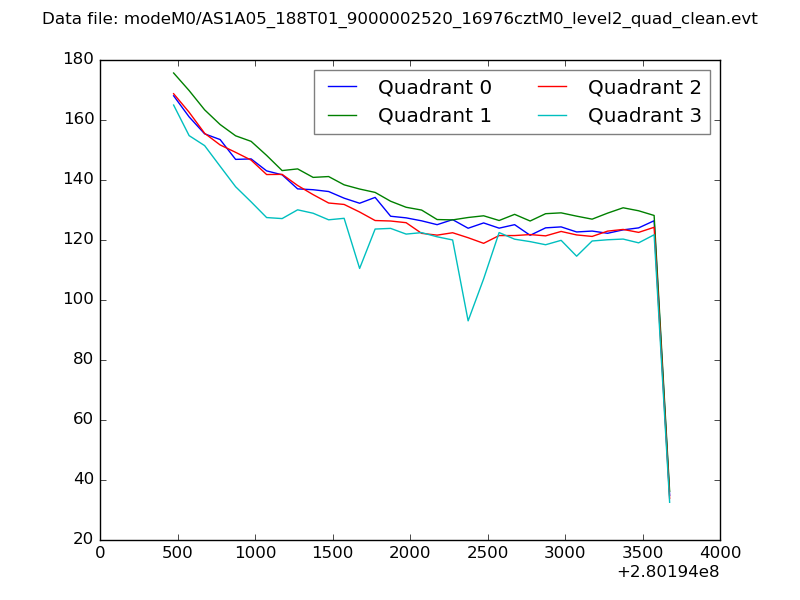 |
|
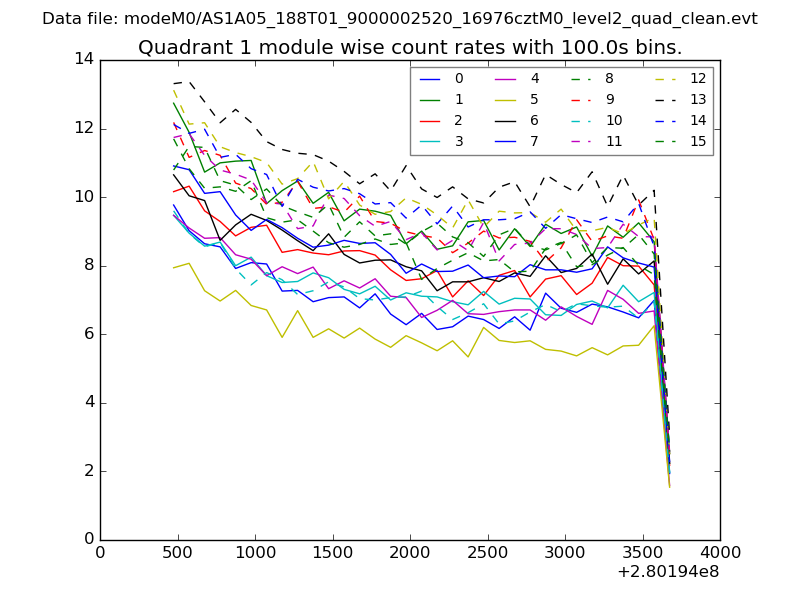
| Module-wise count rates for Quadrant A Data is divided into 100 sec bins |
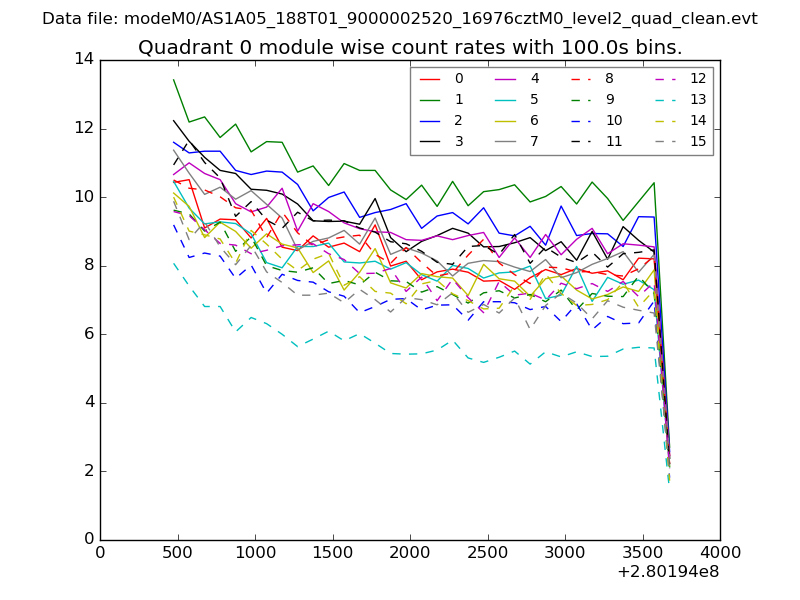 |
 |
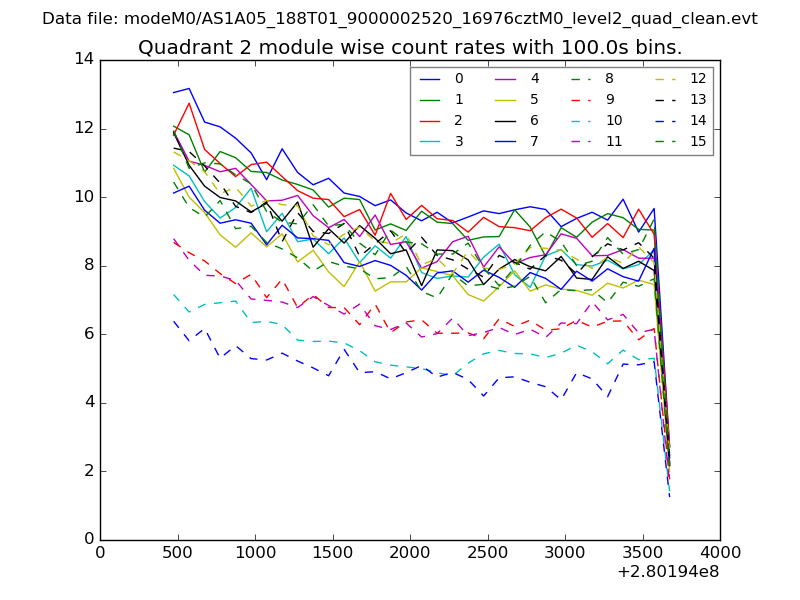
| Module-wise count rates for Quadrant B Data is divided into 100 sec bins |
 |
 |
| Module-wise count rates for Quadrant C Data is divided into 100 sec bins |
 |
 |
| Module-wise count rates for Quadrant D Data is divided into 100 sec bins |
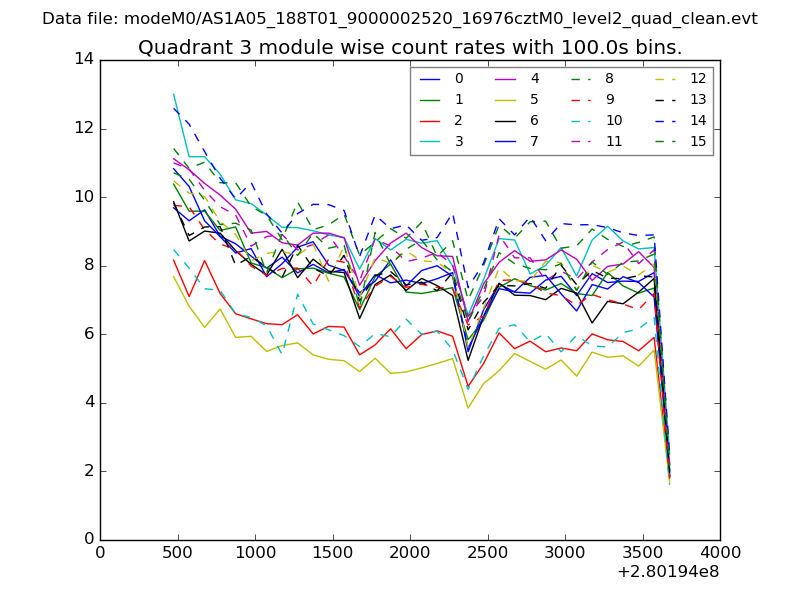 |
 |
| Parameter | Plot |
|---|---|
| CZT HV Monitor | 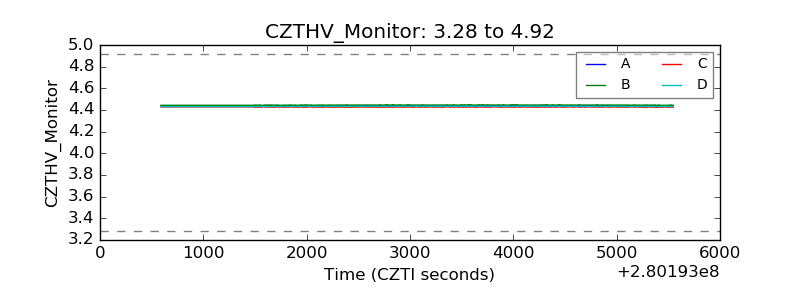 |
| D_VDD | 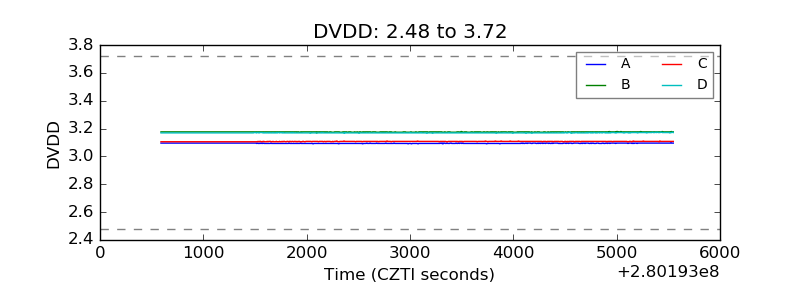 |
| Temperature 1 | 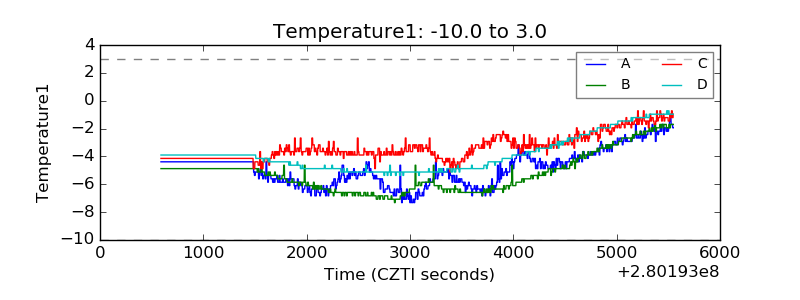 |
| Veto HV Monitor | 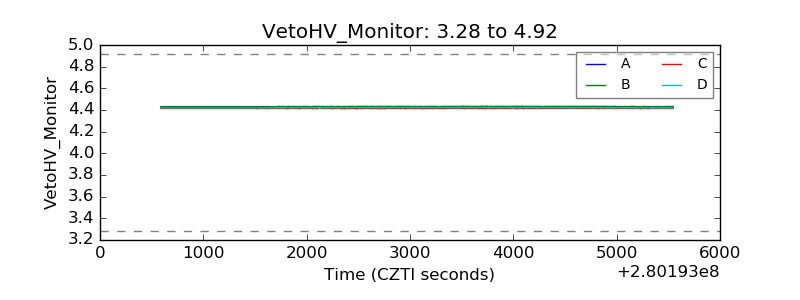 |
| Veto LLD | 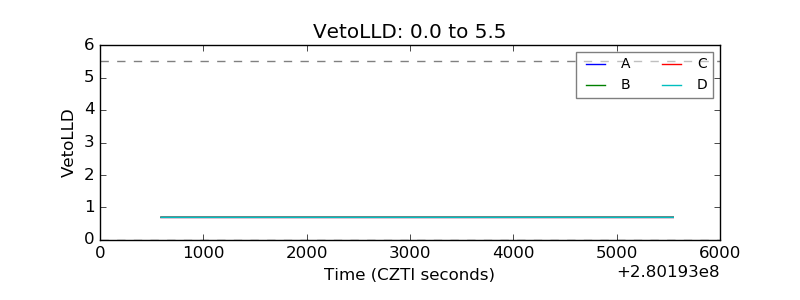 |
| Alpha Counter | 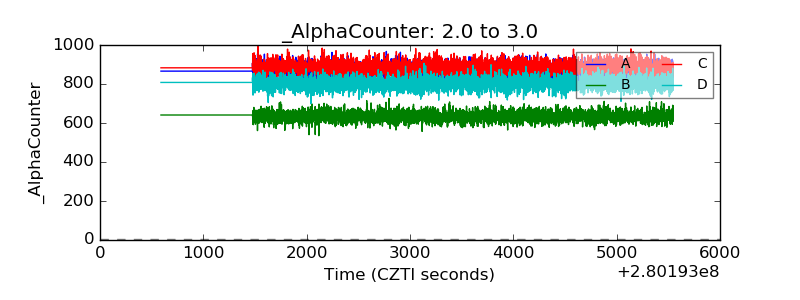 |
| _CPM_Rate | 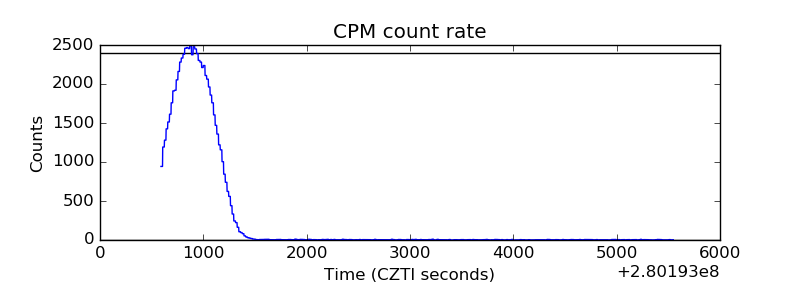 |
| CZT Counter | 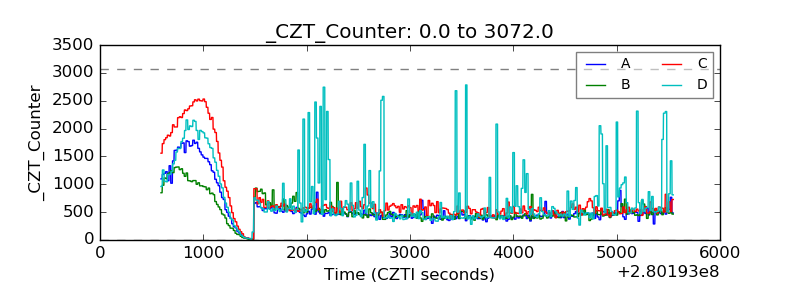 |
| +2.5 Volts monitor |  |
| +5 Volts monitor |  |
| _ROLL_ROT | 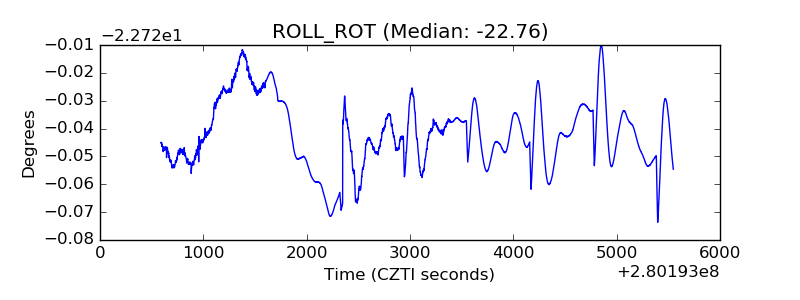 |
| _Roll_DEC | 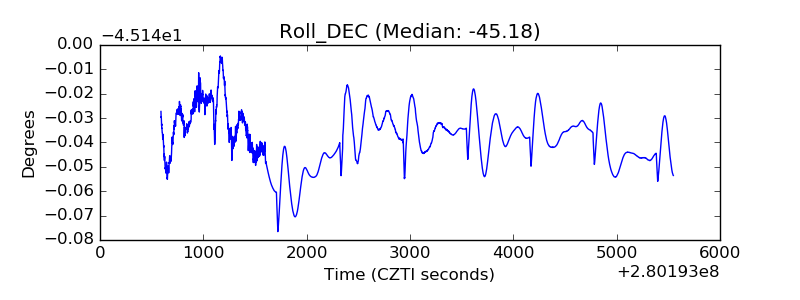 |
| _Roll_RA | 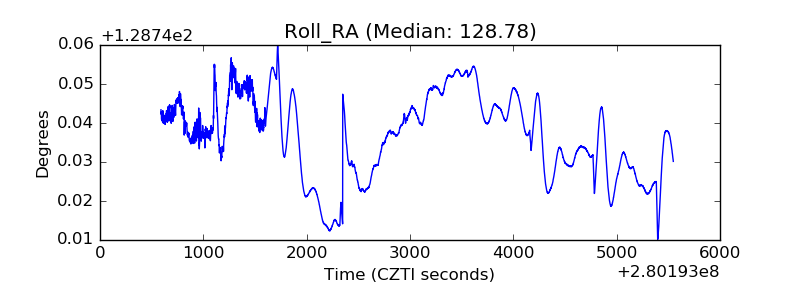 |
| Veto Counter | 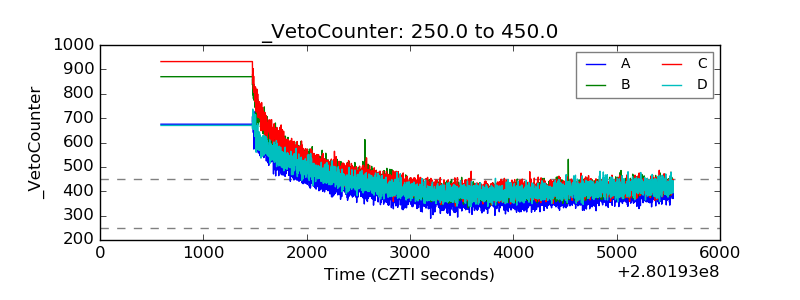 |