| Param | Original file | Final file |
|---|---|---|
| Filename | modeM0/AS1A05_143T01_9000002524cztM0_level2.fits | modeM0/AS1A05_143T01_9000002524cztM0_level2_quad_clean.evt |
| Size (bytes) | 954,610,560 | 854,596,800 |
| Size | 910.4 MB | 815.0 MB |
| Events in quadrant A | 5,857,928 | 5,059,218 |
| Events in quadrant B | 5,607,922 | 4,965,844 |
| Events in quadrant C | 5,798,106 | 4,812,184 |
| Events in quadrant D | 4,846,760 | 4,248,348 |
| Mode M9 | |||
|---|---|---|---|
| Quadrant | BADHDUFLAG | Total packets | Discarded packets |
| A | 0 | 175 | 0 |
| B | 0 | 175 | 0 |
| C | 0 | 175 | 0 |
| D | 0 | 175 | 0 |
| Mode SS | |||
|---|---|---|---|
| Quadrant | BADHDUFLAG | Total packets | Discarded packets |
| A | 0 | 2020 | 0 |
| B | 0 | 2020 | 0 |
| C | 0 | 2020 | 0 |
| D | 0 | 2020 | 0 |
| Mode M0 | |||
|---|---|---|---|
| Quadrant | BADHDUFLAG | Total packets | Discarded packets |
| A | 0 | 214399 | 0 |
| B | 0 | 232785 | 0 |
| C | 0 | 231581 | 0 |
| D | 0 | 303422 | 0 |
| Quadrant | Total seconds | Saturated seconds | Saturation percentage |
|---|---|---|---|
| A | 99144 | 2138 | 2.156459% |
| B | 99144 | 3259 | 3.287138% |
| C | 99144 | 1685 | 1.699548% |
| D | 99144 | 8016 | 8.085209% |
Noise dominated data is calculated using 1-second bins in cleaned event files. If a bin has >2000 counts, and if more than 50% of those come from <1% of pixels, then it is considered to be noise-dominated and hence unusable.
| Quadrant | # 1 sec bins | Bins with >0 counts | Bins with >2000 counts | High rate bins dominated by noise | Noise dominated (total time) | Noise dominated (detector-on time) | Marked lightcurve |
|---|---|---|---|---|---|---|---|
| A | 116540 | 99130 | 0 | 0 | 0.00% | 0.00% |  |
| B | 116540 | 99032 | 0 | 0 | 0.00% | 0.00% |  |
| C | 116540 | 99145 | 0 | 0 | 0.00% | 0.00% |  |
| D | 116540 | 99020 | 0 | 0 | 0.00% | 0.00% |  |
Top three noisy pixels from each quadrant. If the there are fewer than three noisy pixels in the level2.evt file, extra rows are filled as -1
| Pixel properties | Quadrant properties | ||||||
|---|---|---|---|---|---|---|---|
| Quadrant | DetID | PixID | Counts | Sigma | Mean | Median | Sigma |
| A | 0 | 29 | 5404 | 10.67 | 1522 | 1426 | 372.7 |
| A | 7 | 110 | 4779 | 9.0 | 1522 | 1426 | 372.7 |
| A | 9 | 19 | 4439 | 8.09 | 1522 | 1426 | 372.7 |
| B | 2 | 9 | 4631 | 10.91 | 1483 | 1410 | 295.2 |
| B | 2 | 8 | 3934 | 8.55 | 1483 | 1410 | 295.2 |
| B | 3 | 17 | 3793 | 8.07 | 1483 | 1410 | 295.2 |
| C | 12 | 241 | 3943 | 6.41 | 1532 | 1432 | 391.6 |
| C | 2 | 191 | 3906 | 6.32 | 1532 | 1432 | 391.6 |
| C | 3 | 126 | 3893 | 6.29 | 1532 | 1432 | 391.6 |
| D | 3 | 14 | 3499 | 6.14 | 1384 | 1261 | 364.6 |
| D | 10 | 189 | 3445 | 5.99 | 1384 | 1261 | 364.6 |
| D | 6 | 231 | 3433 | 5.96 | 1384 | 1261 | 364.6 |
Histogram calculated using DETX and DETY for each event in the final _common_clean file
| Quadrant A |  |
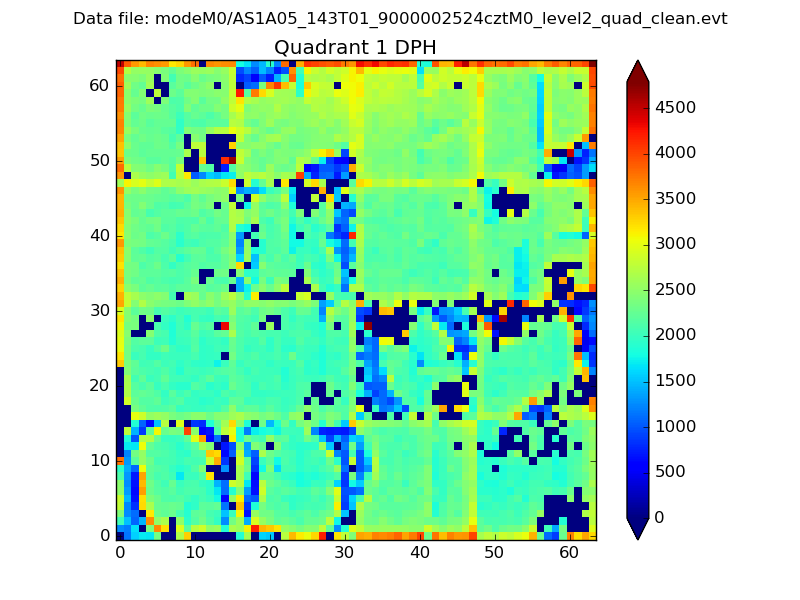 |
Quadrant B |
|---|---|---|---|
| Quadrant D |  |
 |
Quadrant C |
| Plot type | Count rate plots | Images |
|---|---|---|
| Comparison with Poisson distribution Blue bars denote a histogram of data divided into 1 sec bins. Red curve is a Poisson curve with rate = median count rate of data. |
 |
 |
| Quadrant-wise count rates Data is divided into 100 sec bins |
 |
|
| Module-wise count rates for Quadrant A Data is divided into 100 sec bins |
 |
 |
| Module-wise count rates for Quadrant B Data is divided into 100 sec bins |
 |
 |
| Module-wise count rates for Quadrant C Data is divided into 100 sec bins |
 |
 |
| Module-wise count rates for Quadrant D Data is divided into 100 sec bins |
 |
 |
| Parameter | Plot |
|---|---|
| CZT HV Monitor |  |
| D_VDD | 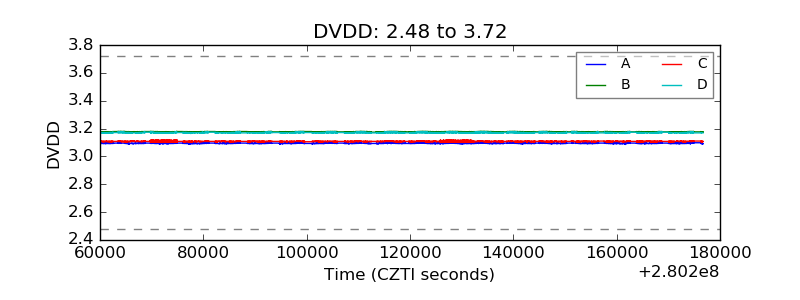 |
| Temperature 1 |  |
| Veto HV Monitor |  |
| Veto LLD |  |
| Alpha Counter |  |
| _CPM_Rate |  |
| CZT Counter |  |
| +2.5 Volts monitor | 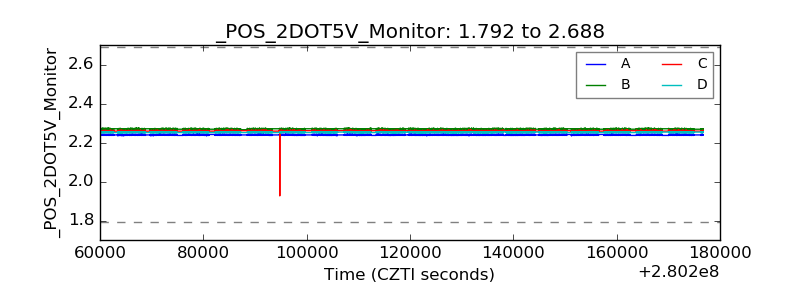 |
| +5 Volts monitor |  |
| _ROLL_ROT |  |
| _Roll_DEC |  |
| _Roll_RA |  |
| Veto Counter |  |