| Param | Original file | Final file |
|---|---|---|
| Filename | modeM0/AS1A05_143T01_9000002524_16986cztM0_level2.evt | modeM0/AS1A05_143T01_9000002524_16986cztM0_level2_quad_clean.evt |
| Size (bytes) | 73,434,240 | 19,200,960 |
| Size | 70.0 MB | 18.3 MB |
| Events in quadrant A | 432,568 | 127,511 |
| Events in quadrant B | 610,478 | 127,190 |
| Events in quadrant C | 630,583 | 121,845 |
| Events in quadrant D | 475,064 | 123,246 |
| Mode SS | |||
|---|---|---|---|
| Quadrant | BADHDUFLAG | Total packets | Discarded packets |
| A | 0 | 22 | 0 |
| B | 0 | 22 | 0 |
| C | 0 | 22 | 0 |
| D | 0 | 22 | 0 |
| Mode M0 | |||
|---|---|---|---|
| Quadrant | BADHDUFLAG | Total packets | Discarded packets |
| A | 0 | 2111 | 0 |
| B | 0 | 2510 | 0 |
| C | 0 | 2593 | 0 |
| D | 0 | 2166 | 0 |
| Quadrant | Total seconds | Saturated seconds | Saturation percentage |
|---|---|---|---|
| A | 1055 | 0 | 0.000000% |
| B | 1055 | 2 | 0.189573% |
| C | 1055 | 4 | 0.379147% |
| D | 1055 | 0 | 0.000000% |
Noise dominated data is calculated using 1-second bins in cleaned event files. If a bin has >2000 counts, and if more than 50% of those come from <1% of pixels, then it is considered to be noise-dominated and hence unusable.
| Quadrant | # 1 sec bins | Bins with >0 counts | Bins with >2000 counts | High rate bins dominated by noise | Noise dominated (total time) | Noise dominated (detector-on time) | Marked lightcurve |
|---|---|---|---|---|---|---|---|
| A | 1056 | 1056 | 0 | 0 | 0.00% | 0.00% | 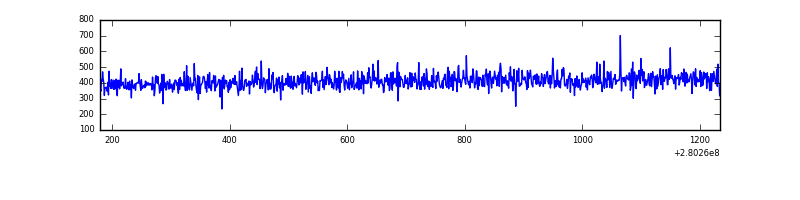 |
| B | 1056 | 1056 | 2 | 2 | 0.19% | 0.19% | 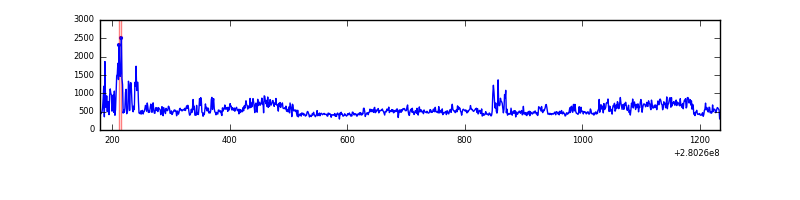 |
| C | 1056 | 1056 | 0 | 0 | 0.00% | 0.00% | 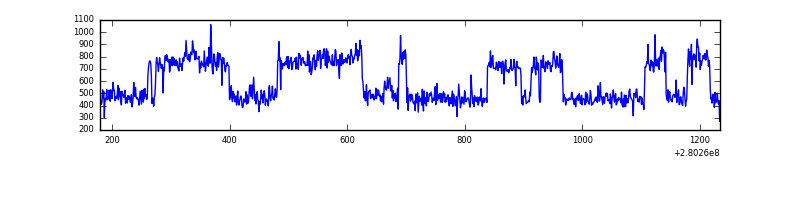 |
| D | 1056 | 1056 | 0 | 0 | 0.00% | 0.00% | 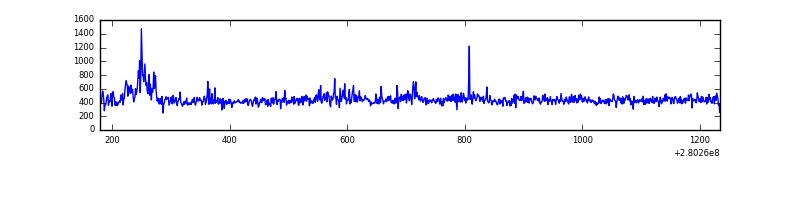 |
Top three noisy pixels from each quadrant. If the there are fewer than three noisy pixels in the level2.evt file, extra rows are filled as -1
| Pixel properties | Quadrant properties | ||||||
|---|---|---|---|---|---|---|---|
| Quadrant | DetID | PixID | Counts | Sigma | Mean | Median | Sigma |
| A | 0 | 226 | 1019 | 36.2 | 112 | 109 | 25.1 |
| A | 3 | 137 | 811 | 27.93 | 112 | 109 | 25.1 |
| A | 12 | 194 | 790 | 27.09 | 112 | 109 | 25.1 |
| B | 3 | 64 | 162553 | 6823.46 | 113 | 109 | 23.8 |
| B | 0 | 229 | 5113 | 210.19 | 113 | 109 | 23.8 |
| B | 12 | 111 | 2492 | 100.1 | 113 | 109 | 23.8 |
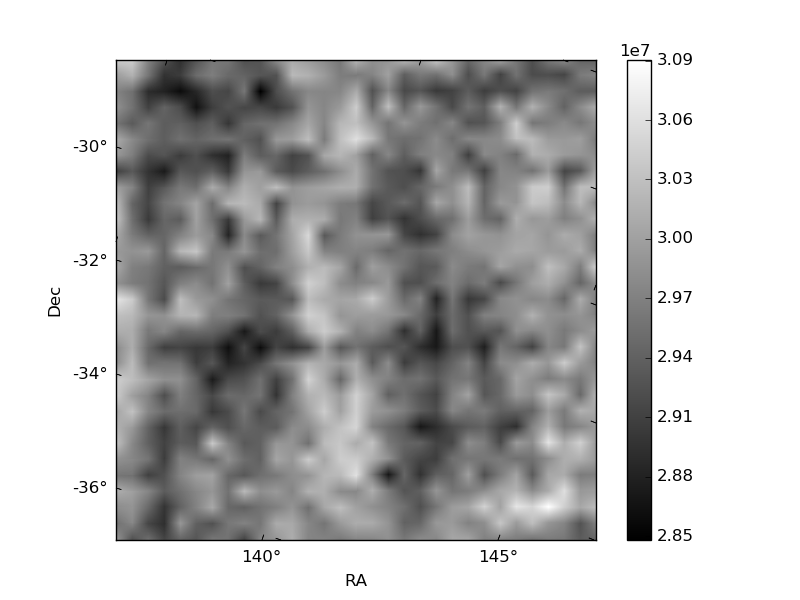
| C | 3 | 233 | 179850 | 6460.3 | 111 | 111 | 27.8 |
| C | 14 | 238 | 16759 | 598.37 | 111 | 111 | 27.8 |
| C | 13 | 61 | 827 | 25.73 | 111 | 111 | 27.8 |
| D | 1 | 52 | 50076 | 1736.77 | 111 | 108 | 28.8 |
| D | 2 | 234 | 4128 | 139.73 | 111 | 108 | 28.8 |
| D | 2 | 152 | 2670 | 89.05 | 111 | 108 | 28.8 |
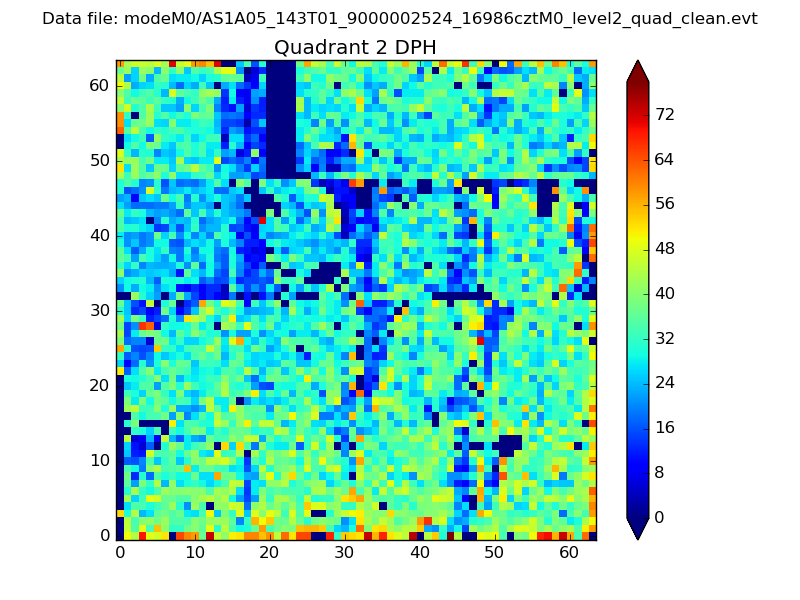
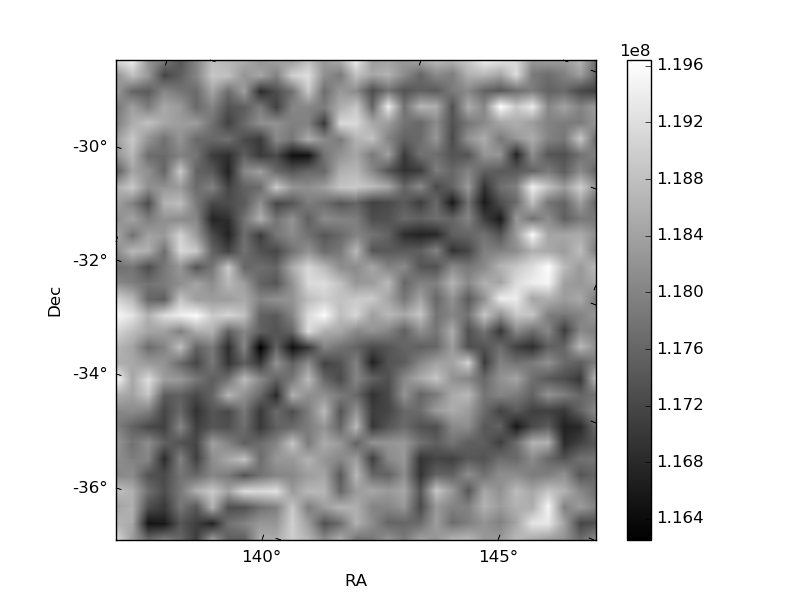
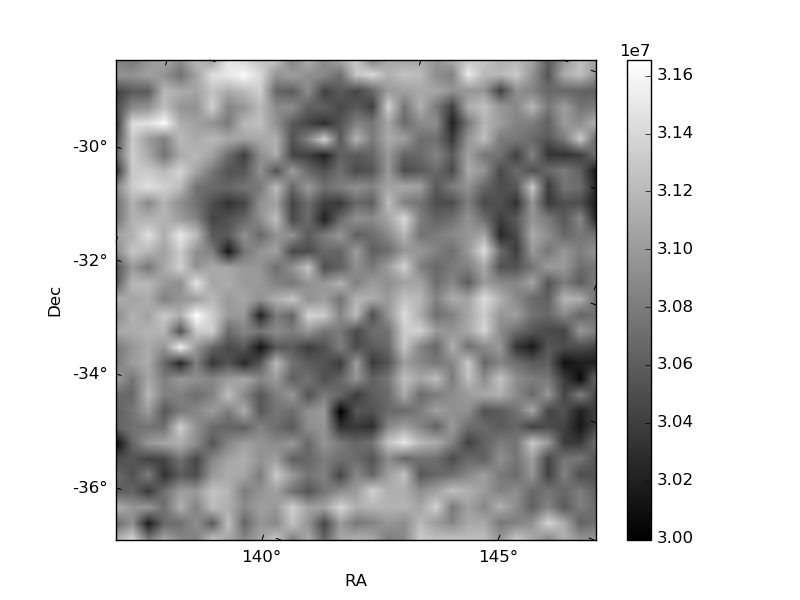
Histogram calculated using DETX and DETY for each event in the final _common_clean file
| Quadrant A | 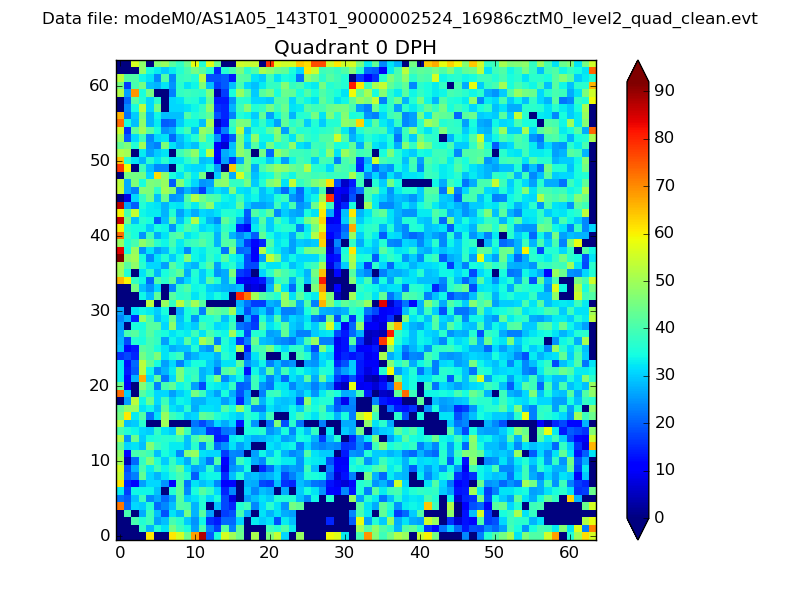 |
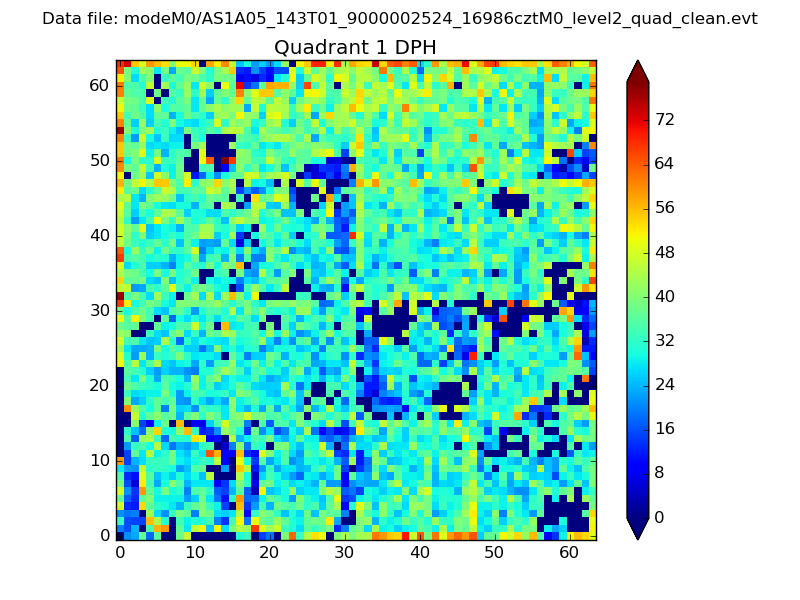 |
Quadrant B |
|---|---|---|---|
| Quadrant D | 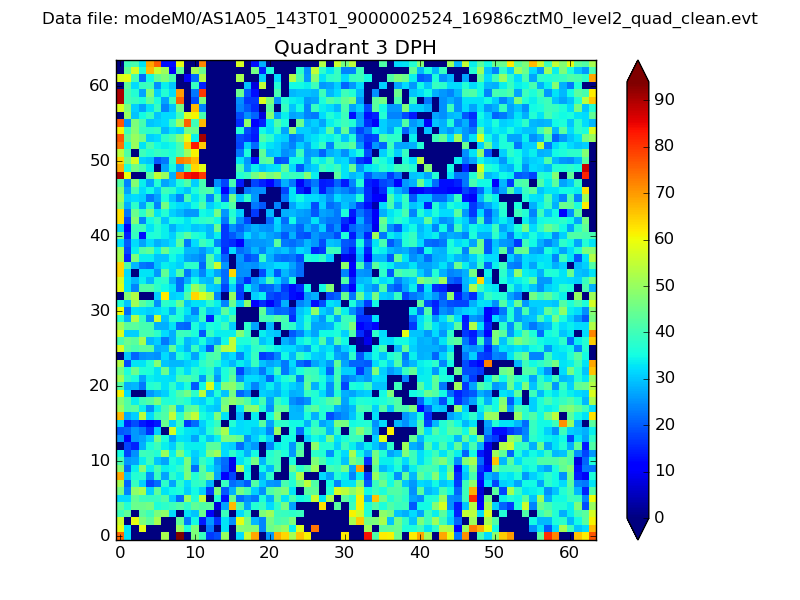 |
 |
Quadrant C |
| Plot type | Count rate plots | Images |
|---|---|---|
| Comparison with Poisson distribution Blue bars denote a histogram of data divided into 1 sec bins. Red curve is a Poisson curve with rate = median count rate of data. |
 |
 |
| Quadrant-wise count rates Data is divided into 100 sec bins |
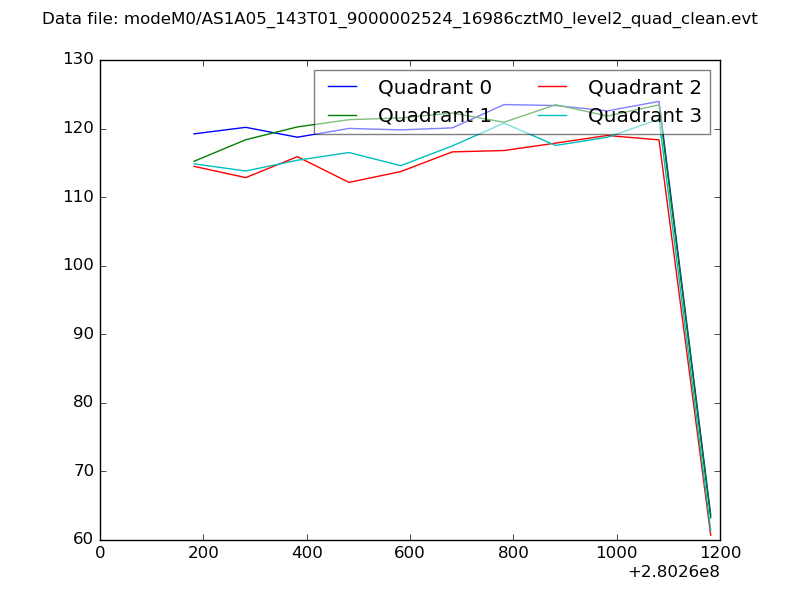 |
|
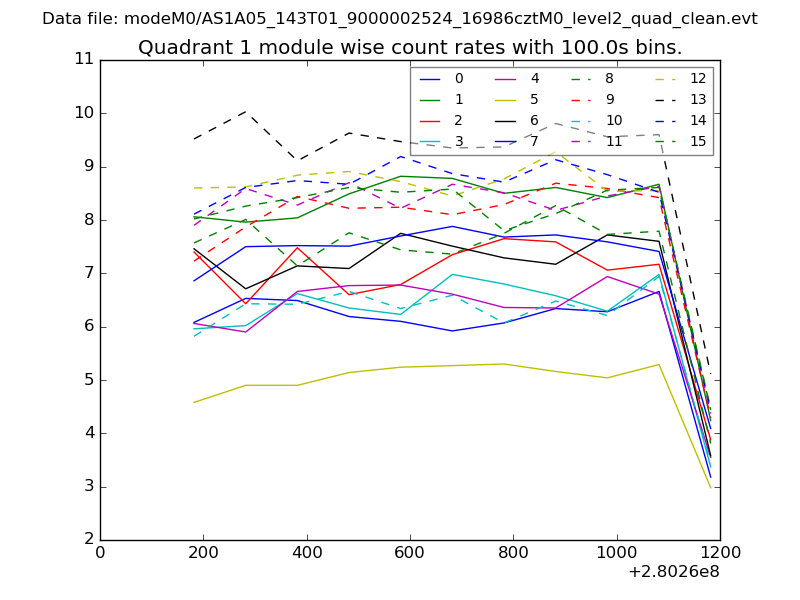
| Module-wise count rates for Quadrant A Data is divided into 100 sec bins |
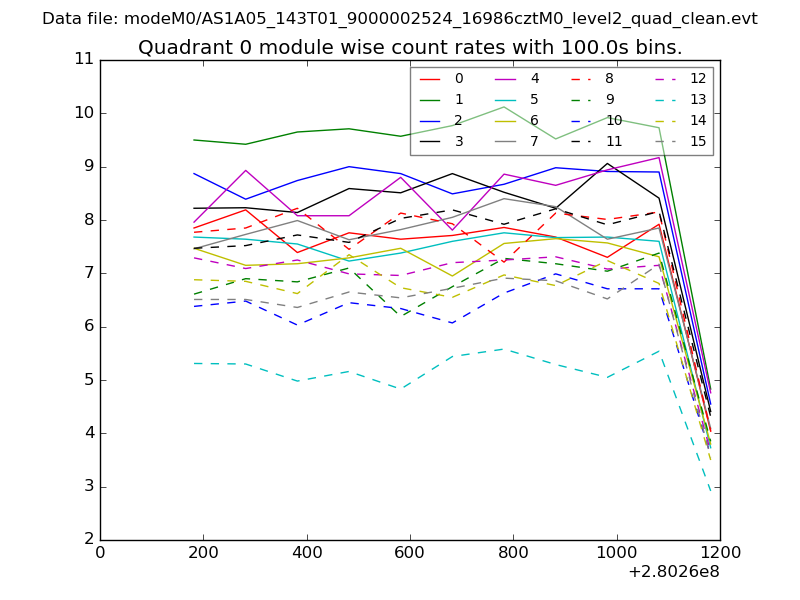 |
 |
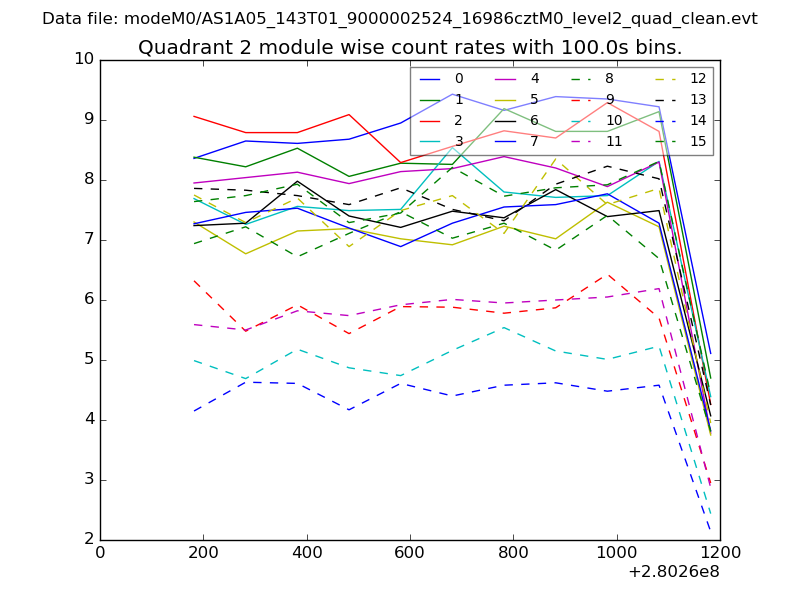
| Module-wise count rates for Quadrant B Data is divided into 100 sec bins |
 |
 |
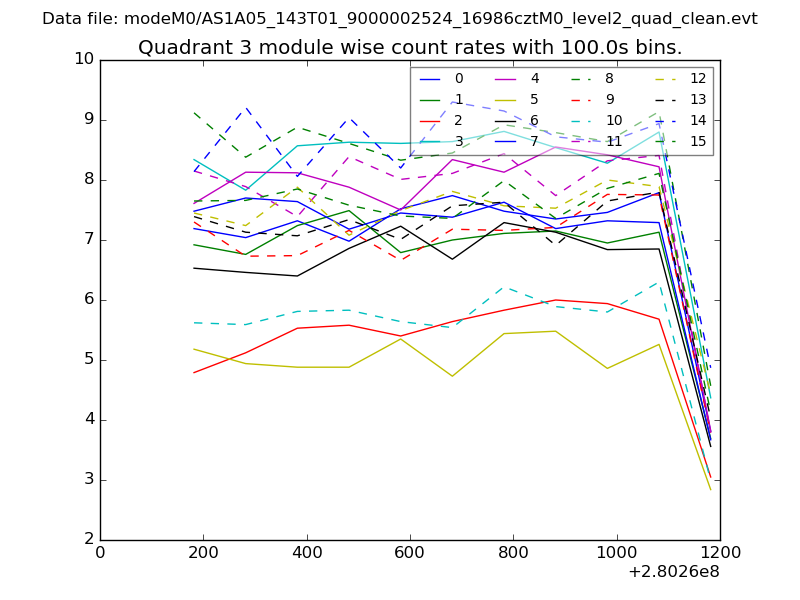
| Module-wise count rates for Quadrant C Data is divided into 100 sec bins |
 |
 |
| Module-wise count rates for Quadrant D Data is divided into 100 sec bins |
 |
 |
| Parameter | Plot |
|---|---|
| CZT HV Monitor | 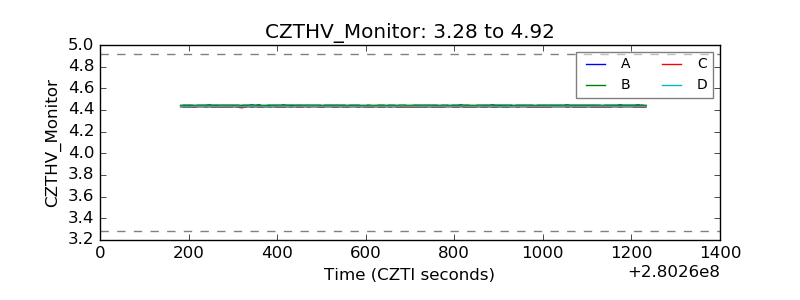 |
| D_VDD | 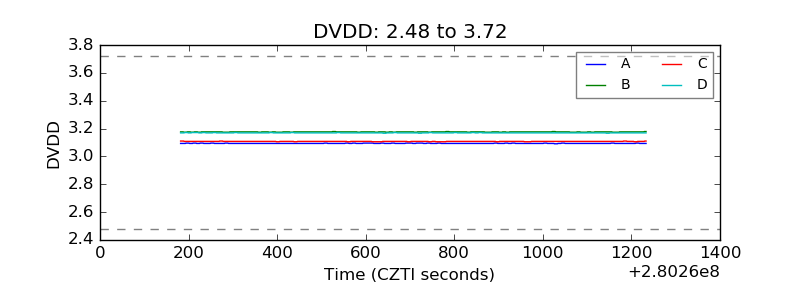 |
| Temperature 1 | 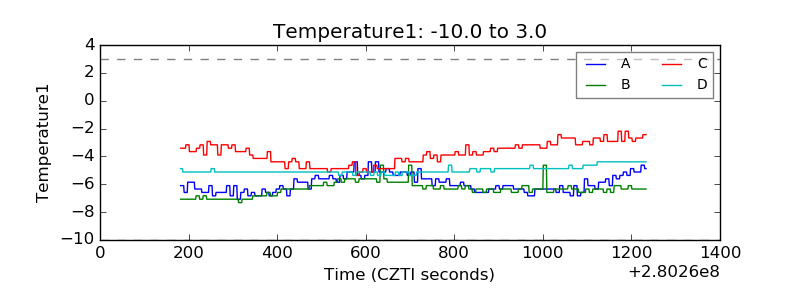 |
| Veto HV Monitor |  |
| Veto LLD | 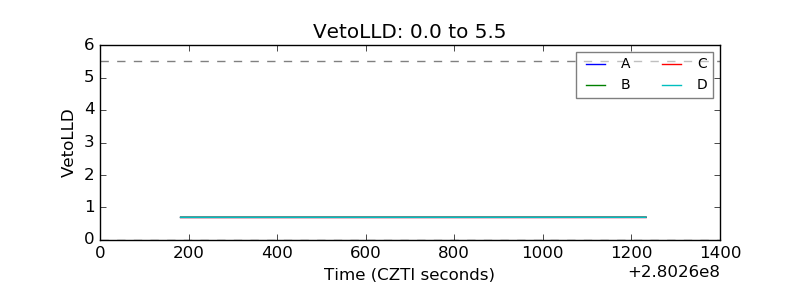 |
| Alpha Counter | 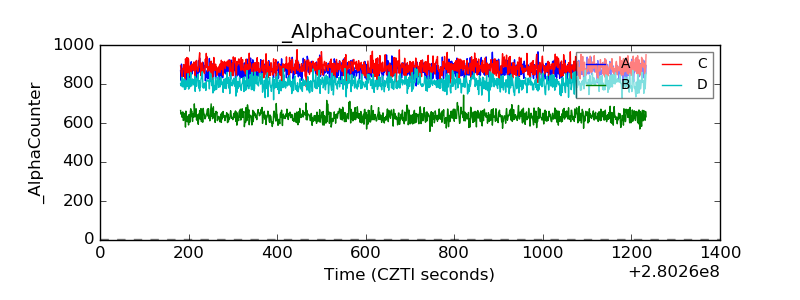 |
| _CPM_Rate | 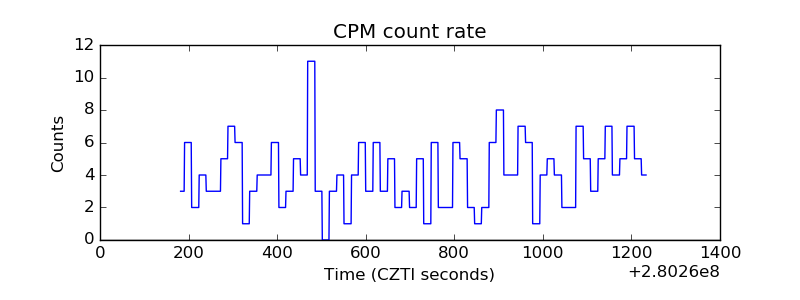 |
| CZT Counter | 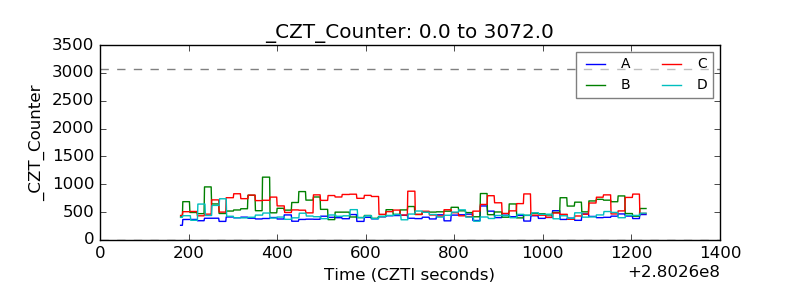 |
| +2.5 Volts monitor |  |
| +5 Volts monitor | 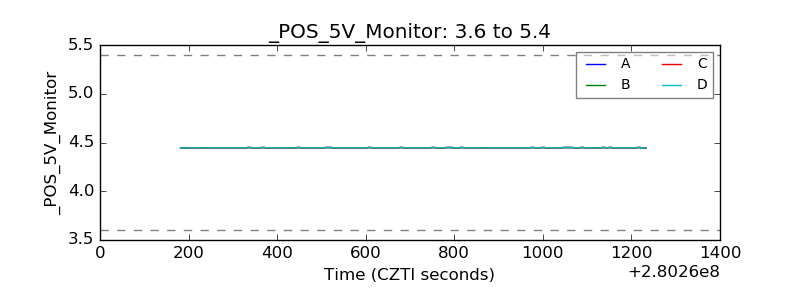 |
| _ROLL_ROT |  |
| _Roll_DEC |  |
| _Roll_RA | 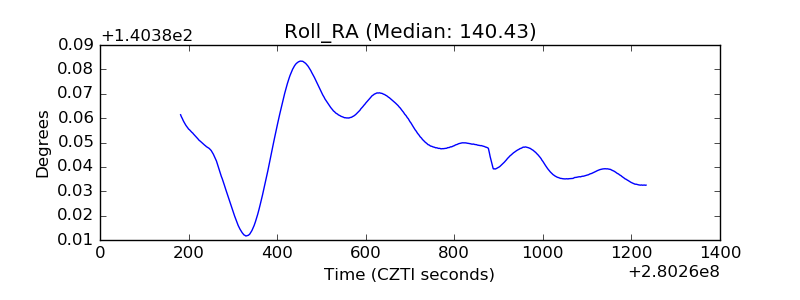 |
| Veto Counter | 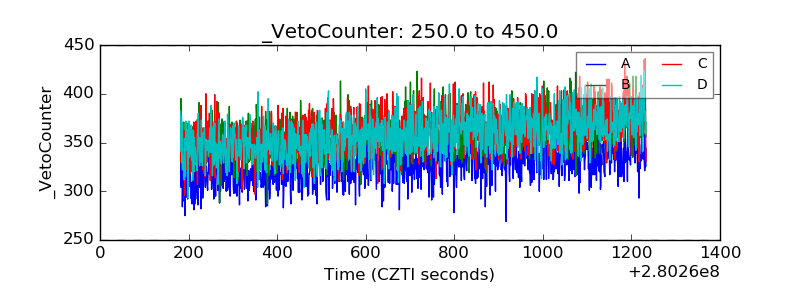 |