| Param | Original file | Final file |
|---|---|---|
| Filename | modeM0/AS1A05_143T01_9000002524_16987cztM0_level2.evt | modeM0/AS1A05_143T01_9000002524_16987cztM0_level2_quad_clean.evt |
| Size (bytes) | 715,792,320 | 104,702,400 |
| Size | 682.6 MB | 99.9 MB |
| Events in quadrant A | 4,229,264 | 665,923 |
| Events in quadrant B | 4,526,123 | 673,465 |
| Events in quadrant C | 5,236,018 | 643,899 |
| Events in quadrant D | 7,135,829 | 621,707 |
| Mode M9 | |||
|---|---|---|---|
| Quadrant | BADHDUFLAG | Total packets | Discarded packets |
| A | 0 | 17 | 0 |
| B | 0 | 17 | 0 |
| C | 0 | 17 | 0 |
| D | 0 | 17 | 0 |
| Mode SS | |||
|---|---|---|---|
| Quadrant | BADHDUFLAG | Total packets | Discarded packets |
| A | 0 | 166 | 0 |
| B | 0 | 166 | 0 |
| C | 0 | 166 | 0 |
| D | 0 | 164 | 0 |
| Mode M0 | |||
|---|---|---|---|
| Quadrant | BADHDUFLAG | Total packets | Discarded packets |
| A | 0 | 17902 | 2 |
| B | 0 | 18516 | 2 |
| C | 0 | 21429 | 2 |
| D | 0 | 26762 | 3 |
| Quadrant | Total seconds | Saturated seconds | Saturation percentage |
|---|---|---|---|
| A | 8145 | 149 | 1.829343% |
| B | 8145 | 147 | 1.804788% |
| C | 8146 | 155 | 1.902774% |
| D | 8145 | 868 | 10.656845% |
Noise dominated data is calculated using 1-second bins in cleaned event files. If a bin has >2000 counts, and if more than 50% of those come from <1% of pixels, then it is considered to be noise-dominated and hence unusable.
| Quadrant | # 1 sec bins | Bins with >0 counts | Bins with >2000 counts | High rate bins dominated by noise | Noise dominated (total time) | Noise dominated (detector-on time) | Marked lightcurve |
|---|---|---|---|---|---|---|---|
| A | 9771 | 8148 | 42 | 42 | 0.43% | 0.52% | 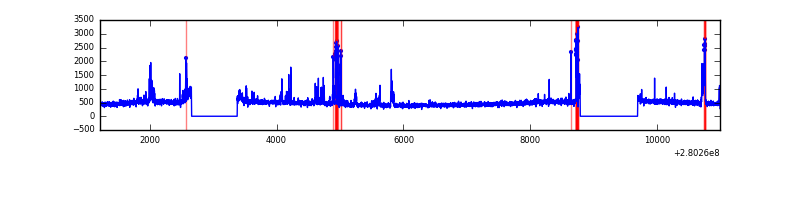 |
| B | 9771 | 8148 | 20 | 20 | 0.20% | 0.25% | 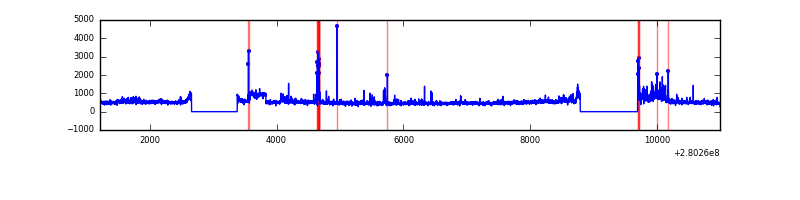 |
| C | 9772 | 8149 | 2 | 2 | 0.02% | 0.02% | 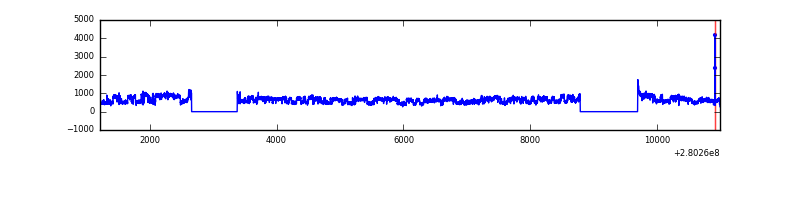 |
| D | 9771 | 8148 | 615 | 615 | 6.29% | 7.55% | 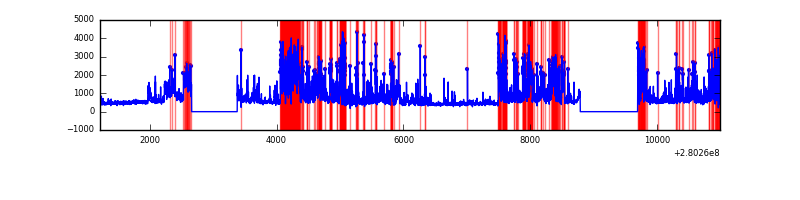 |
Top three noisy pixels from each quadrant. If the there are fewer than three noisy pixels in the level2.evt file, extra rows are filled as -1
| Pixel properties | Quadrant properties | ||||||
|---|---|---|---|---|---|---|---|
| Quadrant | DetID | PixID | Counts | Sigma | Mean | Median | Sigma |
| A | 15 | 174 | 423168 | 2101.12 | 989 | 965 | 200.9 |
| A | 0 | 226 | 8718 | 38.58 | 989 | 965 | 200.9 |
| A | 12 | 194 | 7363 | 31.84 | 989 | 965 | 200.9 |
| B | 3 | 64 | 225935 | 1177.28 | 991 | 966 | 191.1 |
| B | 0 | 189 | 121385 | 630.16 | 991 | 966 | 191.1 |
| B | 0 | 229 | 74486 | 384.74 | 991 | 966 | 191.1 |
| C | 3 | 233 | 1362359 | 6105.82 | 953 | 958 | 223.0 |
| C | 14 | 238 | 146120 | 651.04 | 953 | 958 | 223.0 |
| C | 5 | 112 | 8595 | 34.25 | 953 | 958 | 223.0 |
| D | 1 | 52 | 3524933 | 15762.76 | 923 | 895 | 223.6 |
| D | 15 | 145 | 32364 | 140.76 | 923 | 895 | 223.6 |
| D | 2 | 234 | 31614 | 137.4 | 923 | 895 | 223.6 |
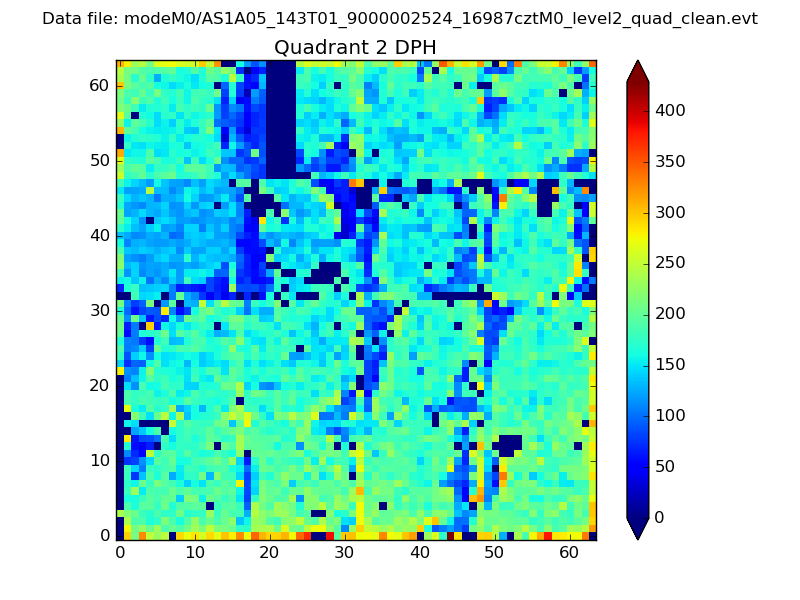
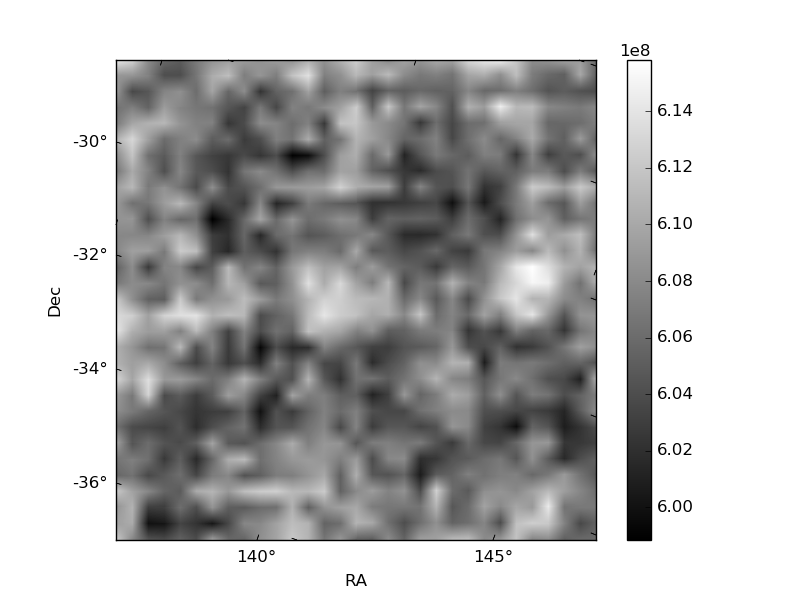
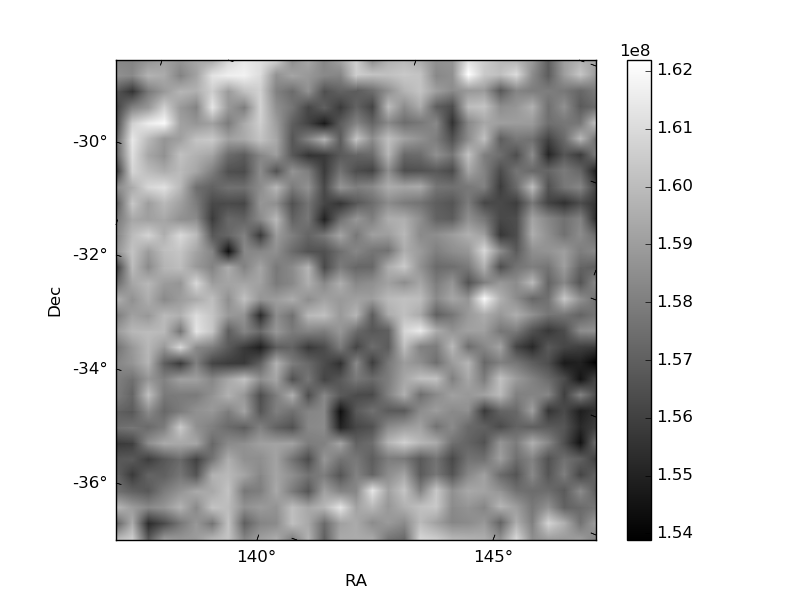
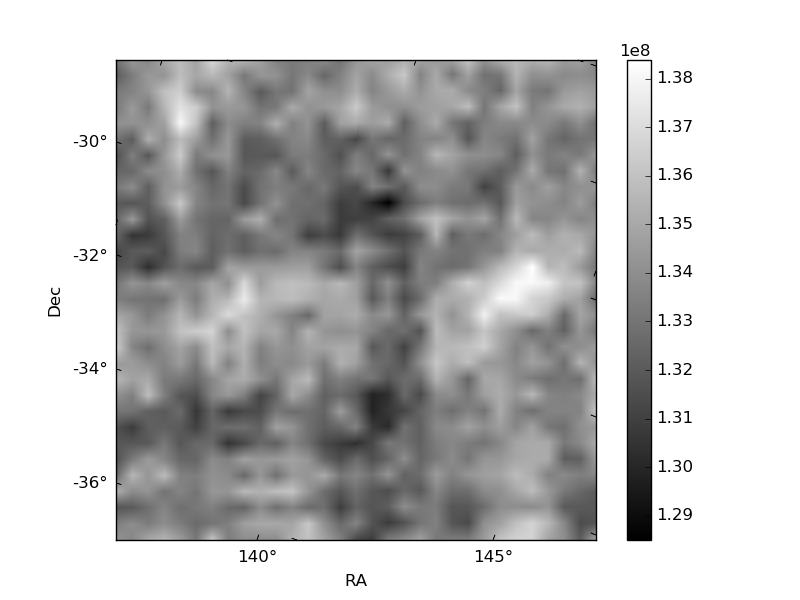
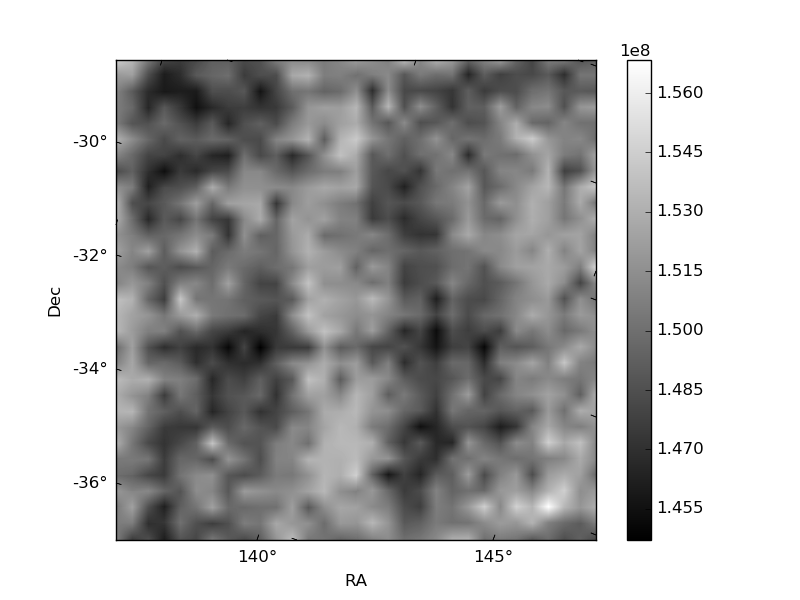
Histogram calculated using DETX and DETY for each event in the final _common_clean file
| Quadrant A | 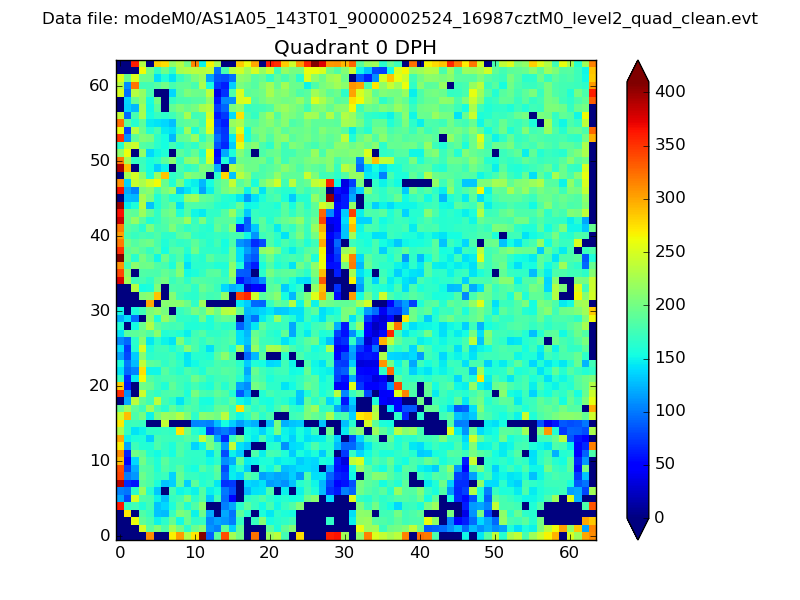 |
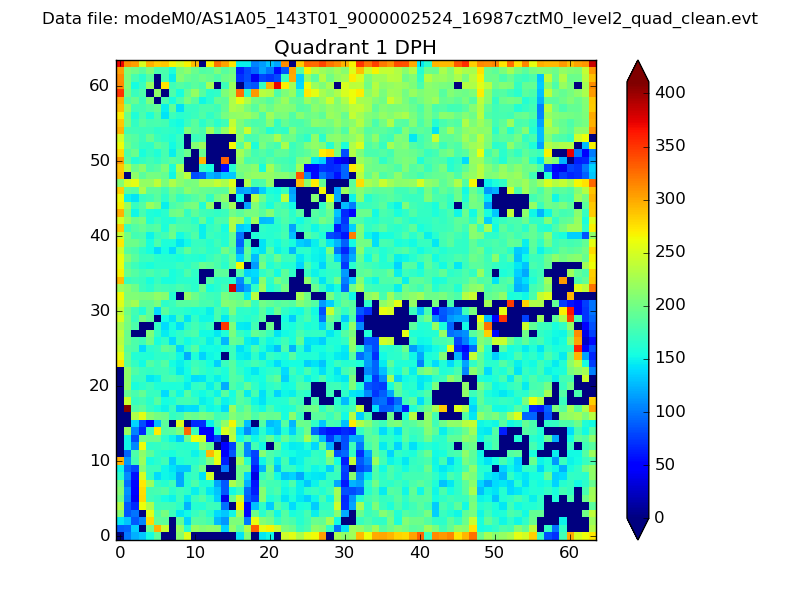 |
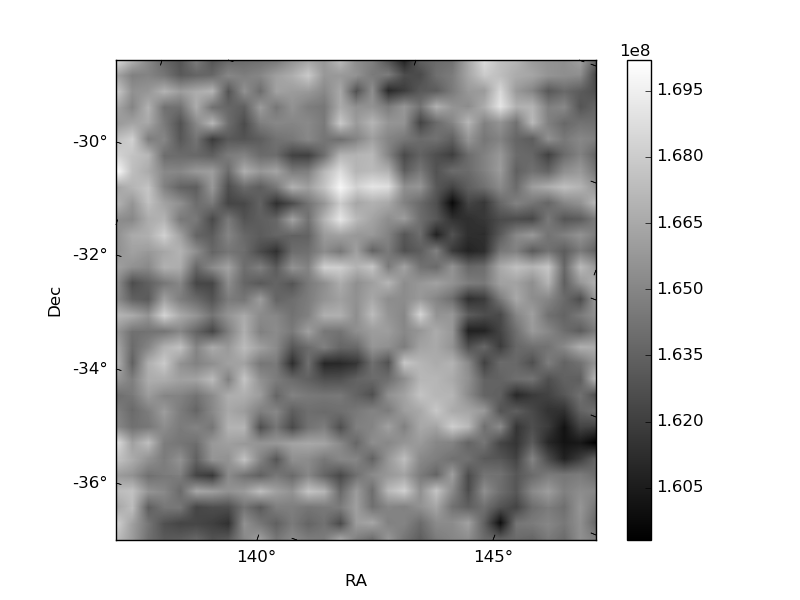
Quadrant B |
|---|---|---|---|
| Quadrant D | 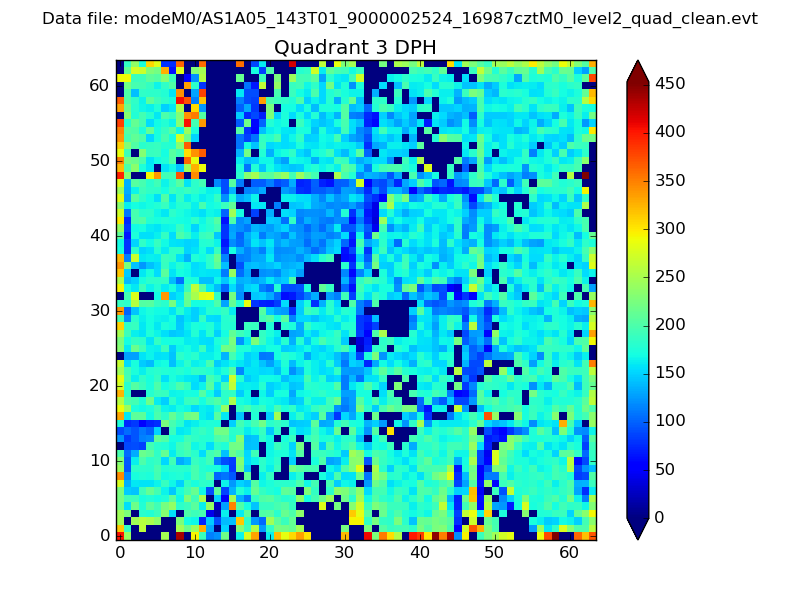 |
 |
Quadrant C |
| Plot type | Count rate plots | Images |
|---|---|---|
| Comparison with Poisson distribution Blue bars denote a histogram of data divided into 1 sec bins. Red curve is a Poisson curve with rate = median count rate of data. |
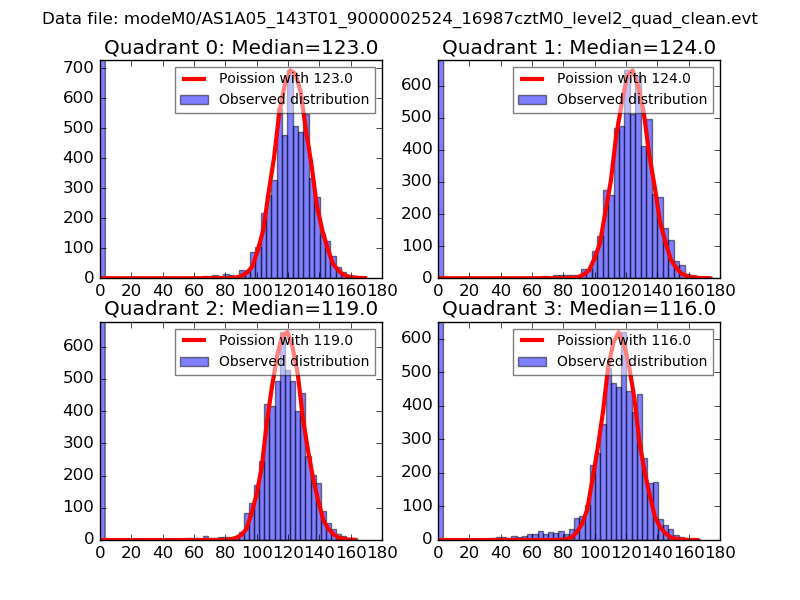 |
 |
| Quadrant-wise count rates Data is divided into 100 sec bins |
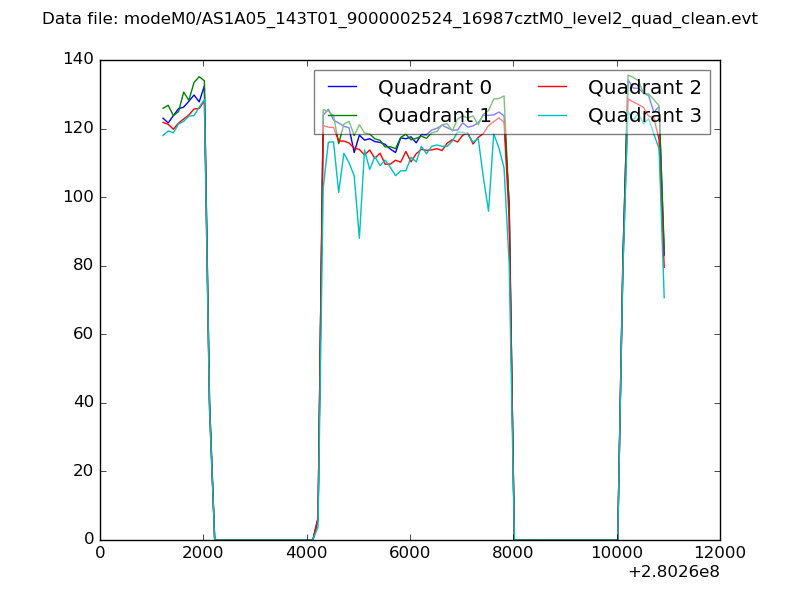 |
|
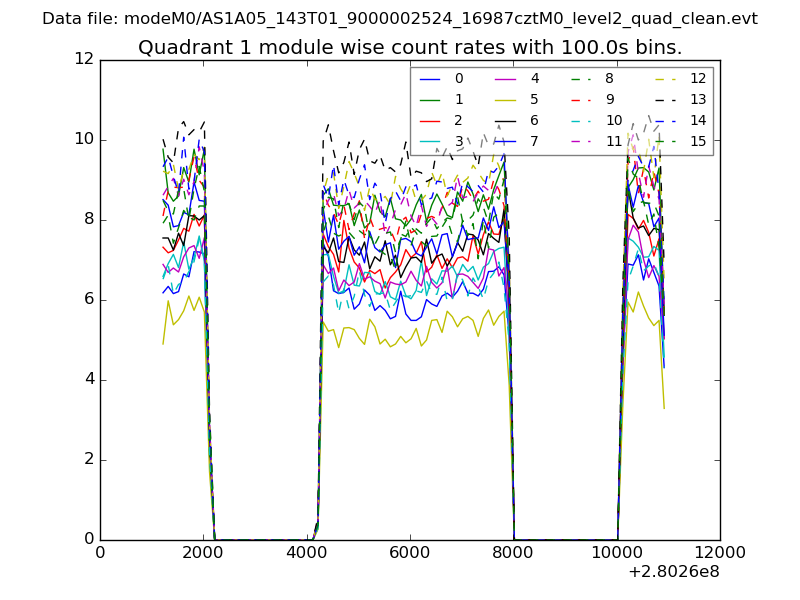
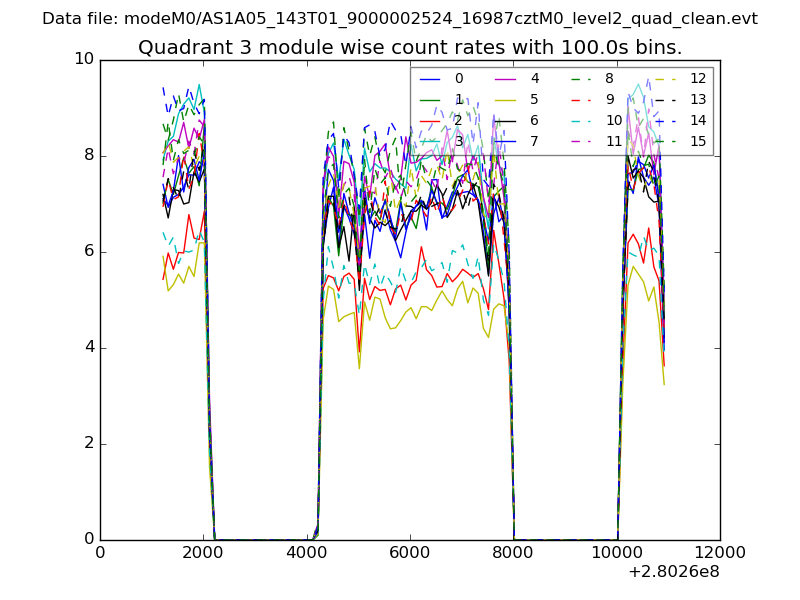
| Module-wise count rates for Quadrant A Data is divided into 100 sec bins |
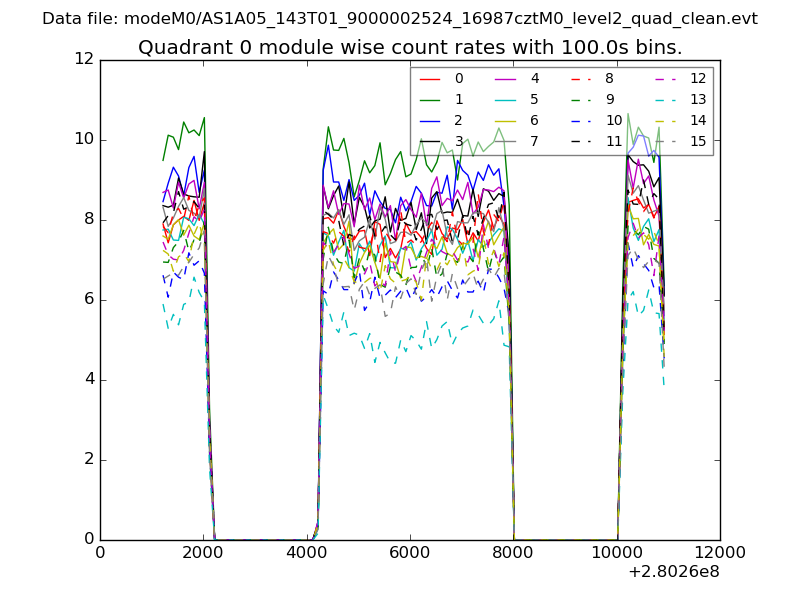 |
 |
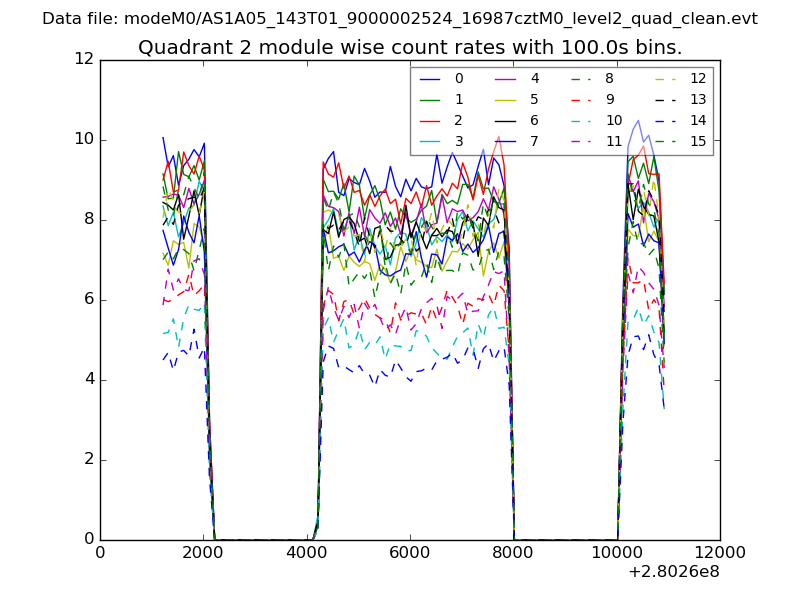
| Module-wise count rates for Quadrant B Data is divided into 100 sec bins |
 |
 |
| Module-wise count rates for Quadrant C Data is divided into 100 sec bins |
 |
 |
| Module-wise count rates for Quadrant D Data is divided into 100 sec bins |
 |
 |
| Parameter | Plot |
|---|---|
| CZT HV Monitor |  |
| D_VDD | 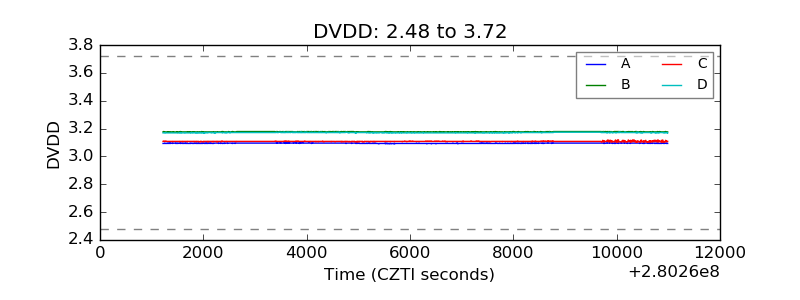 |
| Temperature 1 | 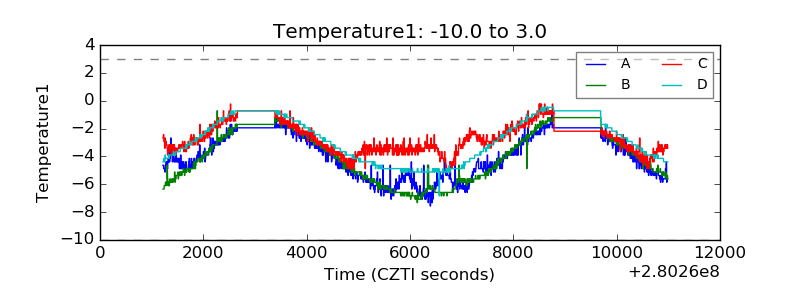 |
| Veto HV Monitor | 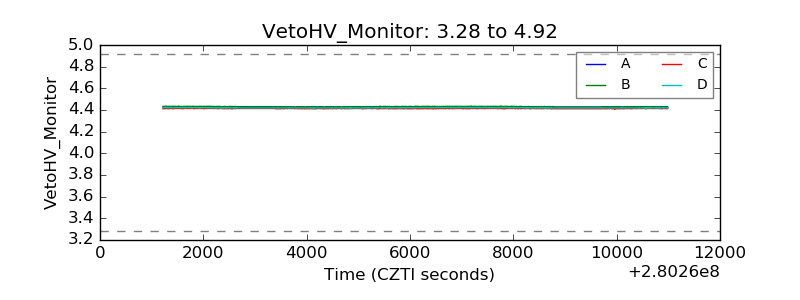 |
| Veto LLD | 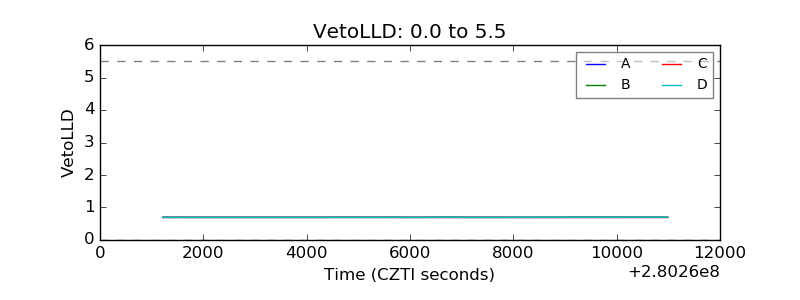 |
| Alpha Counter | 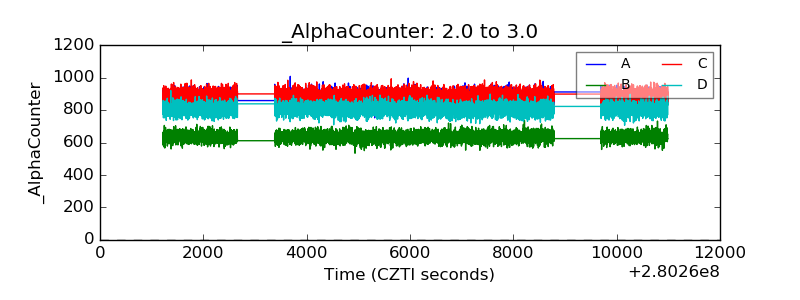 |
| _CPM_Rate | 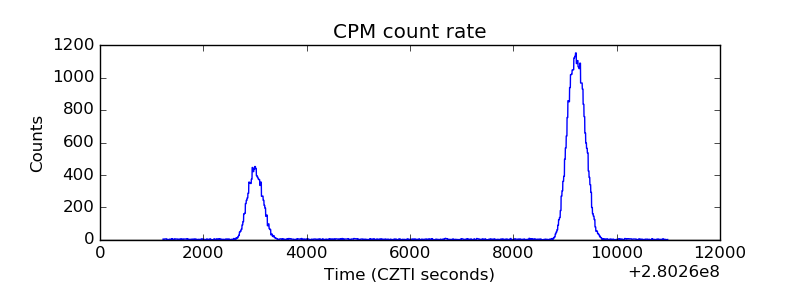 |
| CZT Counter | 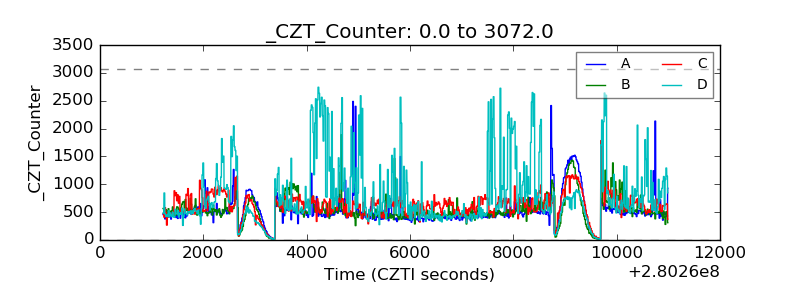 |
| +2.5 Volts monitor |  |
| +5 Volts monitor |  |
| _ROLL_ROT | 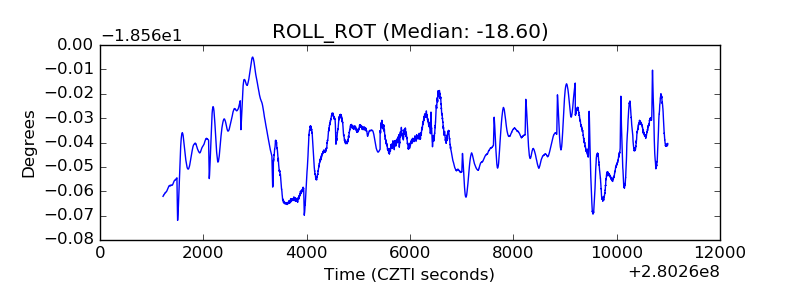 |
| _Roll_DEC | 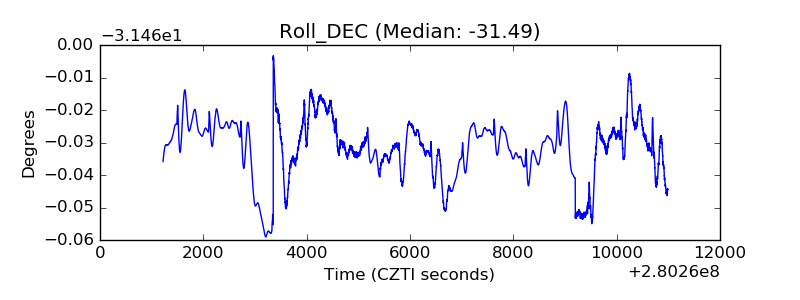 |
| _Roll_RA | 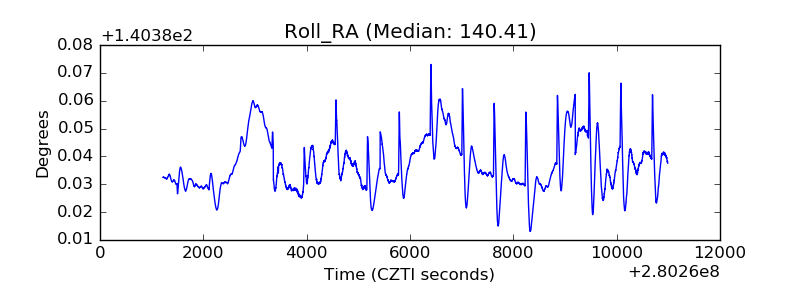 |
| Veto Counter | 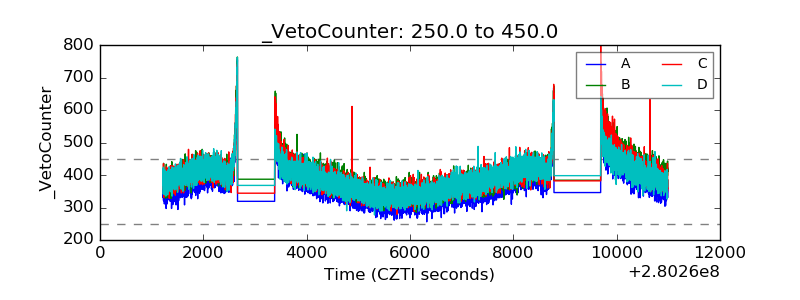 |