| Param | Original file | Final file |
|---|---|---|
| Filename | modeM0/AS1A05_143T01_9000002524_16988cztM0_level2.evt | modeM0/AS1A05_143T01_9000002524_16988cztM0_level2_quad_clean.evt |
| Size (bytes) | 608,359,680 | 95,967,360 |
| Size | 580.2 MB | 91.5 MB |
| Events in quadrant A | 3,353,064 | 625,677 |
| Events in quadrant B | 4,651,256 | 627,149 |
| Events in quadrant C | 4,086,693 | 606,348 |
| Events in quadrant D | 5,875,343 | 575,370 |
| Mode M9 | |||
|---|---|---|---|
| Quadrant | BADHDUFLAG | Total packets | Discarded packets |
| A | 0 | 21 | 0 |
| B | 0 | 21 | 0 |
| C | 0 | 21 | 0 |
| D | 0 | 21 | 0 |
| Mode SS | |||
|---|---|---|---|
| Quadrant | BADHDUFLAG | Total packets | Discarded packets |
| A | 0 | 136 | 0 |
| B | 0 | 136 | 0 |
| C | 0 | 136 | 0 |
| D | 0 | 136 | 0 |
| Mode M0 | |||
|---|---|---|---|
| Quadrant | BADHDUFLAG | Total packets | Discarded packets |
| A | 0 | 14453 | 2 |
| B | 0 | 18357 | 2 |
| C | 0 | 16670 | 2 |
| D | 0 | 22117 | 2 |
| Quadrant | Total seconds | Saturated seconds | Saturation percentage |
|---|---|---|---|
| A | 6775 | 113 | 1.667897% |
| B | 6776 | 339 | 5.002952% |
| C | 6776 | 119 | 1.756198% |
| D | 6776 | 643 | 9.489374% |
Noise dominated data is calculated using 1-second bins in cleaned event files. If a bin has >2000 counts, and if more than 50% of those come from <1% of pixels, then it is considered to be noise-dominated and hence unusable.
| Quadrant | # 1 sec bins | Bins with >0 counts | Bins with >2000 counts | High rate bins dominated by noise | Noise dominated (total time) | Noise dominated (detector-on time) | Marked lightcurve |
|---|---|---|---|---|---|---|---|
| A | 8736 | 6778 | 29 | 29 | 0.33% | 0.43% | 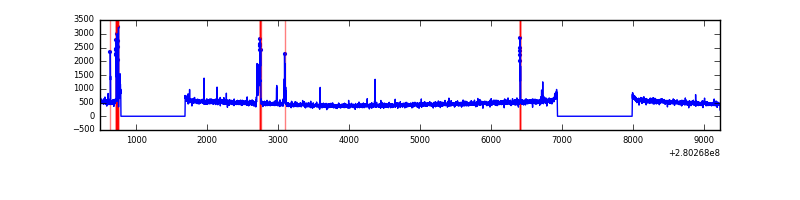 |
| B | 8737 | 6779 | 211 | 211 | 2.42% | 3.11% | 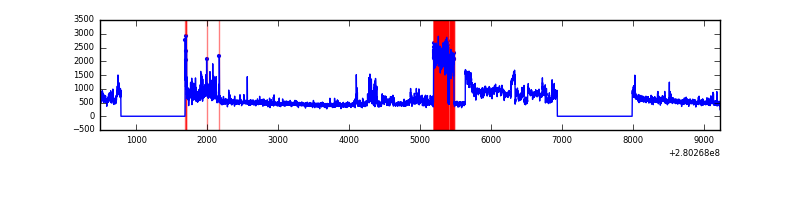 |
| C | 8737 | 6779 | 2 | 2 | 0.02% | 0.03% | 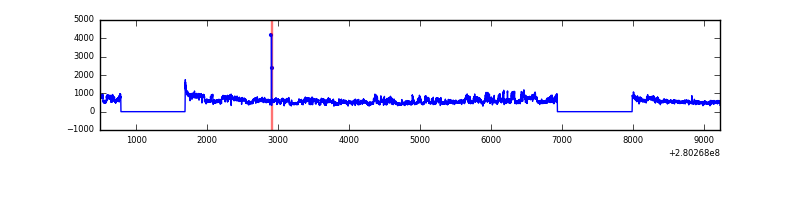 |
| D | 8737 | 6779 | 480 | 480 | 5.49% | 7.08% | 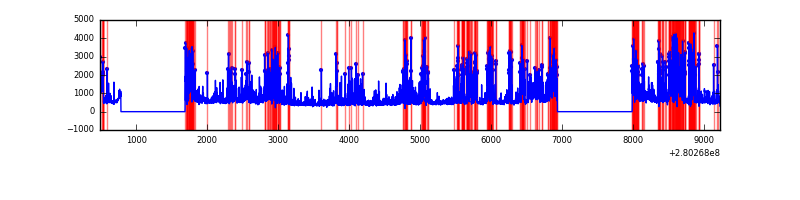 |
Top three noisy pixels from each quadrant. If the there are fewer than three noisy pixels in the level2.evt file, extra rows are filled as -1
| Pixel properties | Quadrant properties | ||||||
|---|---|---|---|---|---|---|---|
| Quadrant | DetID | PixID | Counts | Sigma | Mean | Median | Sigma |
| A | 15 | 174 | 174489 | 1036.6 | 826 | 806 | 167.6 |
| A | 0 | 226 | 7269 | 38.57 | 826 | 806 | 167.6 |
| A | 12 | 194 | 6074 | 31.44 | 826 | 806 | 167.6 |
| B | 3 | 64 | 1102293 | 6902.94 | 828 | 807 | 159.6 |
| B | 0 | 189 | 112773 | 701.68 | 828 | 807 | 159.6 |
| B | 15 | 35 | 66606 | 412.36 | 828 | 807 | 159.6 |
| C | 3 | 233 | 825999 | 4409.38 | 799 | 805 | 187.1 |
| C | 14 | 238 | 122712 | 651.4 | 799 | 805 | 187.1 |
| C | 8 | 128 | 10041 | 49.35 | 799 | 805 | 187.1 |
| D | 1 | 52 | 2860565 | 15203.43 | 774 | 751 | 188.1 |
| D | 15 | 145 | 28863 | 149.45 | 774 | 751 | 188.1 |
| D | 2 | 234 | 26965 | 139.36 | 774 | 751 | 188.1 |
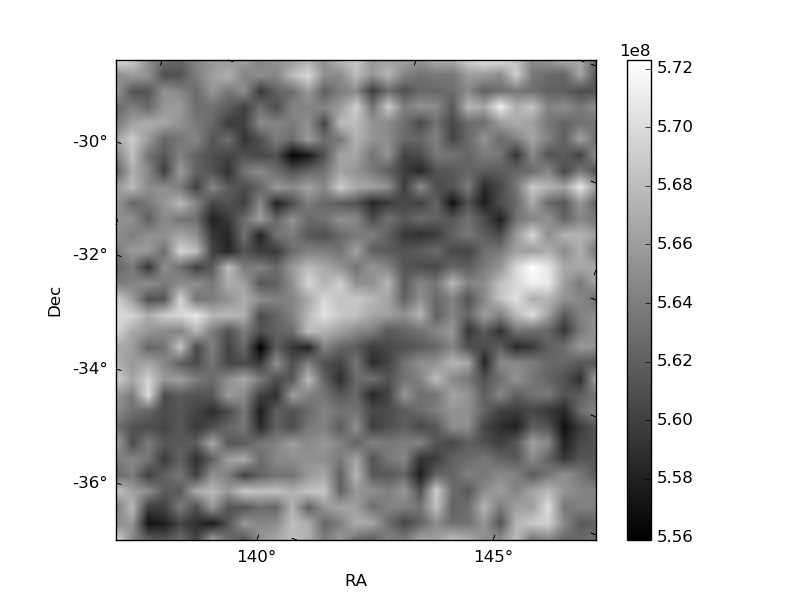
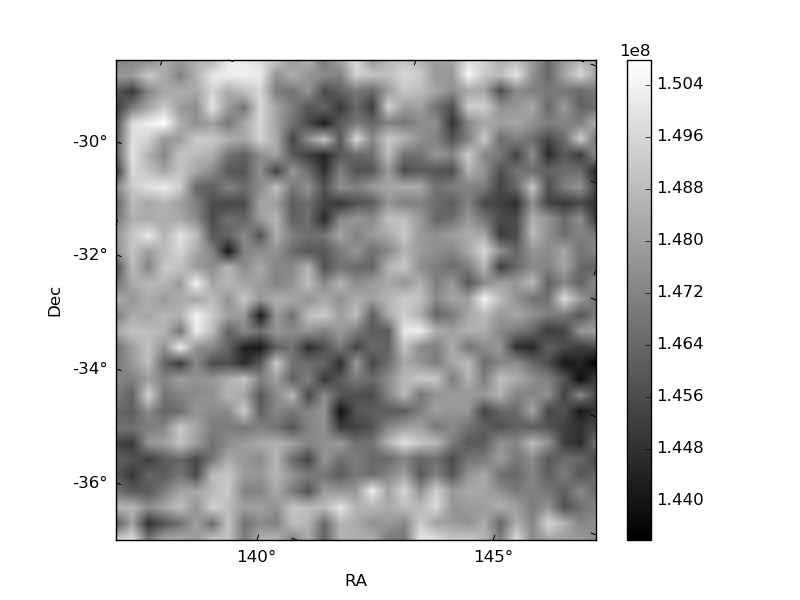
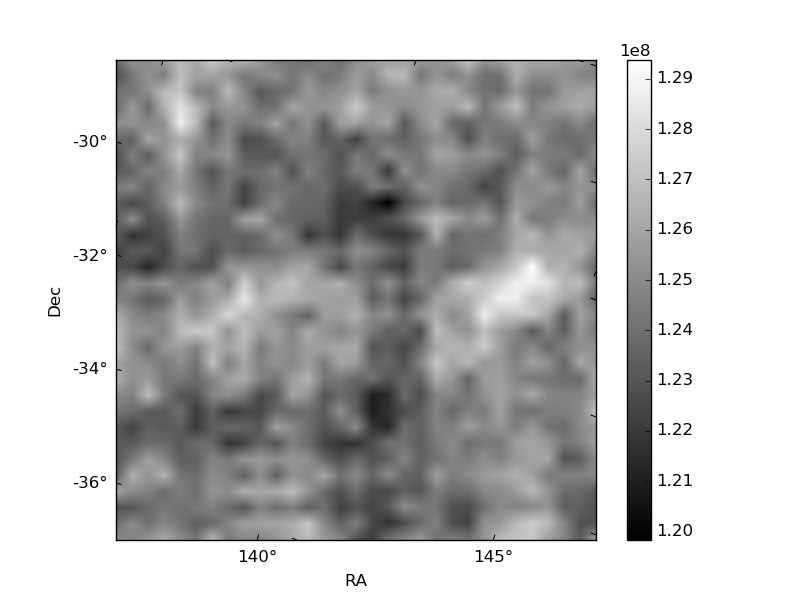
Histogram calculated using DETX and DETY for each event in the final _common_clean file
| Quadrant A | 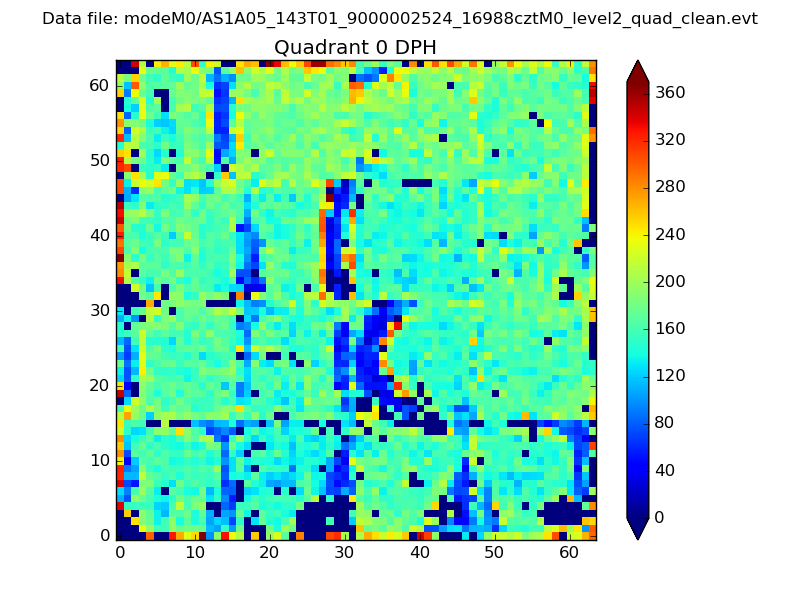 |
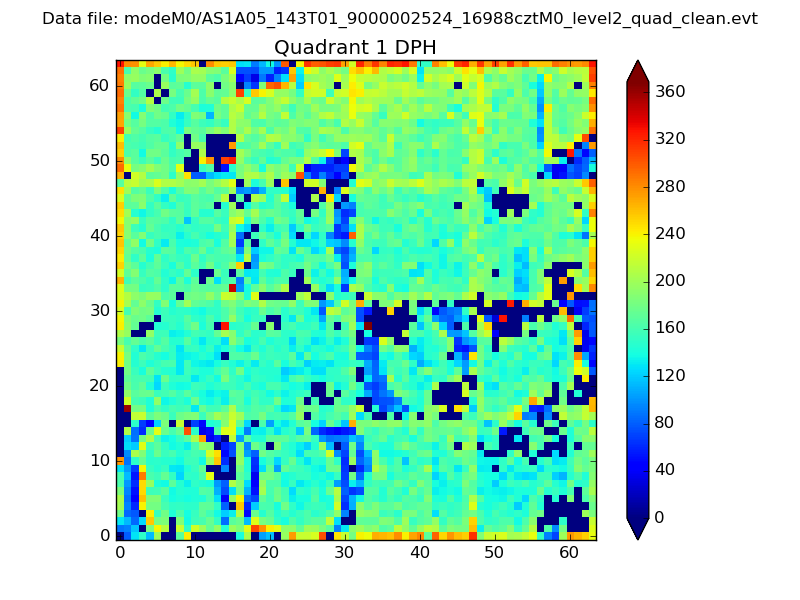 |
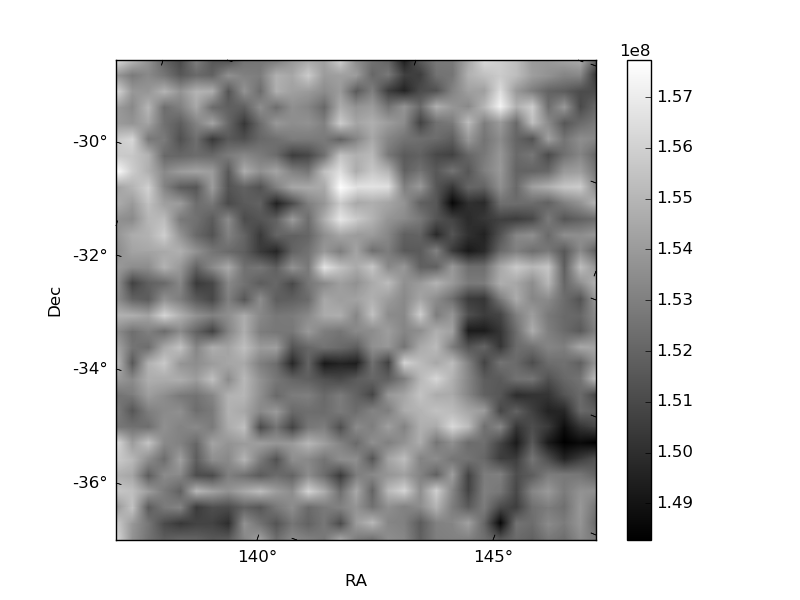
Quadrant B |
|---|---|---|---|
| Quadrant D | 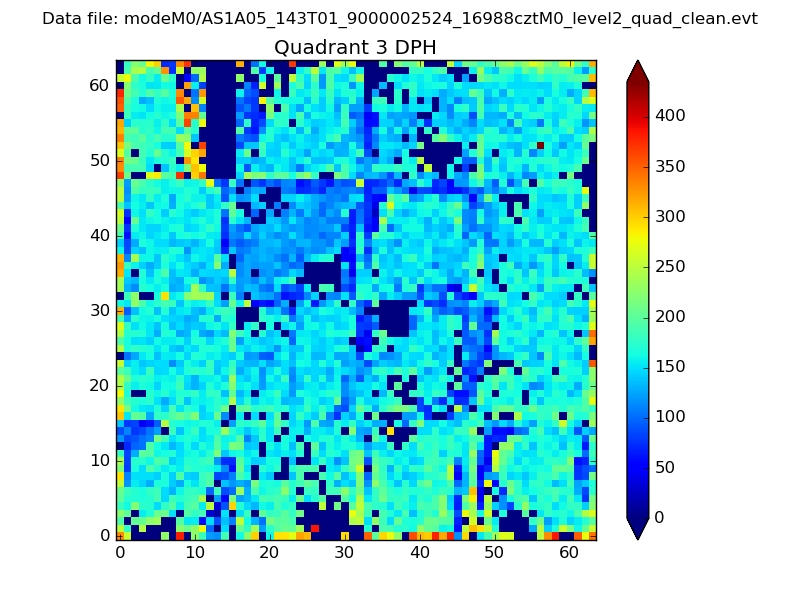 |
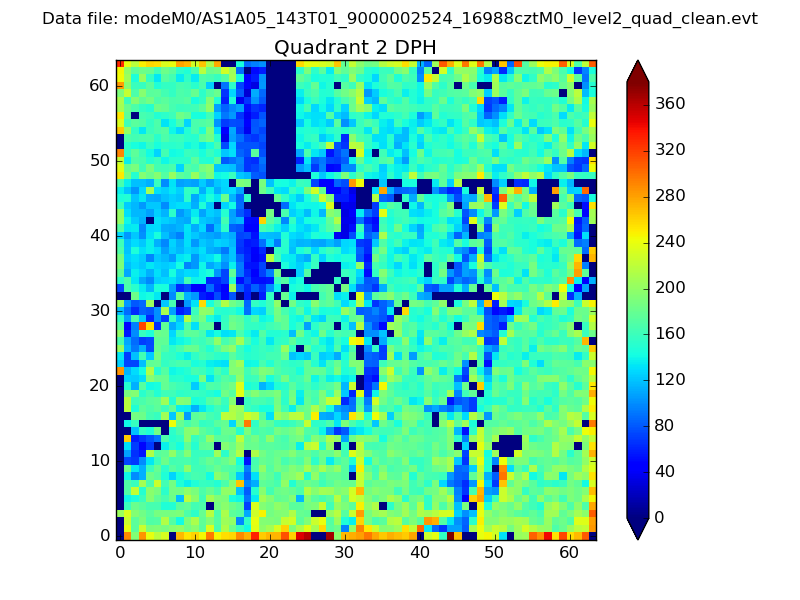 |
Quadrant C |
| Plot type | Count rate plots | Images |
|---|---|---|
| Comparison with Poisson distribution Blue bars denote a histogram of data divided into 1 sec bins. Red curve is a Poisson curve with rate = median count rate of data. |
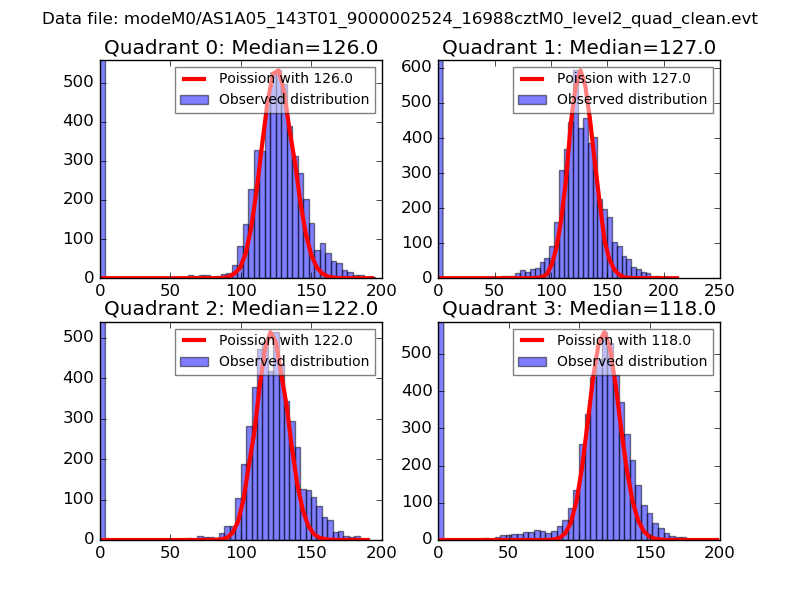 |
 |
| Quadrant-wise count rates Data is divided into 100 sec bins |
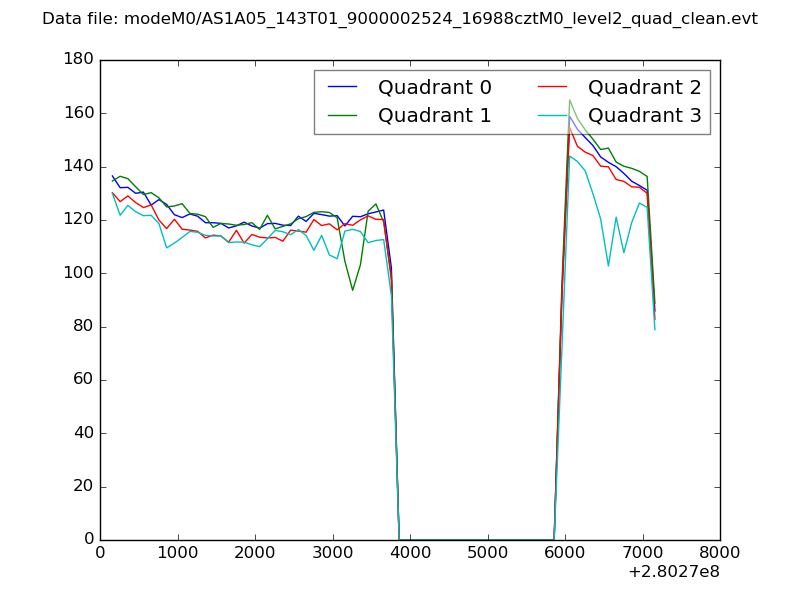 |
|
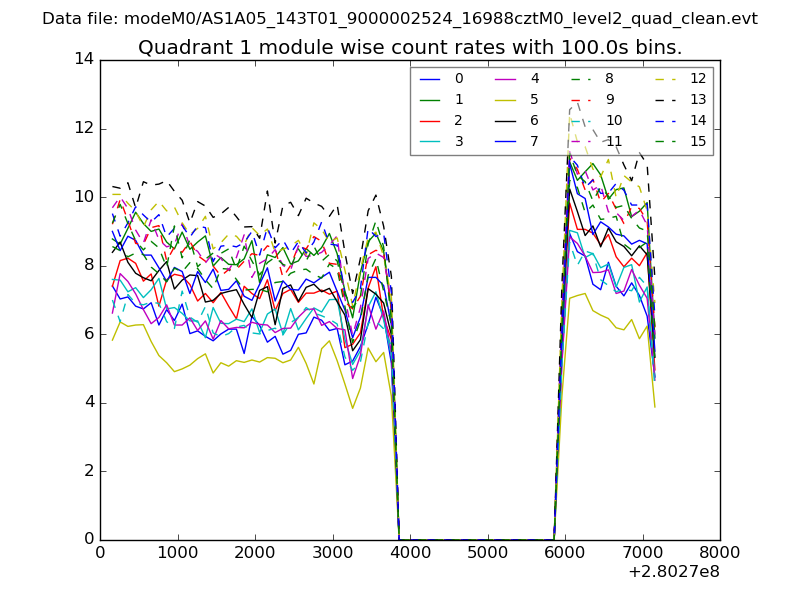
| Module-wise count rates for Quadrant A Data is divided into 100 sec bins |
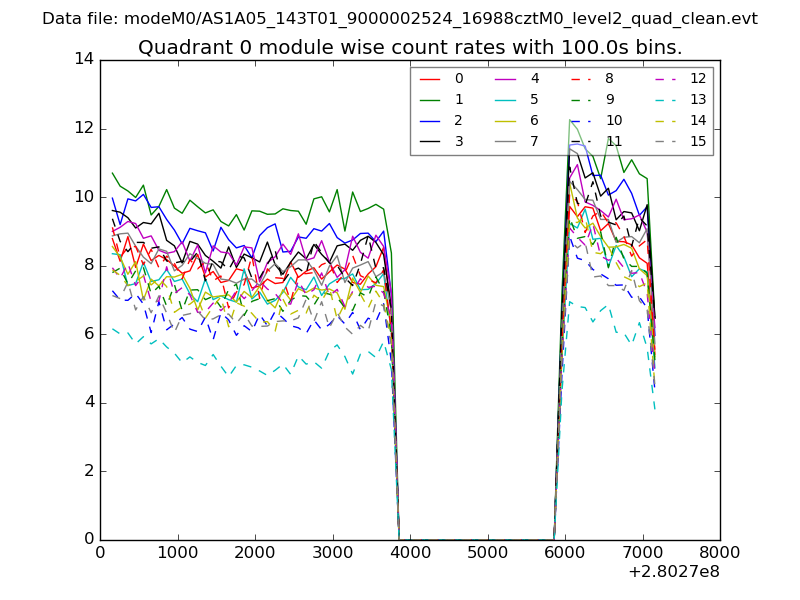 |
 |
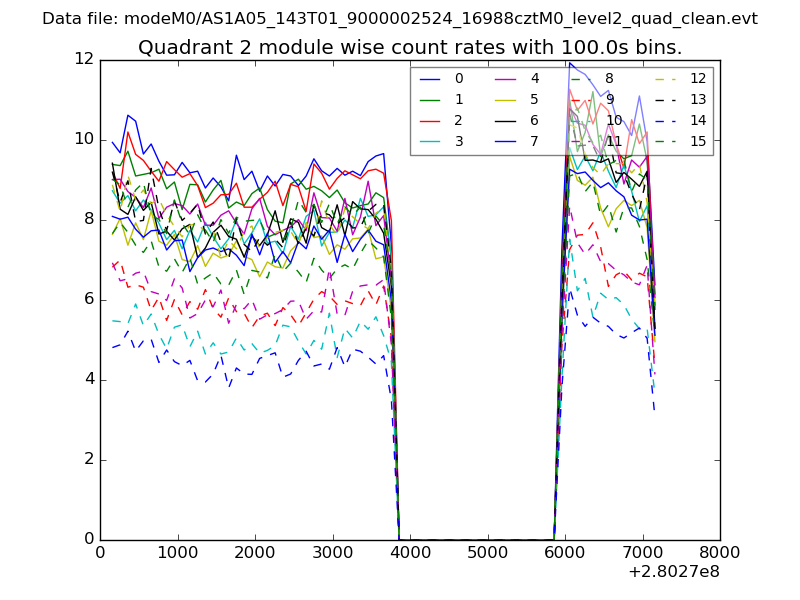
| Module-wise count rates for Quadrant B Data is divided into 100 sec bins |
 |
 |
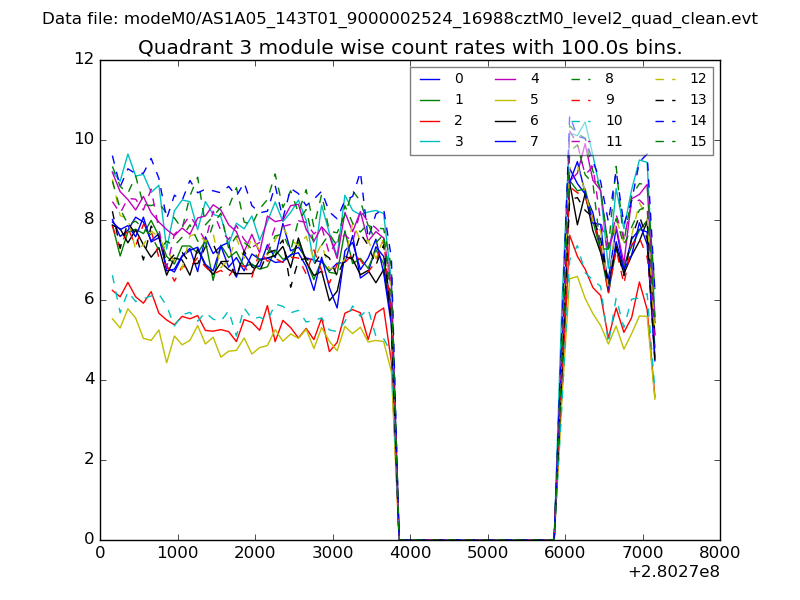
| Module-wise count rates for Quadrant C Data is divided into 100 sec bins |
 |
 |
| Module-wise count rates for Quadrant D Data is divided into 100 sec bins |
 |
 |
| Parameter | Plot |
|---|---|
| CZT HV Monitor | 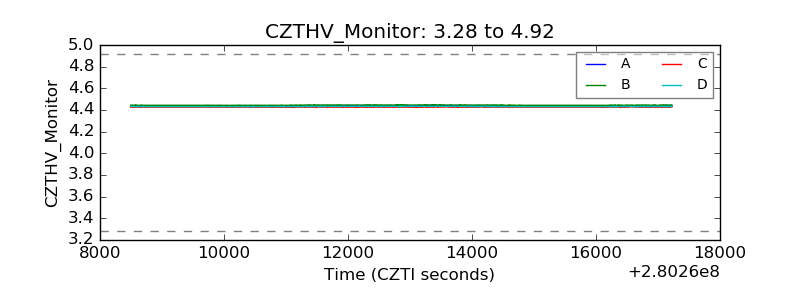 |
| D_VDD | 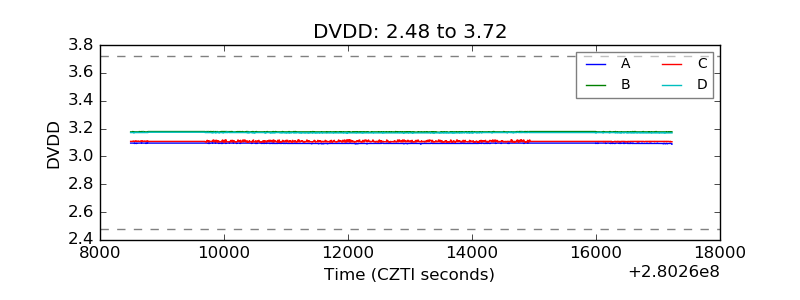 |
| Temperature 1 | 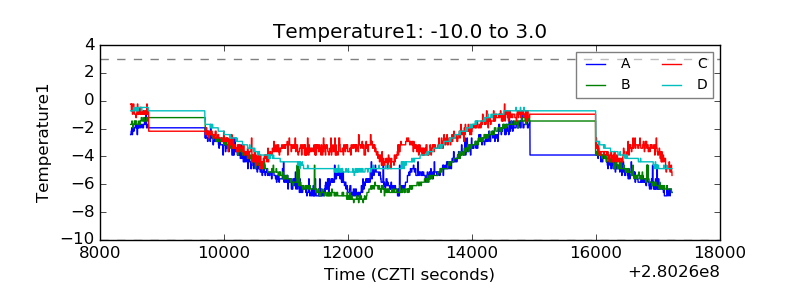 |
| Veto HV Monitor | 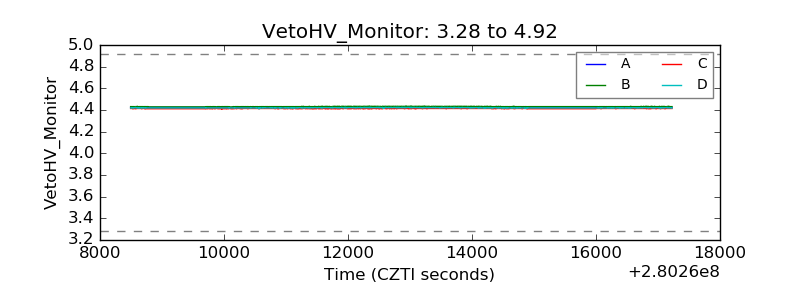 |
| Veto LLD | 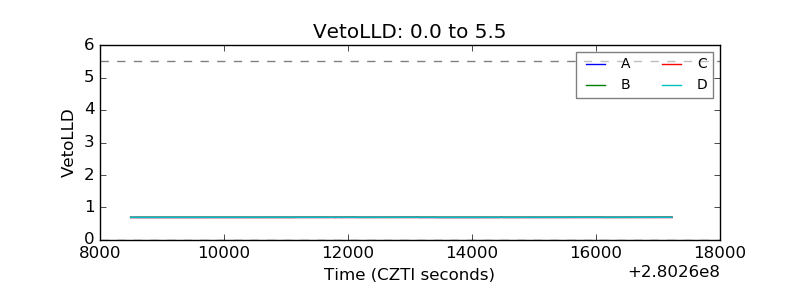 |
| Alpha Counter | 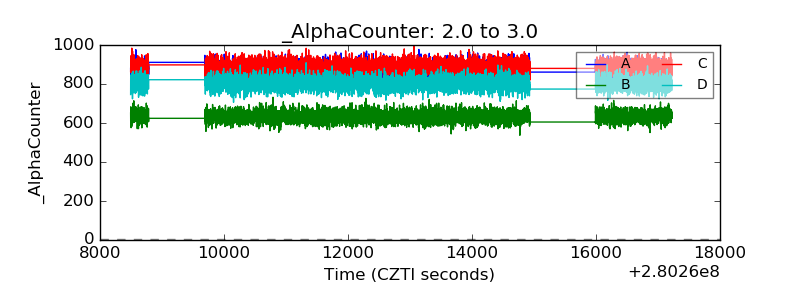 |
| _CPM_Rate | 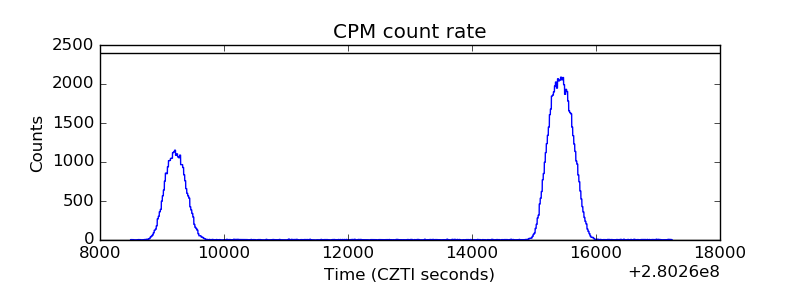 |
| CZT Counter | 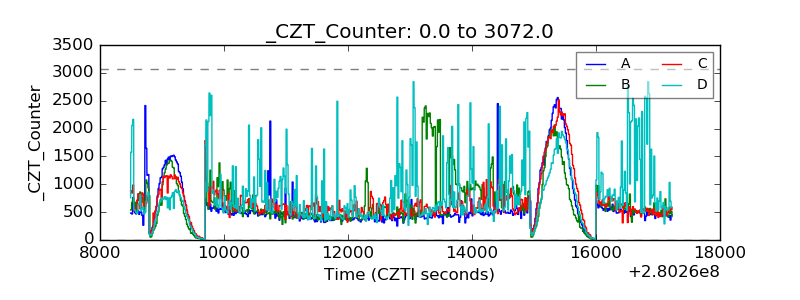 |
| +2.5 Volts monitor |  |
| +5 Volts monitor | 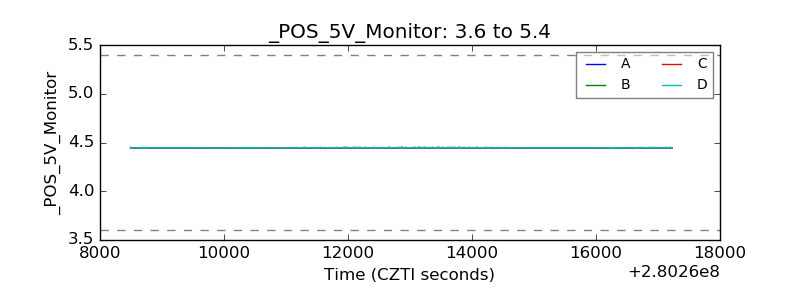 |
| _ROLL_ROT |  |
| _Roll_DEC |  |
| _Roll_RA | 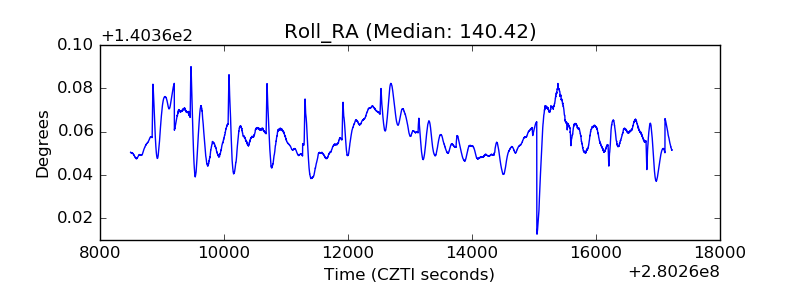 |
| Veto Counter | 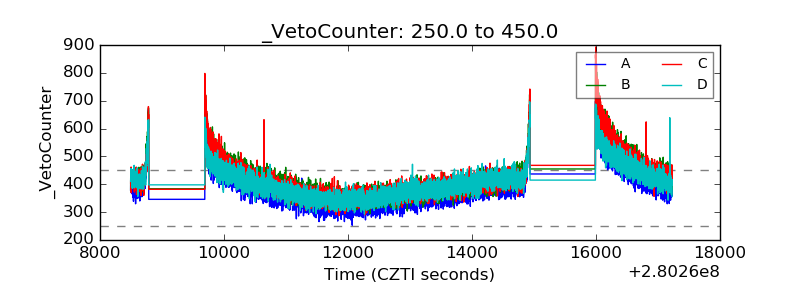 |