| Param | Original file | Final file |
|---|---|---|
| Filename | modeM0/AS1A05_143T01_9000002524_16990cztM0_level2.evt | modeM0/AS1A05_143T01_9000002524_16990cztM0_level2_quad_clean.evt |
| Size (bytes) | 540,146,880 | 100,362,240 |
| Size | 515.1 MB | 95.7 MB |
| Events in quadrant A | 3,308,008 | 652,753 |
| Events in quadrant B | 4,410,404 | 677,269 |
| Events in quadrant C | 3,364,334 | 654,229 |
| Events in quadrant D | 4,849,706 | 616,461 |
| Mode M9 | |||
|---|---|---|---|
| Quadrant | BADHDUFLAG | Total packets | Discarded packets |
| A | 0 | 19 | 0 |
| B | 0 | 20 | 0 |
| C | 0 | 20 | 0 |
| D | 0 | 20 | 0 |
| Mode SS | |||
|---|---|---|---|
| Quadrant | BADHDUFLAG | Total packets | Discarded packets |
| A | 0 | 126 | 0 |
| B | 0 | 126 | 0 |
| C | 0 | 126 | 0 |
| D | 0 | 126 | 0 |
| Mode M0 | |||
|---|---|---|---|
| Quadrant | BADHDUFLAG | Total packets | Discarded packets |
| A | 0 | 14041 | 2 |
| B | 0 | 17228 | 2 |
| C | 0 | 13955 | 2 |
| D | 0 | 18681 | 2 |
| Quadrant | Total seconds | Saturated seconds | Saturation percentage |
|---|---|---|---|
| A | 6292 | 155 | 2.463446% |
| B | 6292 | 202 | 3.210426% |
| C | 6292 | 79 | 1.255563% |
| D | 6292 | 346 | 5.499046% |
Noise dominated data is calculated using 1-second bins in cleaned event files. If a bin has >2000 counts, and if more than 50% of those come from <1% of pixels, then it is considered to be noise-dominated and hence unusable.
| Quadrant | # 1 sec bins | Bins with >0 counts | Bins with >2000 counts | High rate bins dominated by noise | Noise dominated (total time) | Noise dominated (detector-on time) | Marked lightcurve |
|---|---|---|---|---|---|---|---|
| A | 7458 | 6294 | 105 | 105 | 1.41% | 1.67% | 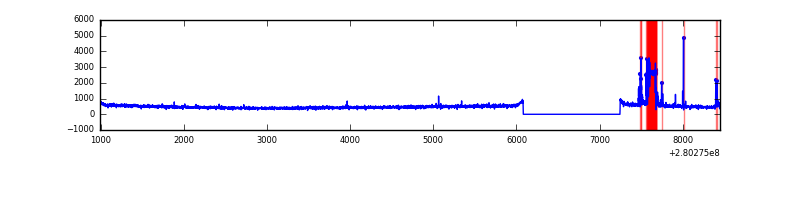 |
| B | 7458 | 6294 | 148 | 148 | 1.98% | 2.35% | 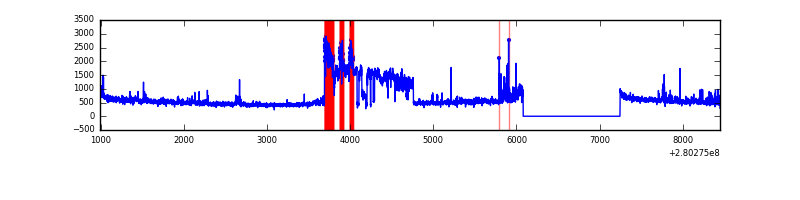 |
| C | 7458 | 6294 | 0 | 0 | 0.00% | 0.00% |  |
| D | 7458 | 6294 | 257 | 257 | 3.45% | 4.08% | 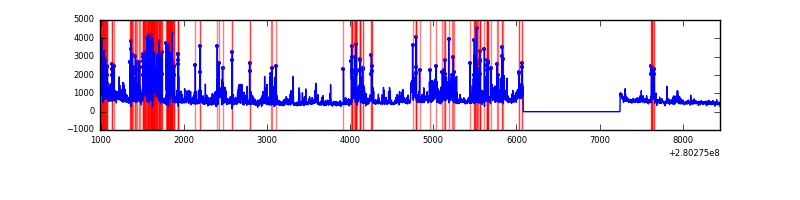 |
Top three noisy pixels from each quadrant. If the there are fewer than three noisy pixels in the level2.evt file, extra rows are filled as -1
| Pixel properties | Quadrant properties | ||||||
|---|---|---|---|---|---|---|---|
| Quadrant | DetID | PixID | Counts | Sigma | Mean | Median | Sigma |
| A | 15 | 174 | 353959 | 2284.82 | 767 | 750 | 154.6 |
| A | 0 | 226 | 6677 | 38.34 | 767 | 750 | 154.6 |
| A | 12 | 189 | 6650 | 38.17 | 767 | 750 | 154.6 |
| B | 3 | 64 | 1150522 | 7722.46 | 785 | 767 | 148.9 |
| B | 0 | 229 | 70448 | 468.02 | 785 | 767 | 148.9 |
| B | 7 | 220 | 33483 | 219.74 | 785 | 767 | 148.9 |
| C | 3 | 233 | 282896 | 1584.92 | 760 | 768 | 178.0 |
| C | 14 | 238 | 118465 | 661.19 | 760 | 768 | 178.0 |
| C | 13 | 61 | 5275 | 25.32 | 760 | 768 | 178.0 |
| D | 1 | 52 | 1960847 | 10778.55 | 743 | 723 | 181.9 |
| D | 8 | 195 | 25681 | 137.24 | 743 | 723 | 181.9 |
| D | 15 | 145 | 22754 | 121.15 | 743 | 723 | 181.9 |
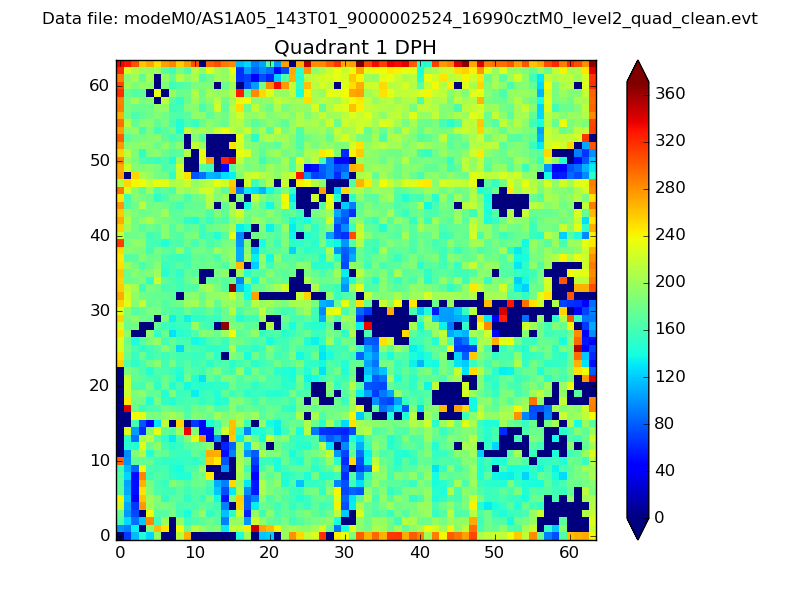
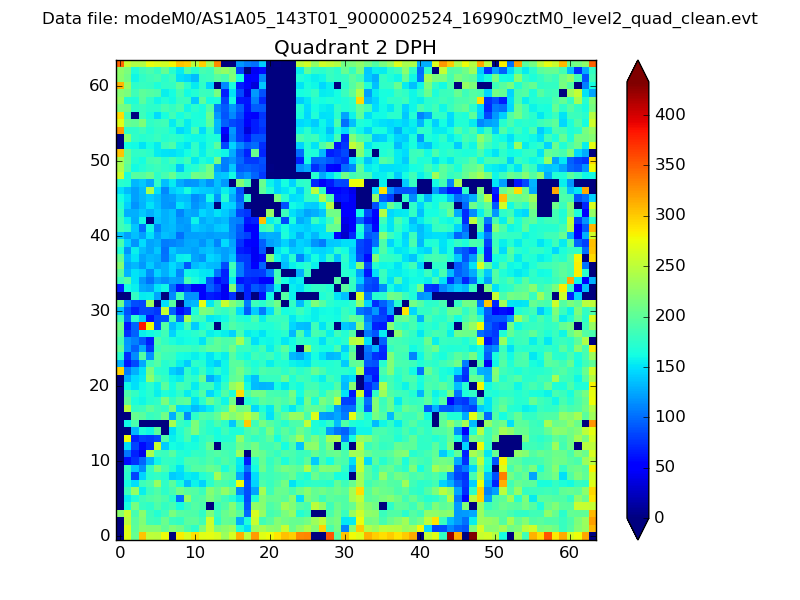
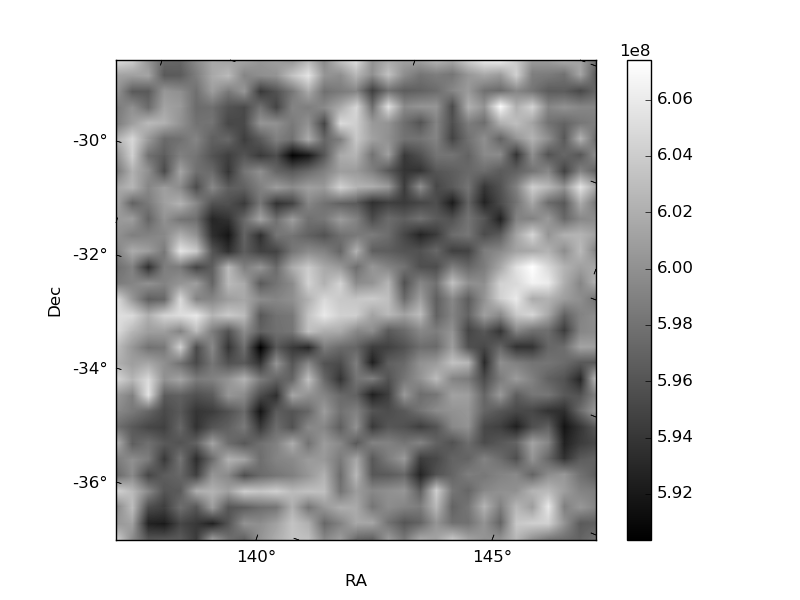
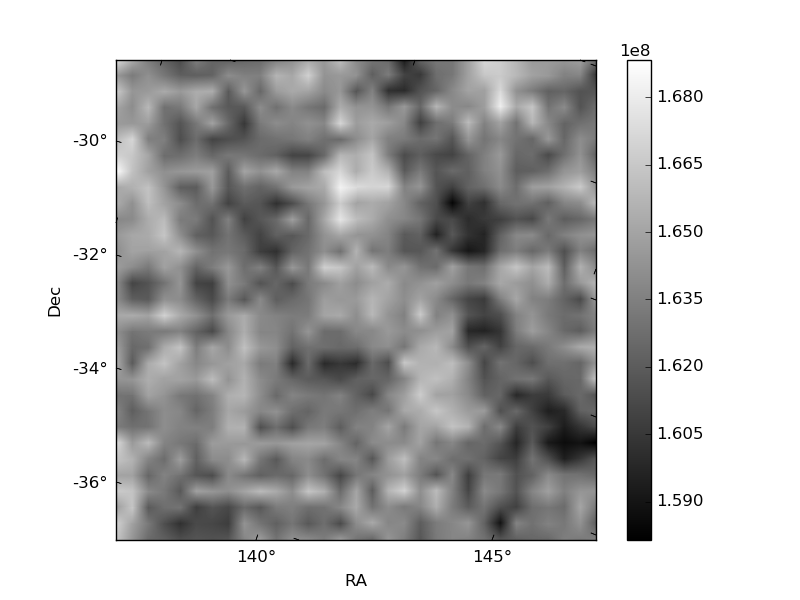
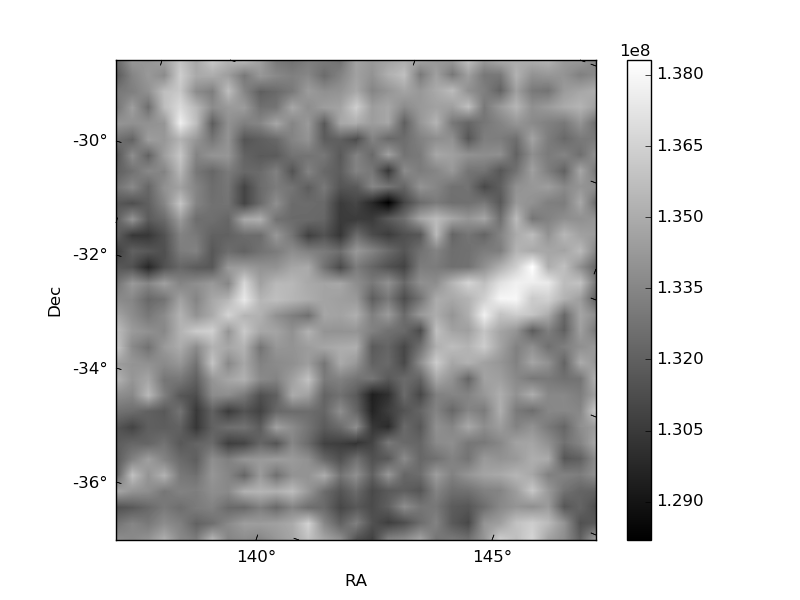
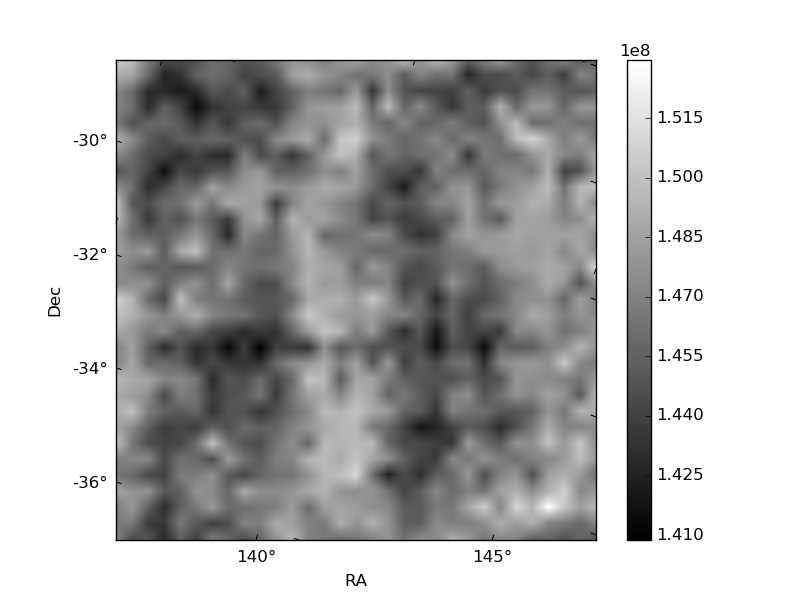
Histogram calculated using DETX and DETY for each event in the final _common_clean file
| Quadrant A | 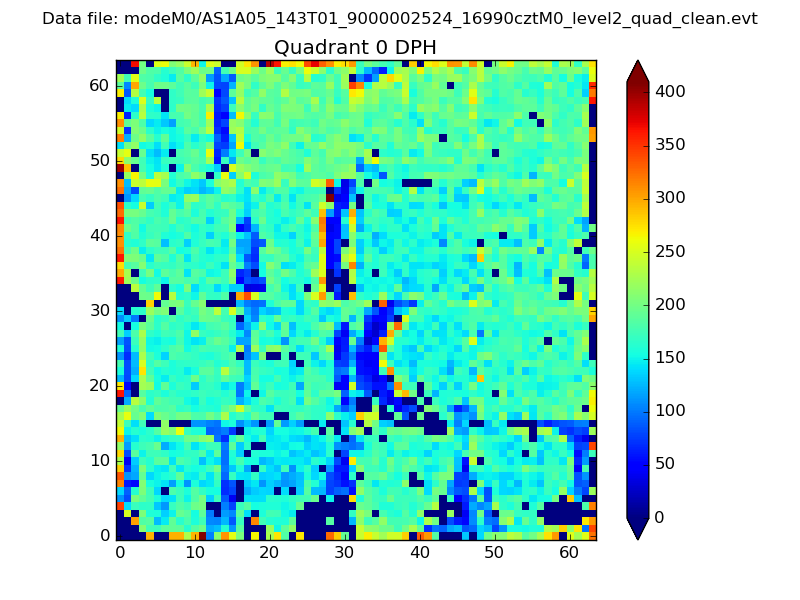 |
 |
Quadrant B |
|---|---|---|---|
| Quadrant D | 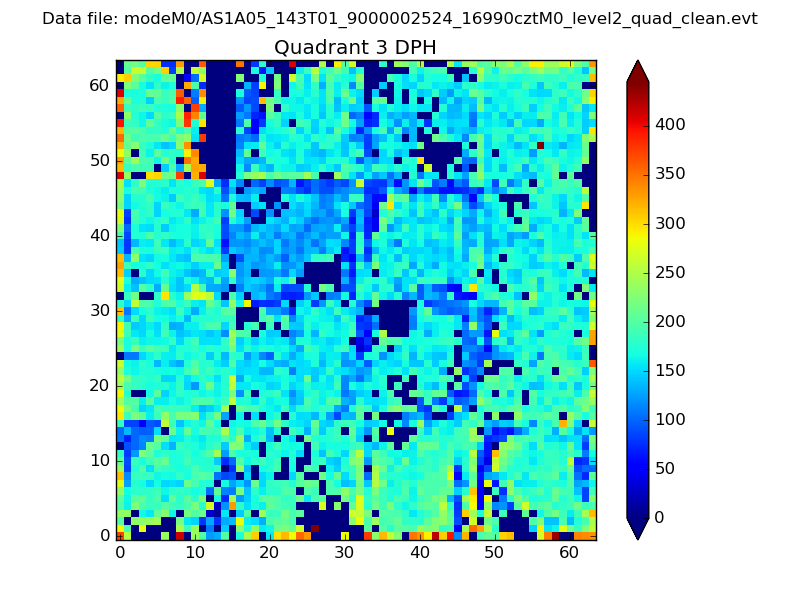 |
 |
Quadrant C |
| Plot type | Count rate plots | Images |
|---|---|---|
| Comparison with Poisson distribution Blue bars denote a histogram of data divided into 1 sec bins. Red curve is a Poisson curve with rate = median count rate of data. |
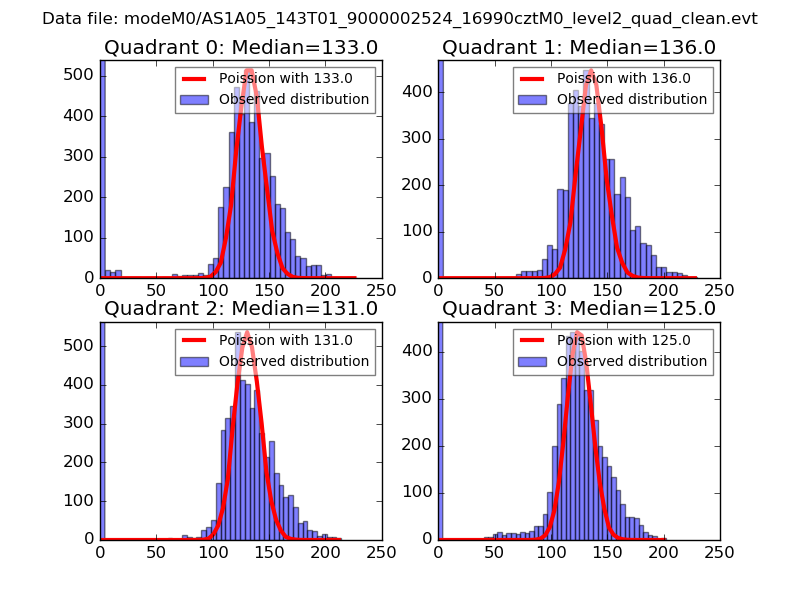 |
 |
| Quadrant-wise count rates Data is divided into 100 sec bins |
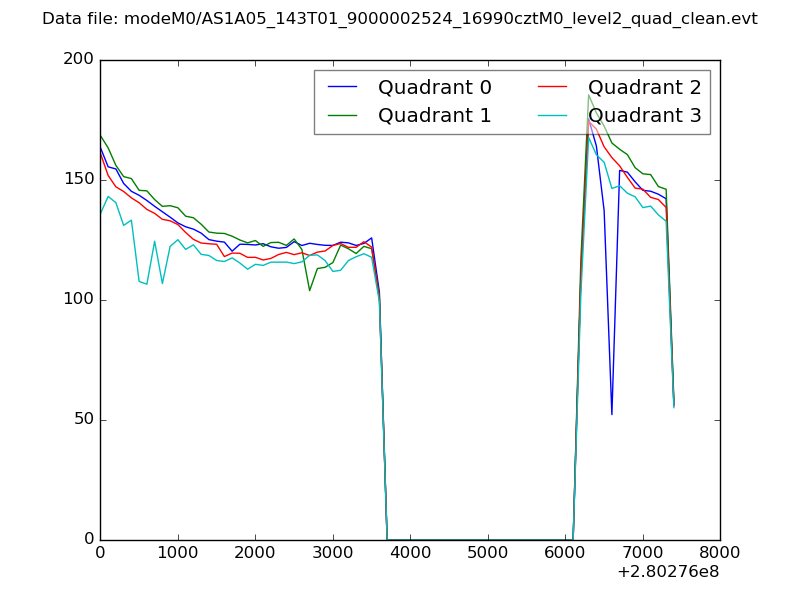 |
|
| Module-wise count rates for Quadrant A Data is divided into 100 sec bins |
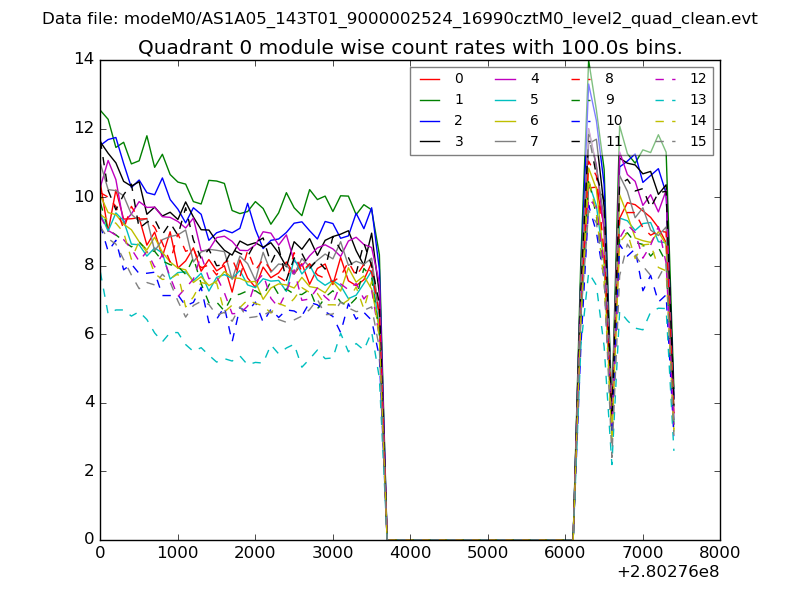 |
 |
| Module-wise count rates for Quadrant B Data is divided into 100 sec bins |
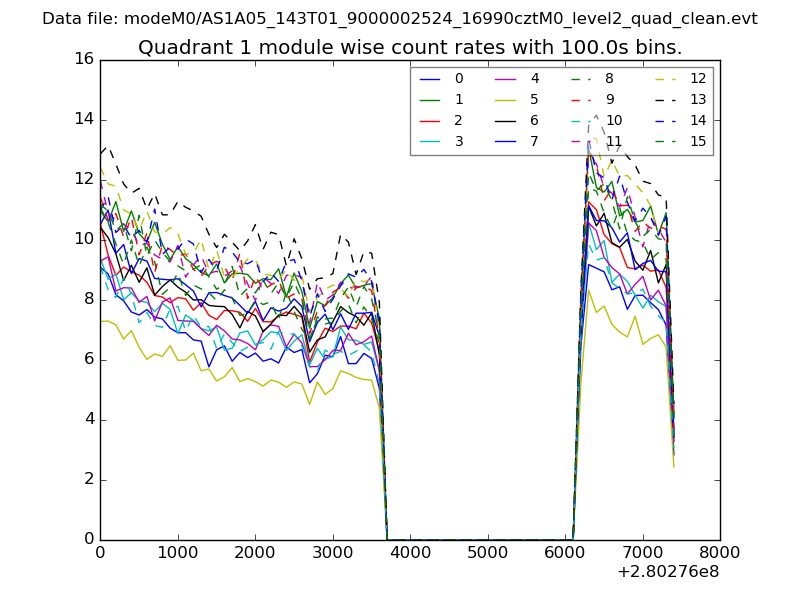 |
 |
| Module-wise count rates for Quadrant C Data is divided into 100 sec bins |
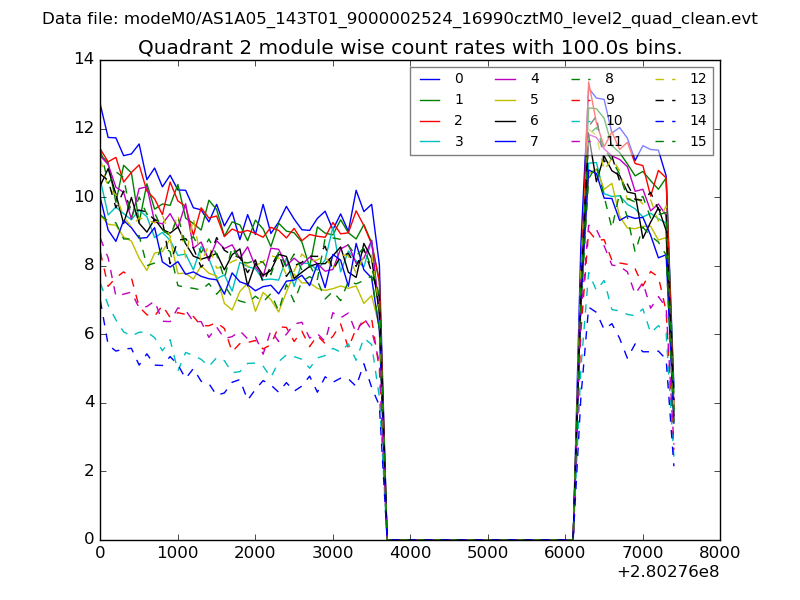 |
 |
| Module-wise count rates for Quadrant D Data is divided into 100 sec bins |
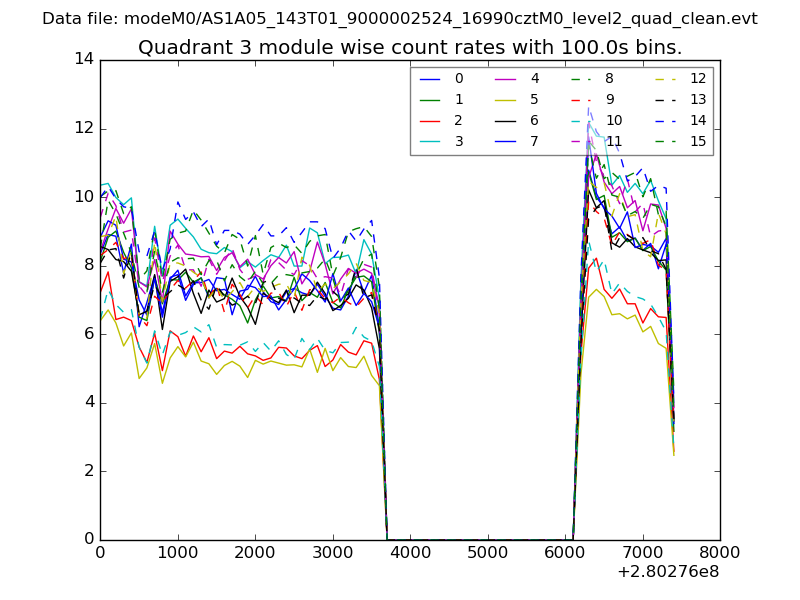 |
 |
| Parameter | Plot |
|---|---|
| CZT HV Monitor | 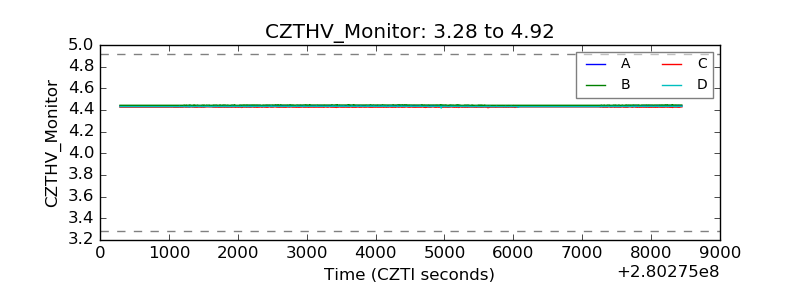 |
| D_VDD | 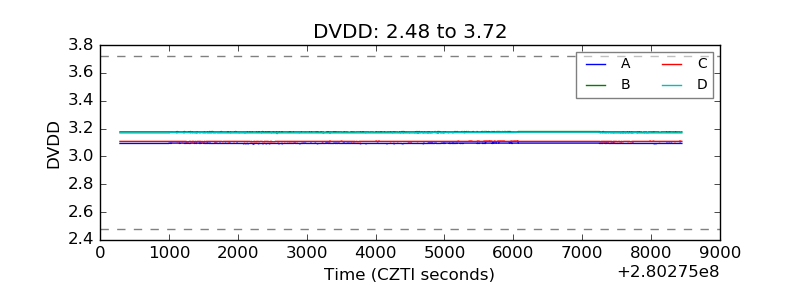 |
| Temperature 1 | 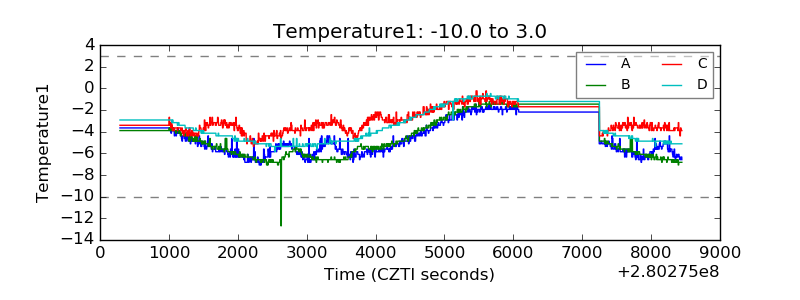 |
| Veto HV Monitor | 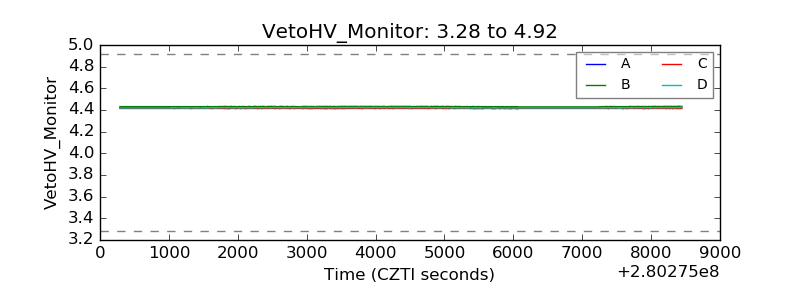 |
| Veto LLD | 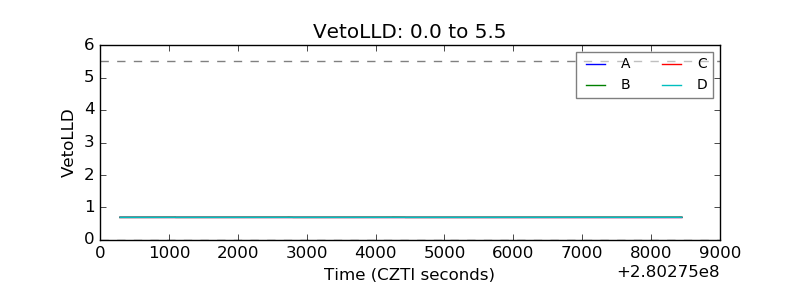 |
| Alpha Counter | 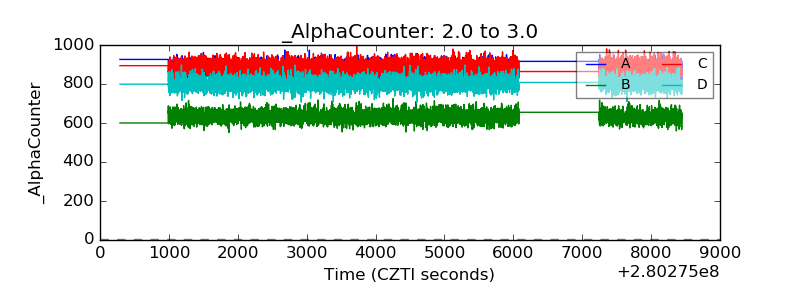 |
| _CPM_Rate | 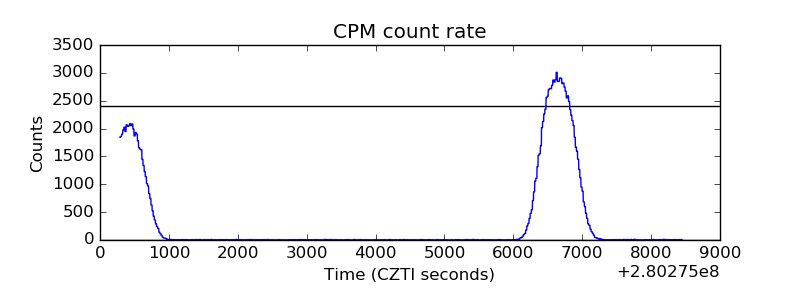 |
| CZT Counter | 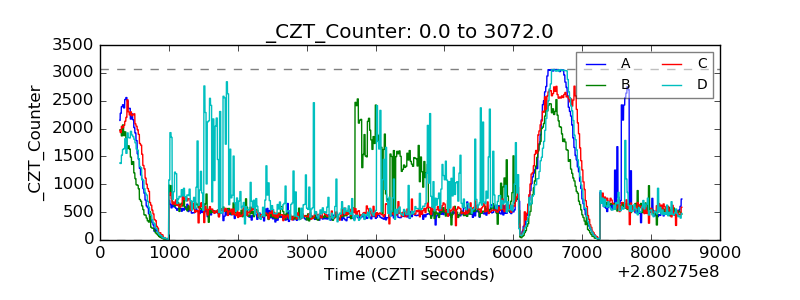 |
| +2.5 Volts monitor |  |
| +5 Volts monitor | 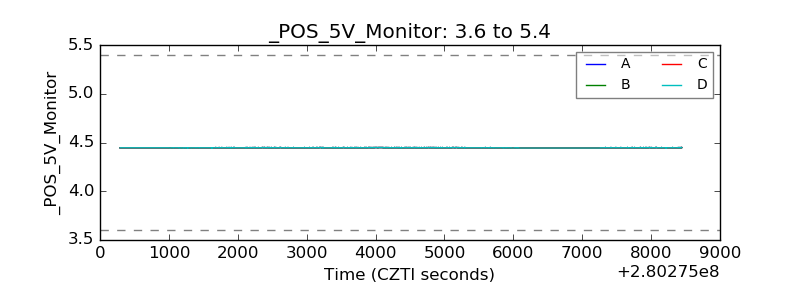 |
| _ROLL_ROT | 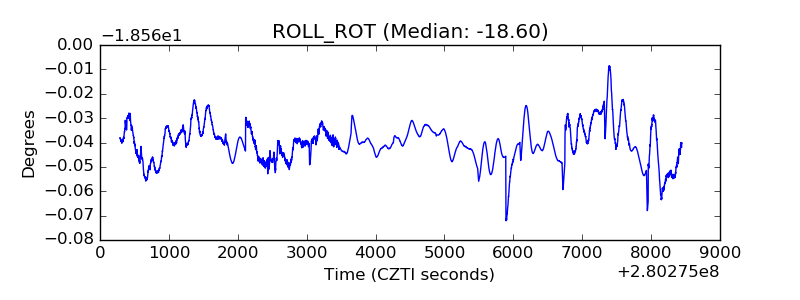 |
| _Roll_DEC | 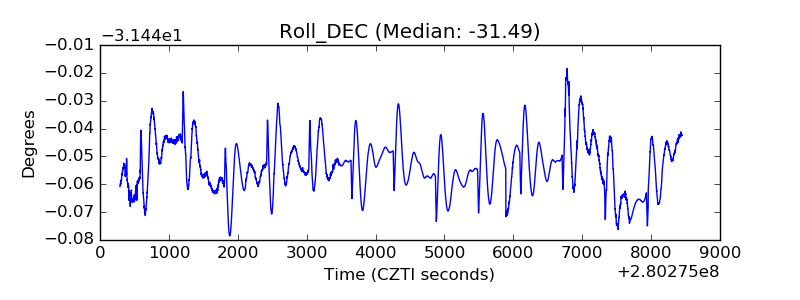 |
| _Roll_RA | 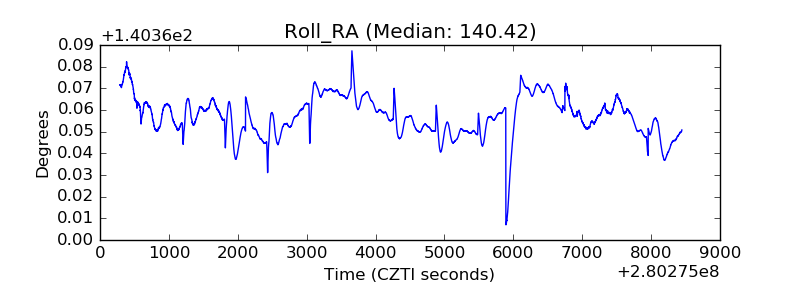 |
| Veto Counter | 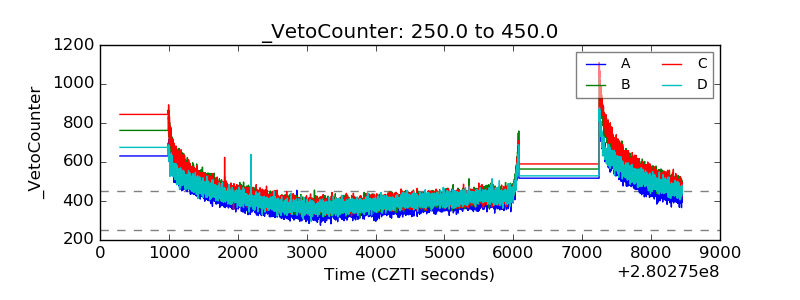 |