| Param | Original file | Final file |
|---|---|---|
| Filename | modeM0/AS1A05_143T01_9000002524_16991cztM0_level2.evt | modeM0/AS1A05_143T01_9000002524_16991cztM0_level2_quad_clean.evt |
| Size (bytes) | 556,637,760 | 108,979,200 |
| Size | 530.9 MB | 103.9 MB |
| Events in quadrant A | 4,328,762 | 703,405 |
| Events in quadrant B | 3,601,019 | 742,696 |
| Events in quadrant C | 3,935,995 | 712,946 |
| Events in quadrant D | 4,543,858 | 680,312 |
| Mode M9 | |||
|---|---|---|---|
| Quadrant | BADHDUFLAG | Total packets | Discarded packets |
| A | 0 | 18 | 0 |
| B | 0 | 19 | 0 |
| C | 0 | 19 | 0 |
| D | 0 | 19 | 0 |
| Mode SS | |||
|---|---|---|---|
| Quadrant | BADHDUFLAG | Total packets | Discarded packets |
| A | 0 | 134 | 0 |
| B | 0 | 134 | 0 |
| C | 0 | 134 | 0 |
| D | 0 | 134 | 0 |
| Mode M0 | |||
|---|---|---|---|
| Quadrant | BADHDUFLAG | Total packets | Discarded packets |
| A | 0 | 17227 | 2 |
| B | 0 | 14924 | 2 |
| C | 0 | 16183 | 2 |
| D | 0 | 18006 | 2 |
| Quadrant | Total seconds | Saturated seconds | Saturation percentage |
|---|---|---|---|
| A | 6614 | 485 | 7.332930% |
| B | 6614 | 41 | 0.619897% |
| C | 6614 | 74 | 1.118839% |
| D | 6614 | 245 | 3.704264% |
Noise dominated data is calculated using 1-second bins in cleaned event files. If a bin has >2000 counts, and if more than 50% of those come from <1% of pixels, then it is considered to be noise-dominated and hence unusable.
| Quadrant | # 1 sec bins | Bins with >0 counts | Bins with >2000 counts | High rate bins dominated by noise | Noise dominated (total time) | Noise dominated (detector-on time) | Marked lightcurve |
|---|---|---|---|---|---|---|---|
| A | 7890 | 6616 | 403 | 403 | 5.11% | 6.09% | 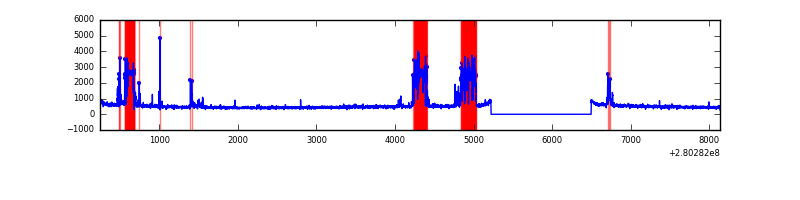 |
| B | 7890 | 6616 | 3 | 3 | 0.04% | 0.05% | 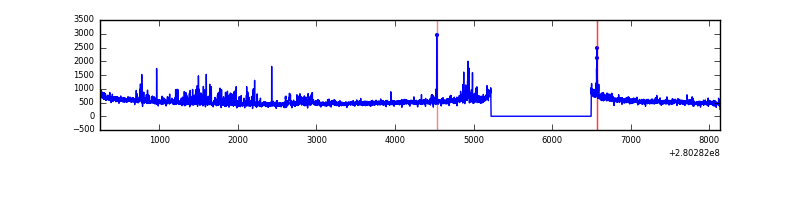 |
| C | 7890 | 6616 | 0 | 0 | 0.00% | 0.00% | 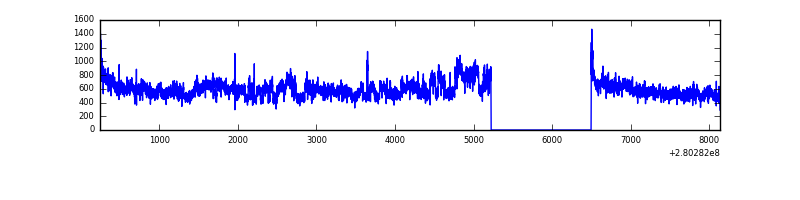 |
| D | 7890 | 6616 | 152 | 152 | 1.93% | 2.30% | 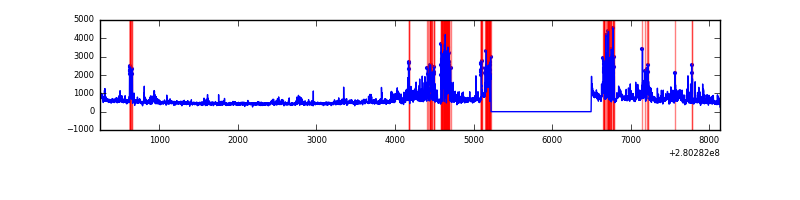 |
Top three noisy pixels from each quadrant. If the there are fewer than three noisy pixels in the level2.evt file, extra rows are filled as -1
| Pixel properties | Quadrant properties | ||||||
|---|---|---|---|---|---|---|---|
| Quadrant | DetID | PixID | Counts | Sigma | Mean | Median | Sigma |
| A | 15 | 174 | 1249287 | 7831.65 | 800 | 785 | 159.4 |
| A | 0 | 226 | 7190 | 40.18 | 800 | 785 | 159.4 |
| A | 12 | 194 | 5897 | 32.07 | 800 | 785 | 159.4 |
| B | 3 | 64 | 116084 | 729.05 | 850 | 830 | 158.1 |
| B | 0 | 229 | 70559 | 441.08 | 850 | 830 | 158.1 |
| B | 0 | 197 | 21111 | 128.29 | 850 | 830 | 158.1 |
| C | 3 | 233 | 589509 | 3076.9 | 826 | 834 | 191.3 |
| C | 14 | 238 | 128222 | 665.84 | 826 | 834 | 191.3 |
| C | 13 | 61 | 5803 | 25.97 | 826 | 834 | 191.3 |
| D | 1 | 52 | 1397074 | 7106.84 | 810 | 786 | 196.5 |
| D | 7 | 223 | 39472 | 196.9 | 810 | 786 | 196.5 |
| D | 2 | 152 | 26321 | 129.97 | 810 | 786 | 196.5 |
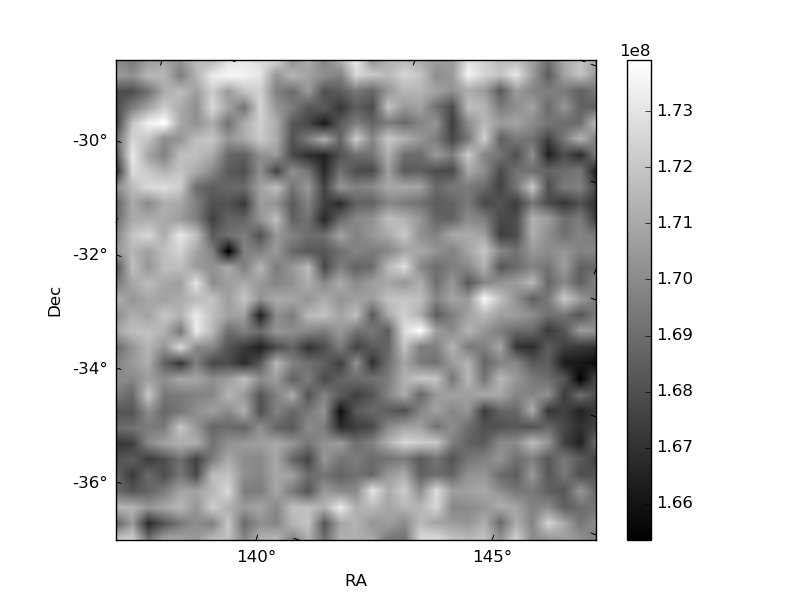
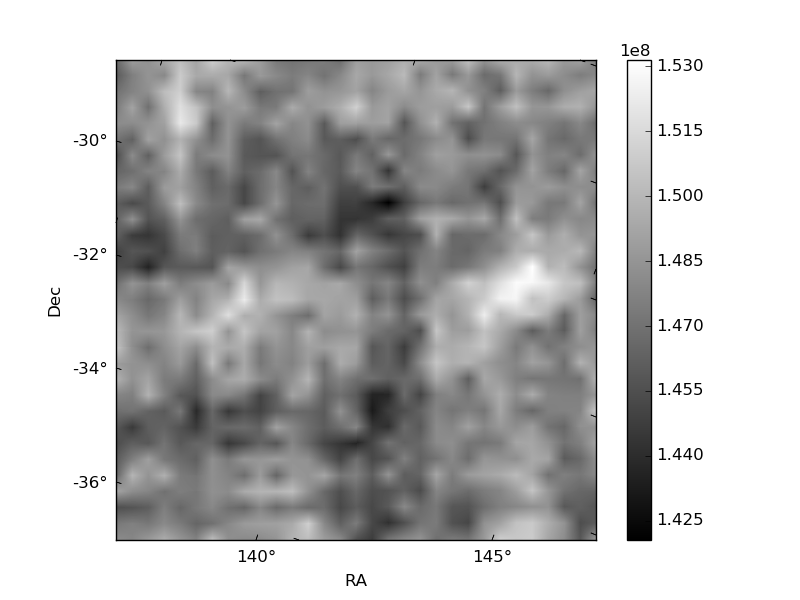
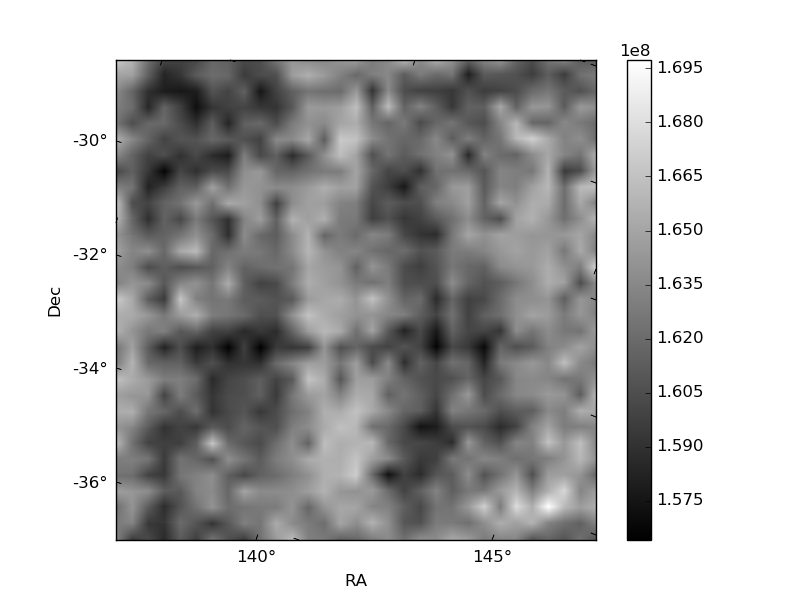
Histogram calculated using DETX and DETY for each event in the final _common_clean file
| Quadrant A |  |
 |
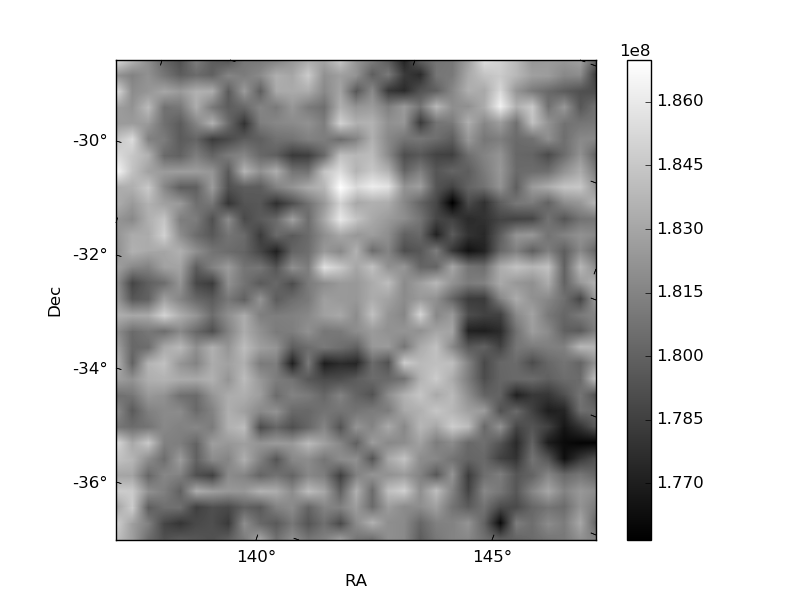
Quadrant B |
|---|---|---|---|
| Quadrant D | 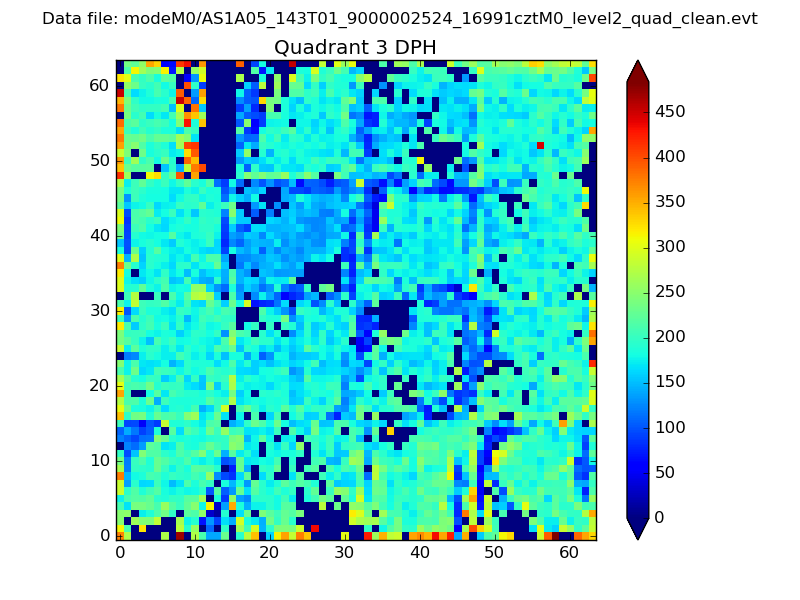 |
 |
Quadrant C |
| Plot type | Count rate plots | Images |
|---|---|---|
| Comparison with Poisson distribution Blue bars denote a histogram of data divided into 1 sec bins. Red curve is a Poisson curve with rate = median count rate of data. |
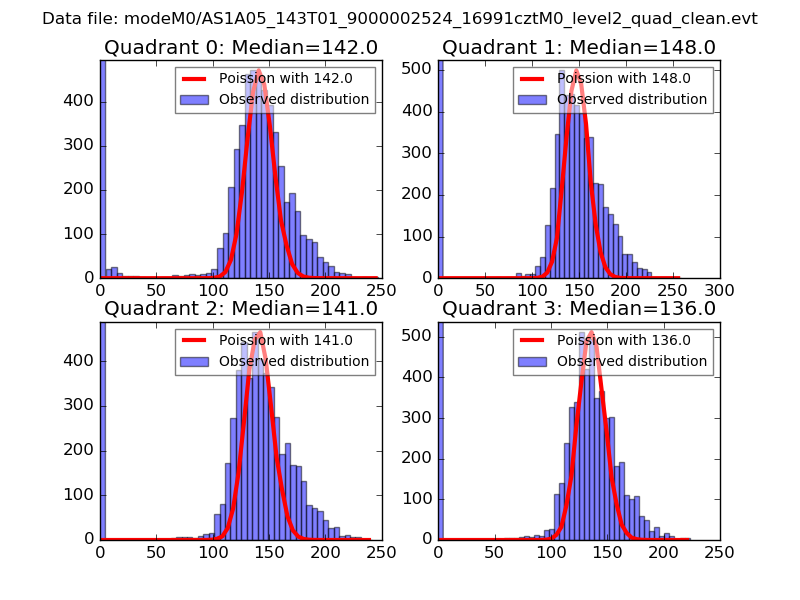 |
 |
| Quadrant-wise count rates Data is divided into 100 sec bins |
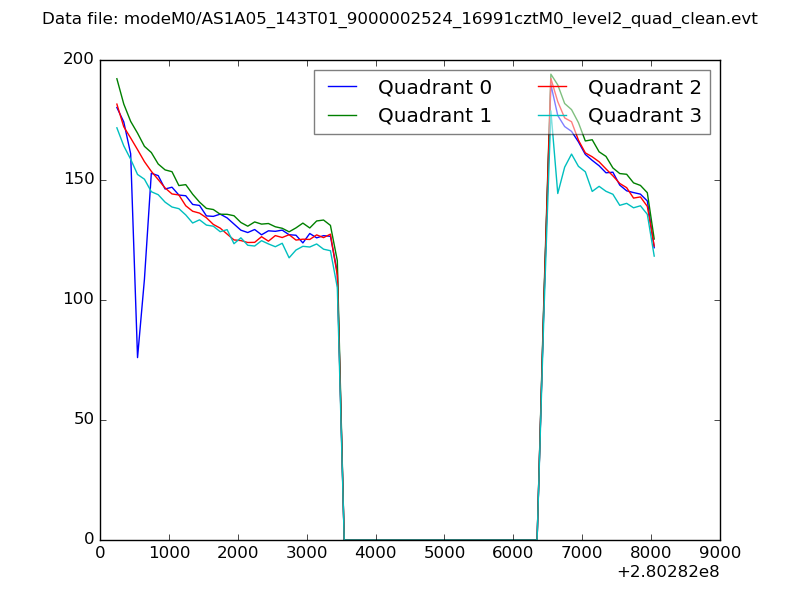 |
|
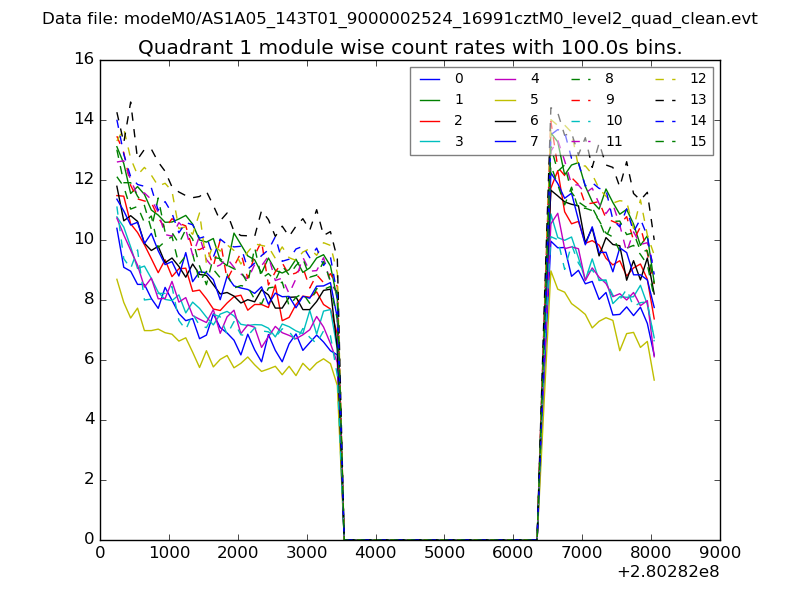
| Module-wise count rates for Quadrant A Data is divided into 100 sec bins |
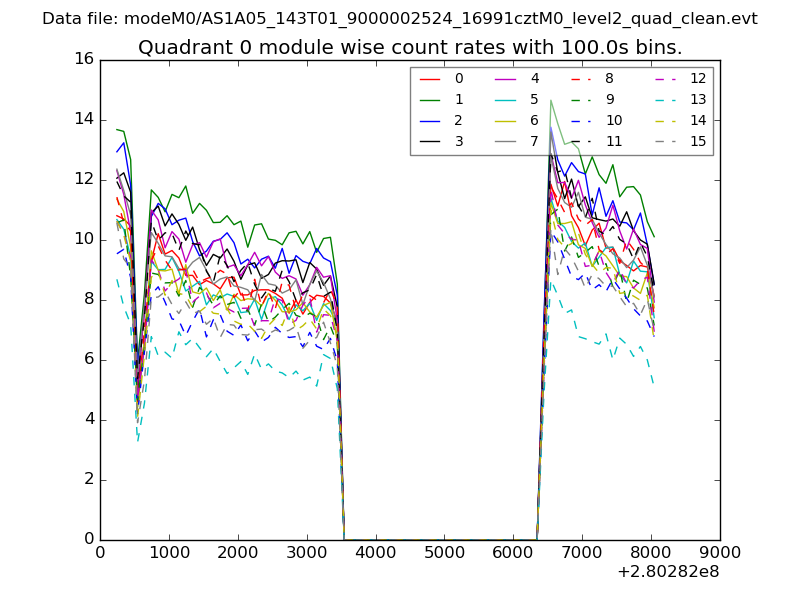 |
 |
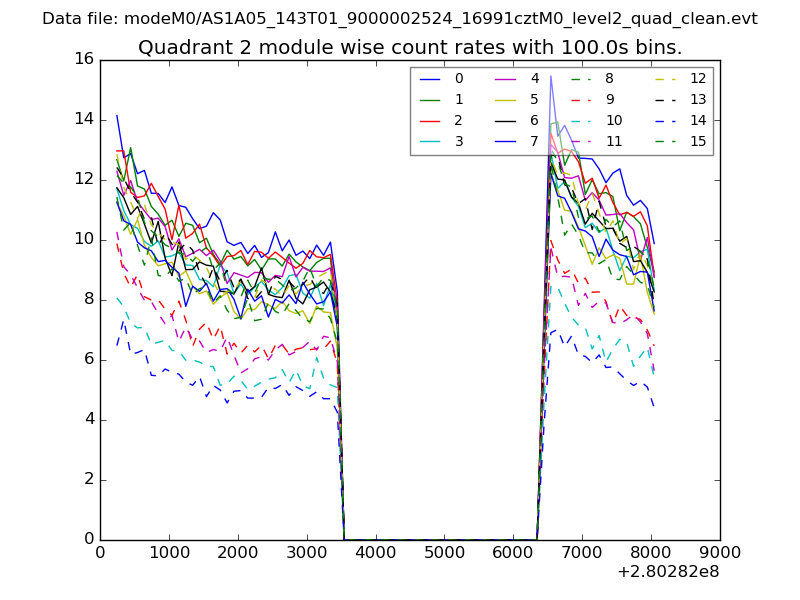
| Module-wise count rates for Quadrant B Data is divided into 100 sec bins |
 |
 |
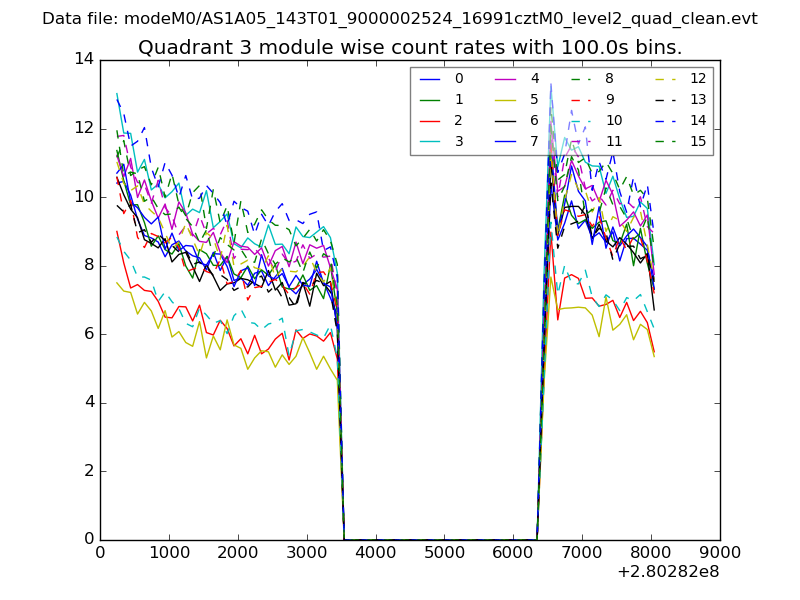
| Module-wise count rates for Quadrant C Data is divided into 100 sec bins |
 |
 |
| Module-wise count rates for Quadrant D Data is divided into 100 sec bins |
 |
 |
| Parameter | Plot |
|---|---|
| CZT HV Monitor | 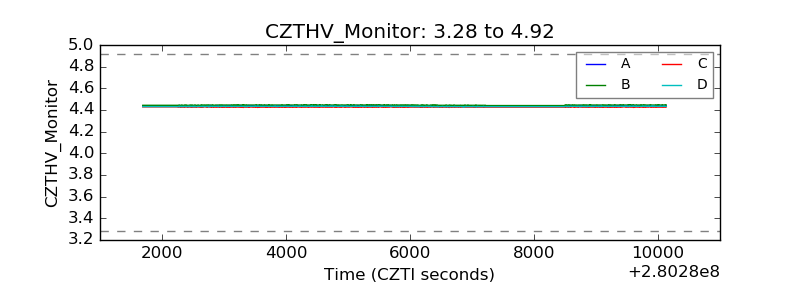 |
| D_VDD | 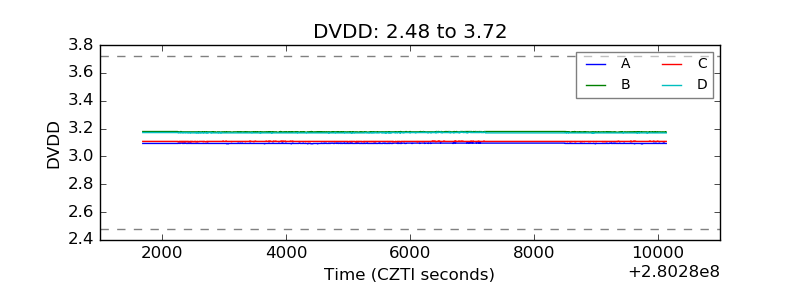 |
| Temperature 1 | 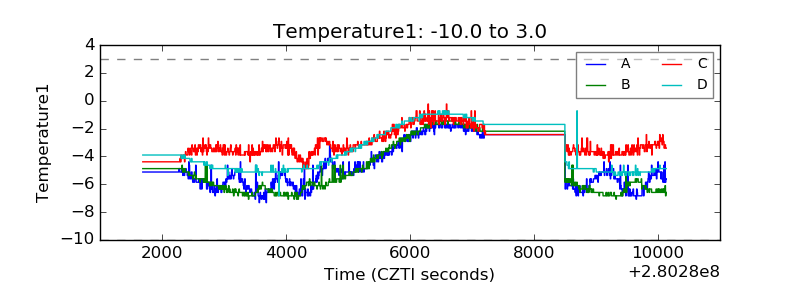 |
| Veto HV Monitor | 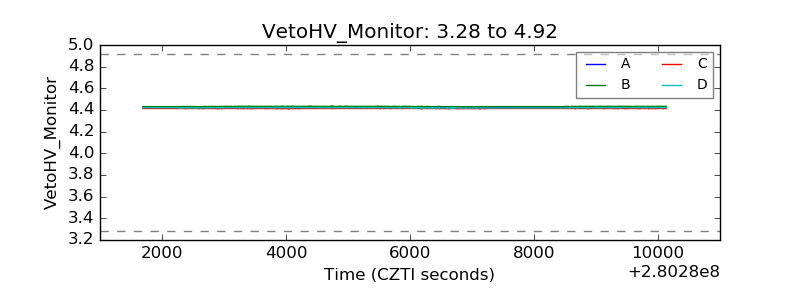 |
| Veto LLD | 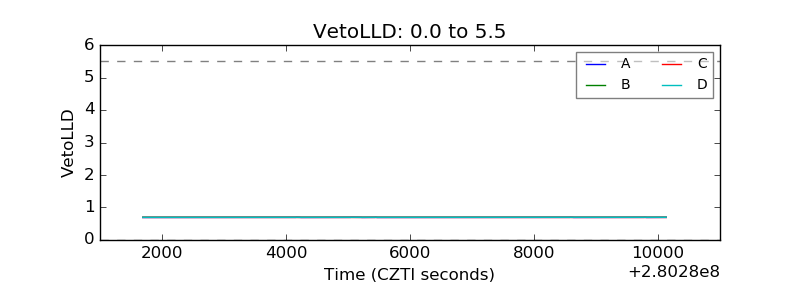 |
| Alpha Counter | 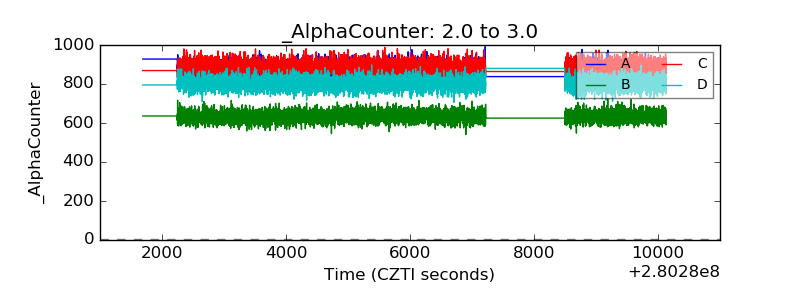 |
| _CPM_Rate | 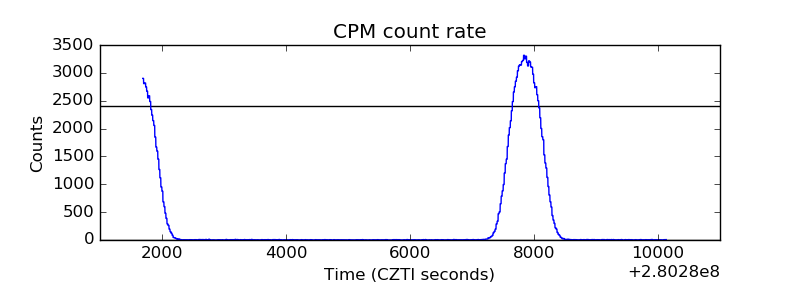 |
| CZT Counter |  |
| +2.5 Volts monitor |  |
| +5 Volts monitor |  |
| _ROLL_ROT | 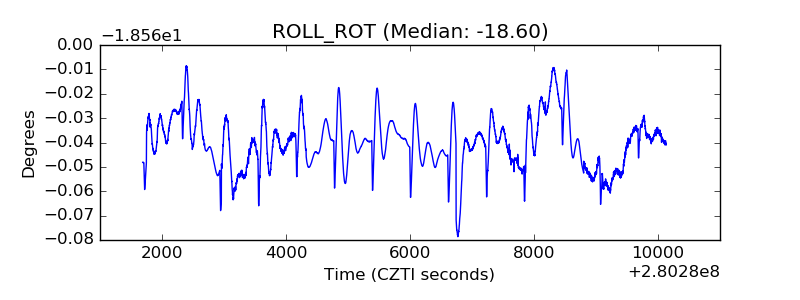 |
| _Roll_DEC | 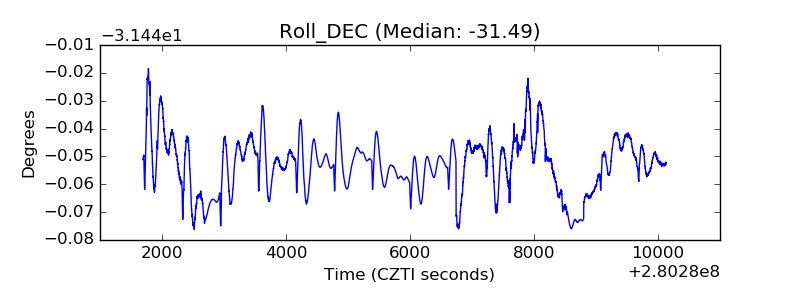 |
| _Roll_RA | 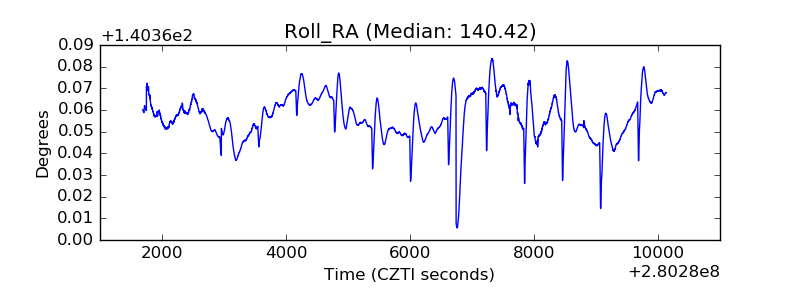 |
| Veto Counter | 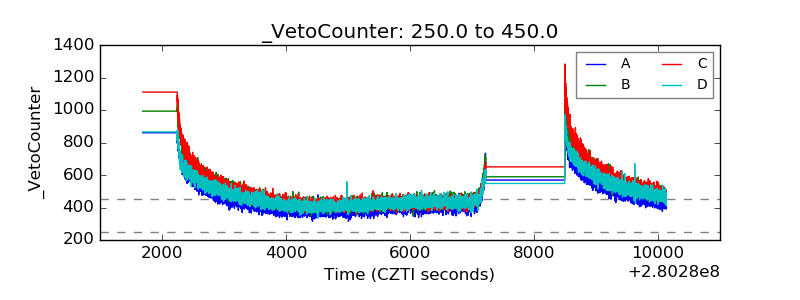 |