| Param | Original file | Final file |
|---|---|---|
| Filename | modeM0/AS1A05_143T01_9000002524_16993cztM0_level2.evt | modeM0/AS1A05_143T01_9000002524_16993cztM0_level2_quad_clean.evt |
| Size (bytes) | 536,961,600 | 76,700,160 |
| Size | 512.1 MB | 73.1 MB |
| Events in quadrant A | 3,747,386 | 486,472 |
| Events in quadrant B | 3,766,729 | 504,655 |
| Events in quadrant C | 3,428,205 | 486,217 |
| Events in quadrant D | 4,949,546 | 462,855 |
| Mode M9 | |||
|---|---|---|---|
| Quadrant | BADHDUFLAG | Total packets | Discarded packets |
| A | 0 | 13 | 0 |
| B | 0 | 13 | 0 |
| C | 0 | 13 | 0 |
| D | 0 | 13 | 0 |
| Mode SS | |||
|---|---|---|---|
| Quadrant | BADHDUFLAG | Total packets | Discarded packets |
| A | 0 | 112 | 0 |
| B | 0 | 112 | 0 |
| C | 0 | 112 | 0 |
| D | 0 | 112 | 0 |
| Mode M0 | |||
|---|---|---|---|
| Quadrant | BADHDUFLAG | Total packets | Discarded packets |
| A | 0 | 14519 | 1 |
| B | 0 | 14534 | 1 |
| C | 0 | 13784 | 1 |
| D | 0 | 18291 | 1 |
| Quadrant | Total seconds | Saturated seconds | Saturation percentage |
|---|---|---|---|
| A | 5458 | 487 | 8.922682% |
| B | 5459 | 467 | 8.554680% |
| C | 5459 | 95 | 1.740245% |
| D | 5459 | 547 | 10.020150% |
Noise dominated data is calculated using 1-second bins in cleaned event files. If a bin has >2000 counts, and if more than 50% of those come from <1% of pixels, then it is considered to be noise-dominated and hence unusable.
| Quadrant | # 1 sec bins | Bins with >0 counts | Bins with >2000 counts | High rate bins dominated by noise | Noise dominated (total time) | Noise dominated (detector-on time) | Marked lightcurve |
|---|---|---|---|---|---|---|---|
| A | 6795 | 5460 | 273 | 273 | 4.02% | 5.00% | 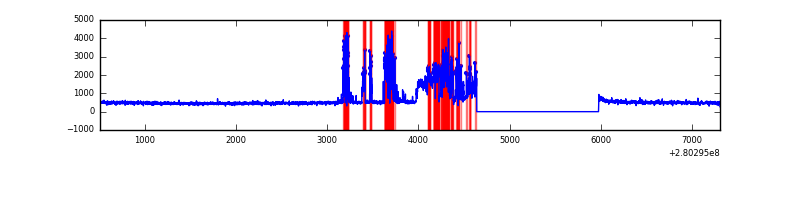 |
| B | 6796 | 5461 | 342 | 342 | 5.03% | 6.26% | 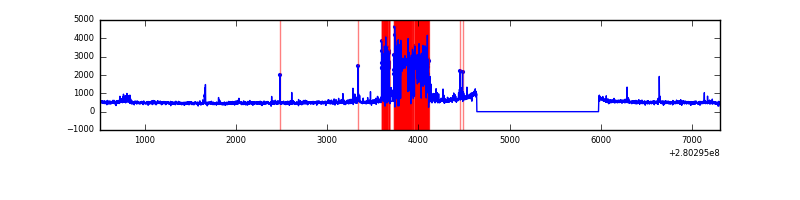 |
| C | 6796 | 5461 | 0 | 0 | 0.00% | 0.00% |  |
| D | 6796 | 5461 | 387 | 387 | 5.69% | 7.09% | 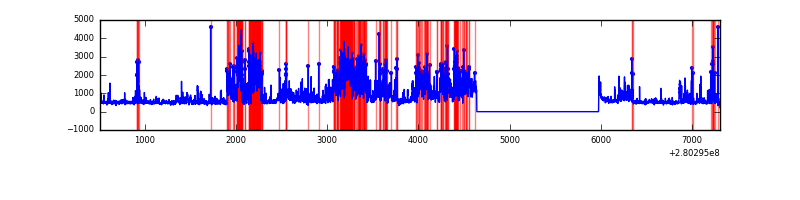 |
Top three noisy pixels from each quadrant. If the there are fewer than three noisy pixels in the level2.evt file, extra rows are filled as -1
| Pixel properties | Quadrant properties | ||||||
|---|---|---|---|---|---|---|---|
| Quadrant | DetID | PixID | Counts | Sigma | Mean | Median | Sigma |
| A | 15 | 174 | 1124197 | 8201.9 | 682 | 668 | 137.0 |
| A | 0 | 226 | 6043 | 39.24 | 682 | 668 | 137.0 |
| A | 12 | 194 | 5135 | 32.61 | 682 | 668 | 137.0 |
| B | 3 | 64 | 992633 | 7829.53 | 673 | 656 | 126.7 |
| B | 0 | 229 | 89327 | 699.86 | 673 | 656 | 126.7 |
| B | 6 | 36 | 20562 | 157.11 | 673 | 656 | 126.7 |
| C | 3 | 233 | 626226 | 3884.9 | 691 | 696 | 161.0 |
| C | 14 | 238 | 108521 | 669.65 | 691 | 696 | 161.0 |
| C | 13 | 61 | 4962 | 26.49 | 691 | 696 | 161.0 |
| D | 1 | 52 | 2342976 | 14273.69 | 680 | 660 | 164.1 |
| D | 2 | 234 | 20491 | 120.85 | 680 | 660 | 164.1 |
| D | 2 | 152 | 14936 | 87.0 | 680 | 660 | 164.1 |
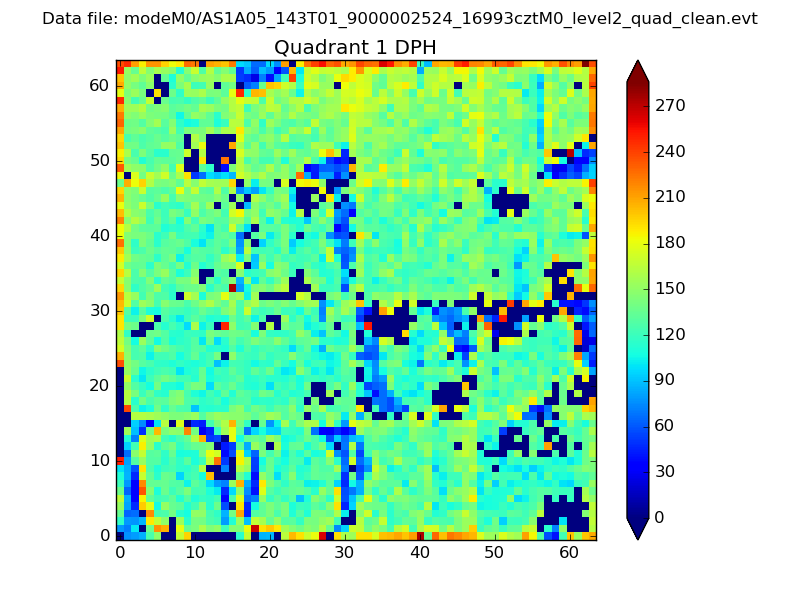
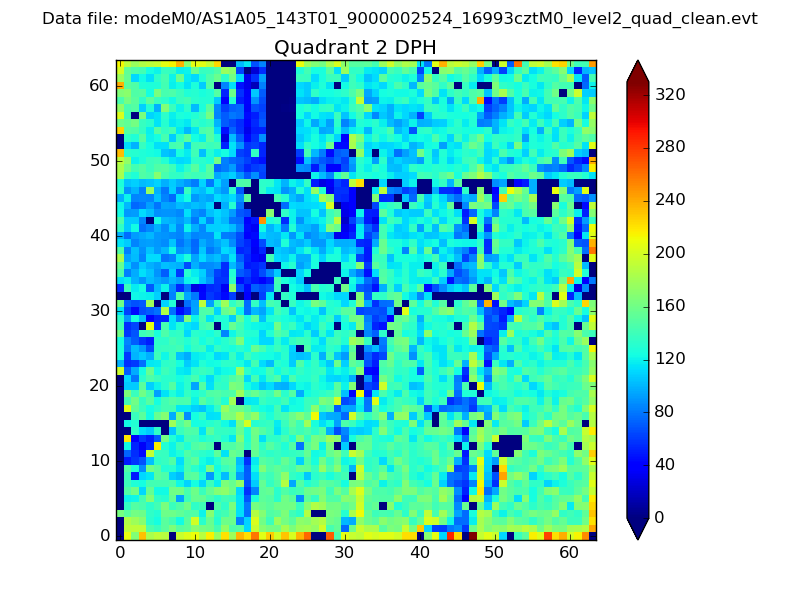
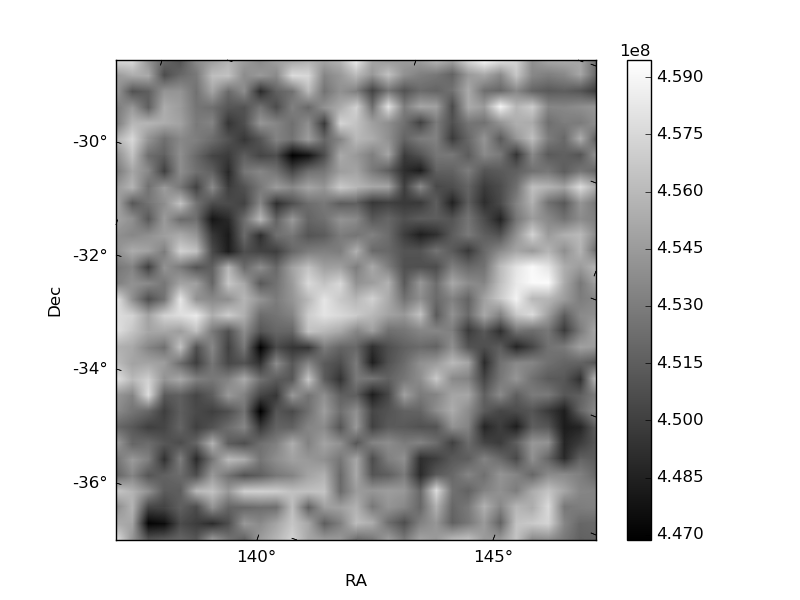
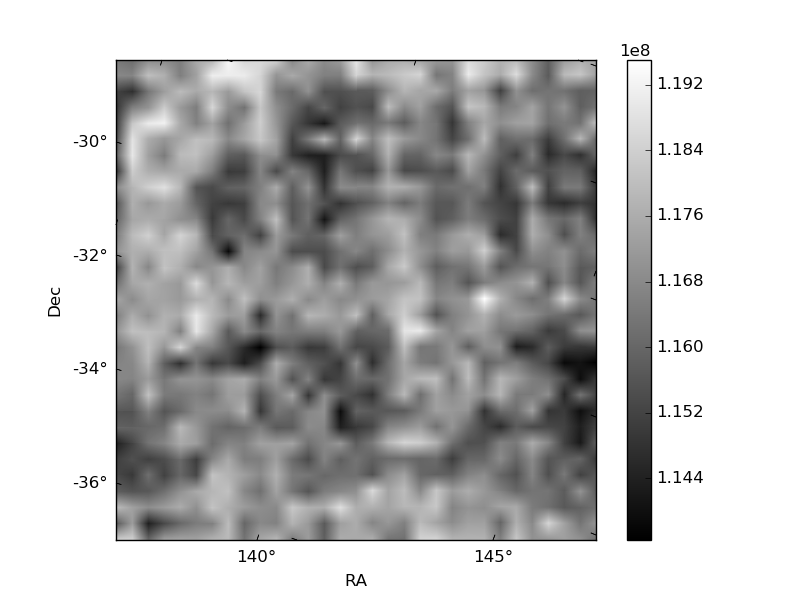
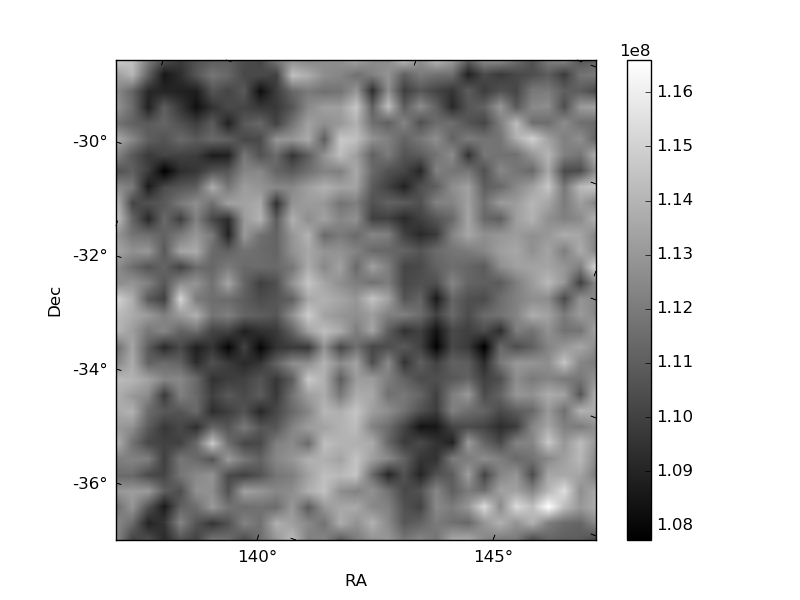
Histogram calculated using DETX and DETY for each event in the final _common_clean file
| Quadrant A | 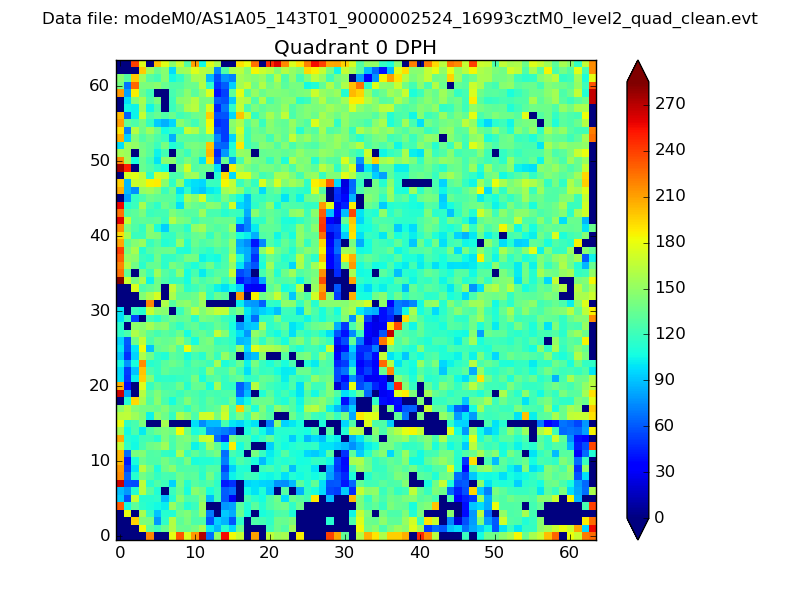 |
 |
Quadrant B |
|---|---|---|---|
| Quadrant D | 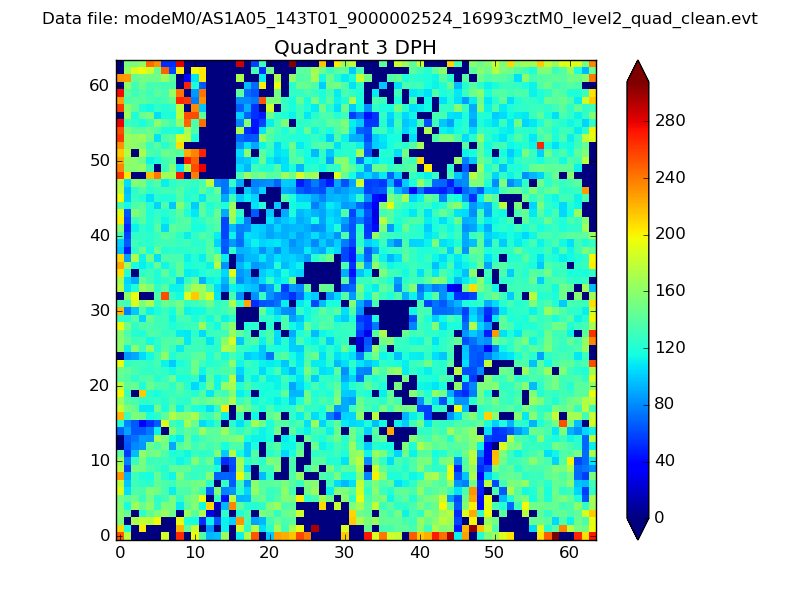 |
 |
Quadrant C |
| Plot type | Count rate plots | Images |
|---|---|---|
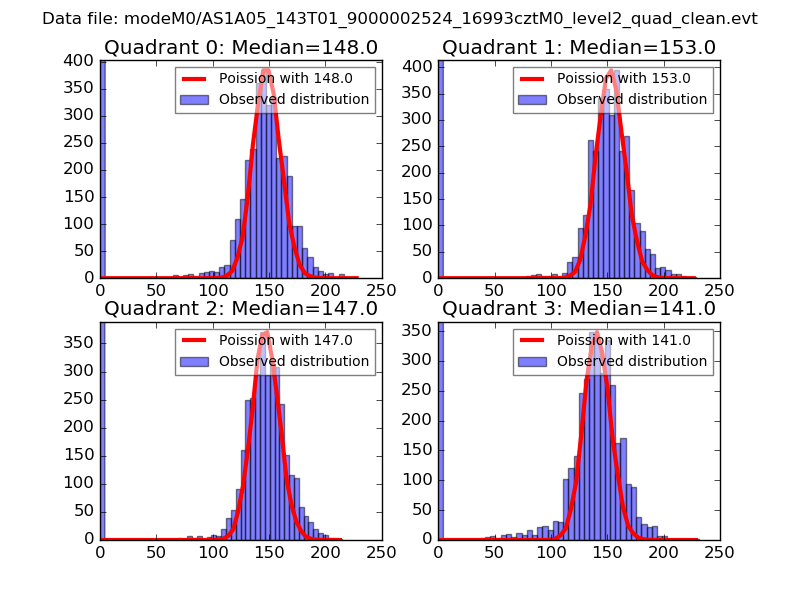
| Comparison with Poisson distribution Blue bars denote a histogram of data divided into 1 sec bins. Red curve is a Poisson curve with rate = median count rate of data. |
 |
 |
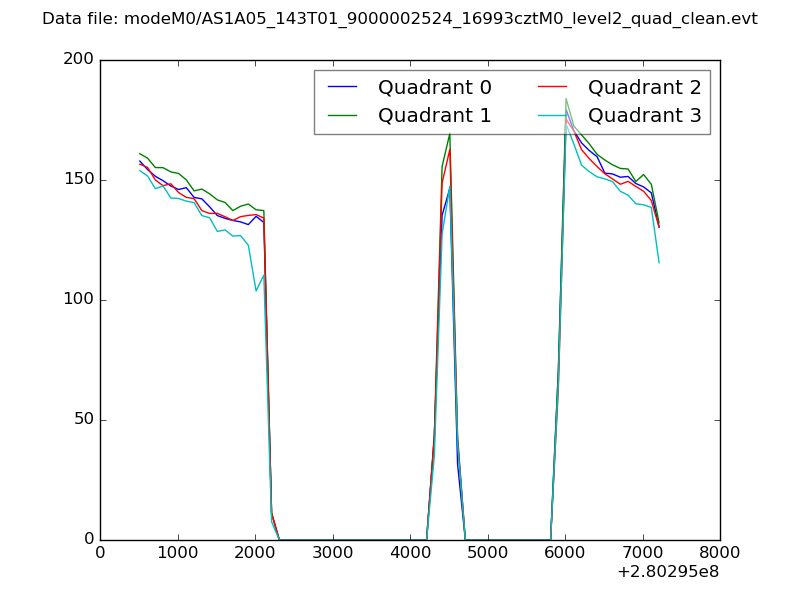
| Quadrant-wise count rates Data is divided into 100 sec bins |
 |
|
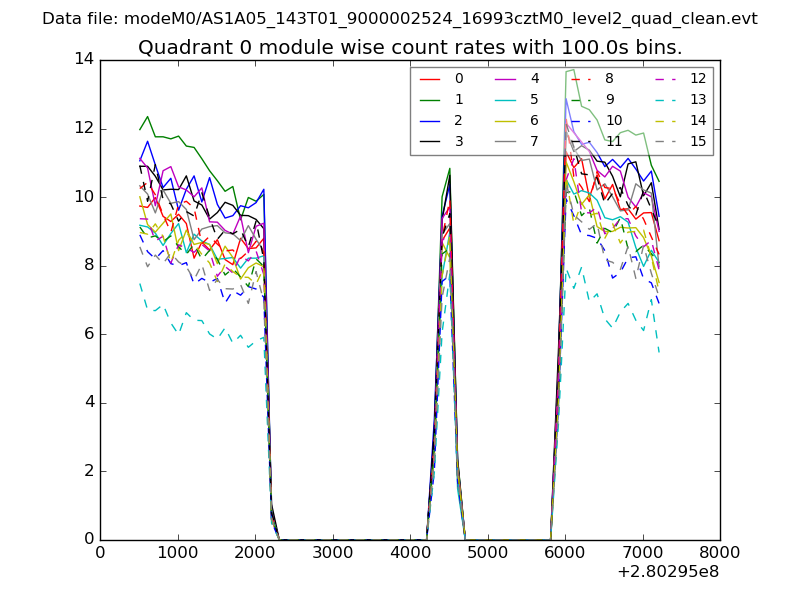
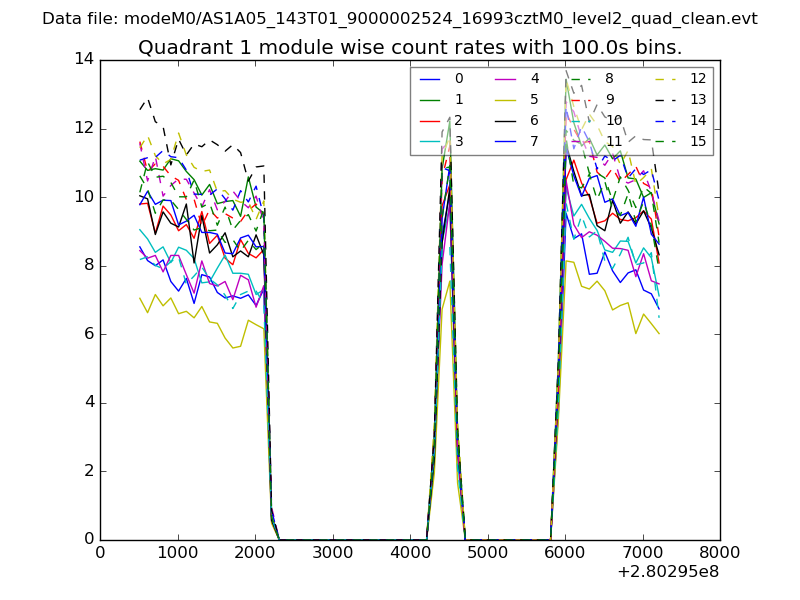
| Module-wise count rates for Quadrant A Data is divided into 100 sec bins |
 |
 |
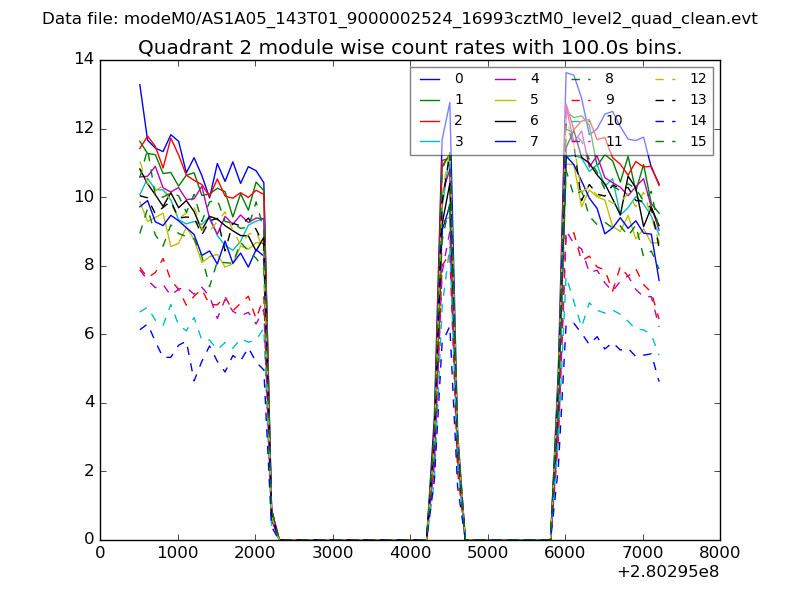
| Module-wise count rates for Quadrant B Data is divided into 100 sec bins |
 |
 |
| Module-wise count rates for Quadrant C Data is divided into 100 sec bins |
 |
 |
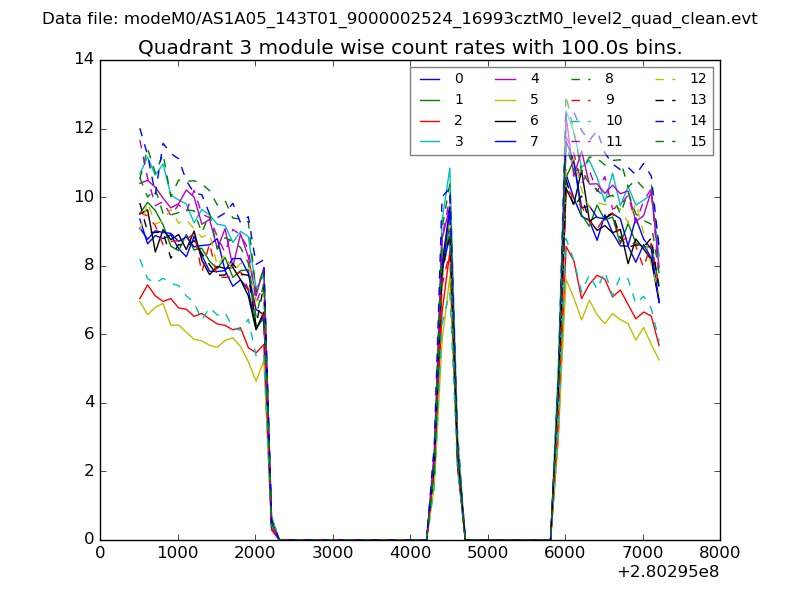
| Module-wise count rates for Quadrant D Data is divided into 100 sec bins |
 |
 |
| Parameter | Plot |
|---|---|
| CZT HV Monitor | 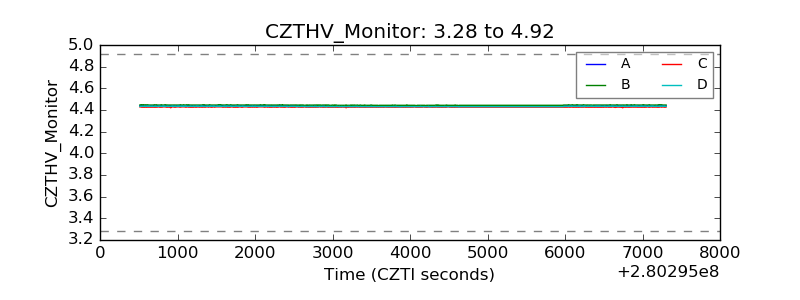 |
| D_VDD | 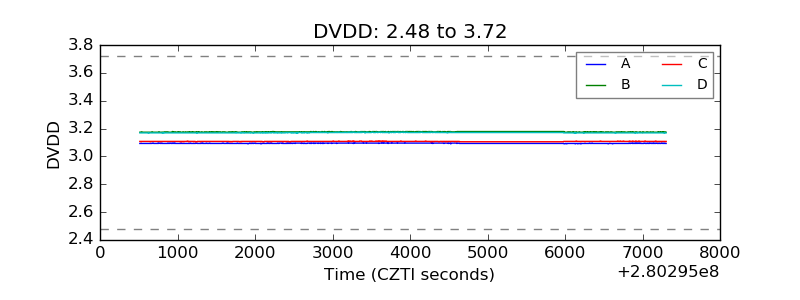 |
| Temperature 1 | 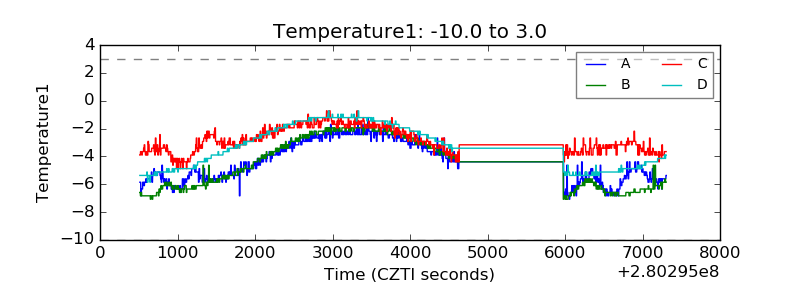 |
| Veto HV Monitor |  |
| Veto LLD | 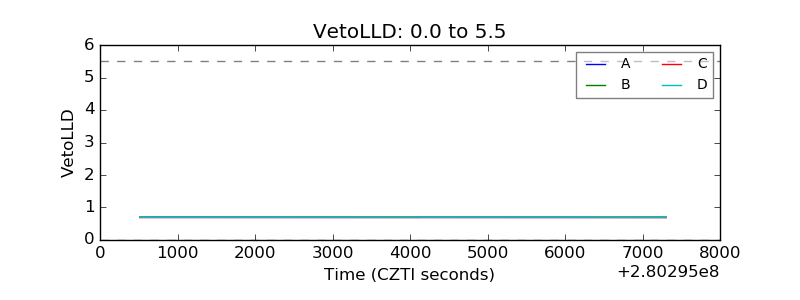 |
| Alpha Counter | 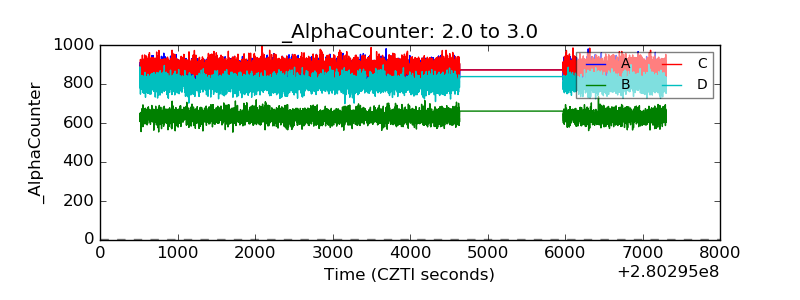 |
| _CPM_Rate | 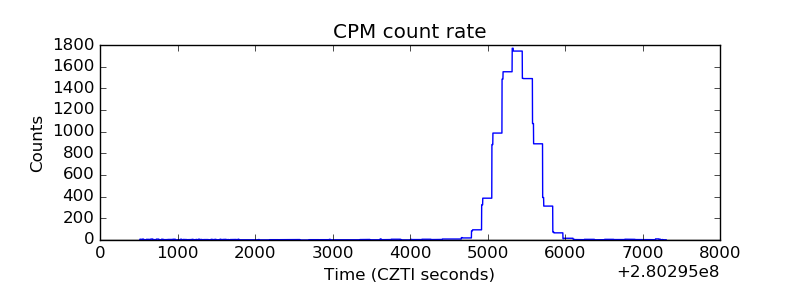 |
| CZT Counter | 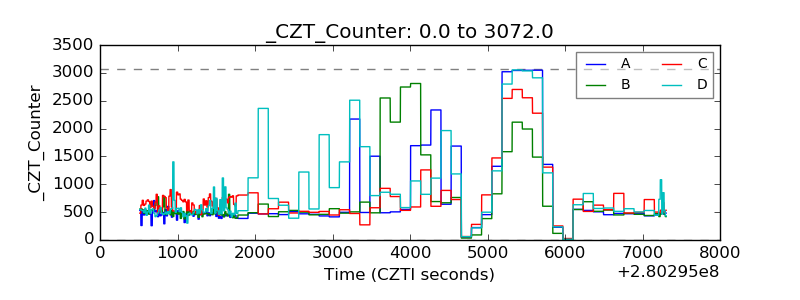 |
| +2.5 Volts monitor |  |
| +5 Volts monitor |  |
| _ROLL_ROT | 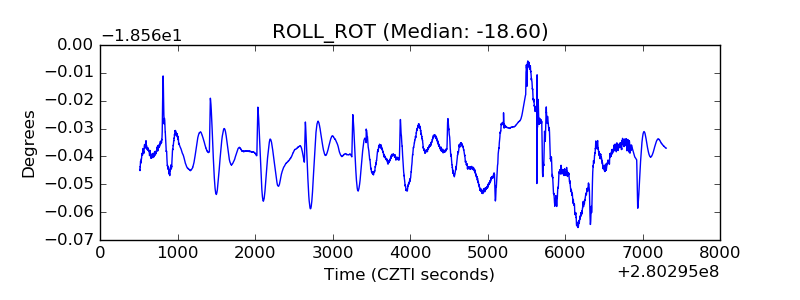 |
| _Roll_DEC | 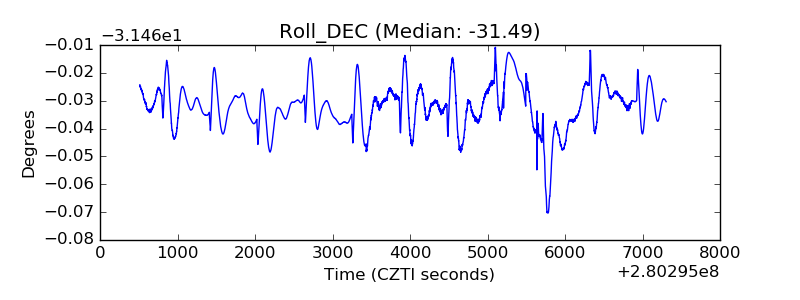 |
| _Roll_RA | 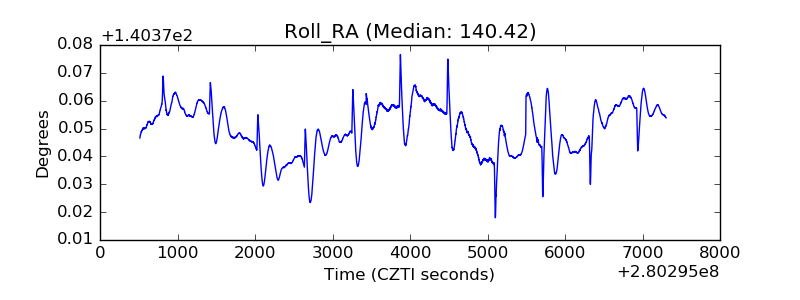 |
| Veto Counter | 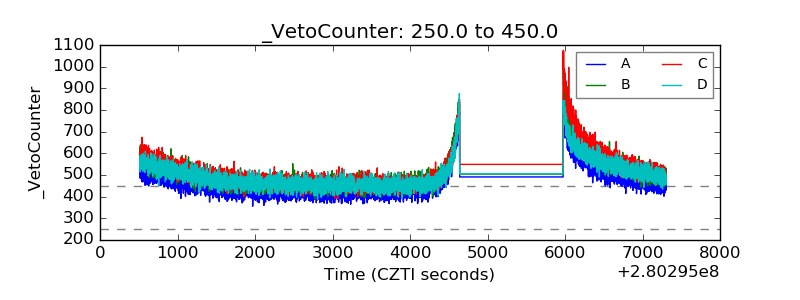 |