| Param | Original file | Final file |
|---|---|---|
| Filename | modeM0/AS1A05_143T01_9000002524_16994cztM0_level2.evt | modeM0/AS1A05_143T01_9000002524_16994cztM0_level2_quad_clean.evt |
| Size (bytes) | 529,012,800 | 80,282,880 |
| Size | 504.5 MB | 76.6 MB |
| Events in quadrant A | 2,852,515 | 528,140 |
| Events in quadrant B | 3,074,596 | 539,787 |
| Events in quadrant C | 3,396,941 | 520,927 |
| Events in quadrant D | 6,300,472 | 433,048 |
| Mode M9 | |||
|---|---|---|---|
| Quadrant | BADHDUFLAG | Total packets | Discarded packets |
| A | 0 | 13 | 0 |
| B | 0 | 13 | 0 |
| C | 0 | 13 | 0 |
| D | 0 | 13 | 0 |
| Mode SS | |||
|---|---|---|---|
| Quadrant | BADHDUFLAG | Total packets | Discarded packets |
| A | 0 | 118 | 0 |
| B | 0 | 118 | 0 |
| C | 0 | 118 | 0 |
| D | 0 | 118 | 0 |
| Mode M0 | |||
|---|---|---|---|
| Quadrant | BADHDUFLAG | Total packets | Discarded packets |
| A | 0 | 12051 | 2 |
| B | 0 | 12675 | 1 |
| C | 0 | 13805 | 1 |
| D | 0 | 22667 | 1 |
| Quadrant | Total seconds | Saturated seconds | Saturation percentage |
|---|---|---|---|
| A | 5853 | 19 | 0.324620% |
| B | 5854 | 41 | 0.700376% |
| C | 5854 | 67 | 1.144517% |
| D | 5854 | 1085 | 18.534335% |
Noise dominated data is calculated using 1-second bins in cleaned event files. If a bin has >2000 counts, and if more than 50% of those come from <1% of pixels, then it is considered to be noise-dominated and hence unusable.
| Quadrant | # 1 sec bins | Bins with >0 counts | Bins with >2000 counts | High rate bins dominated by noise | Noise dominated (total time) | Noise dominated (detector-on time) | Marked lightcurve |
|---|---|---|---|---|---|---|---|
| A | 7144 | 5855 | 0 | 0 | 0.00% | 0.00% | 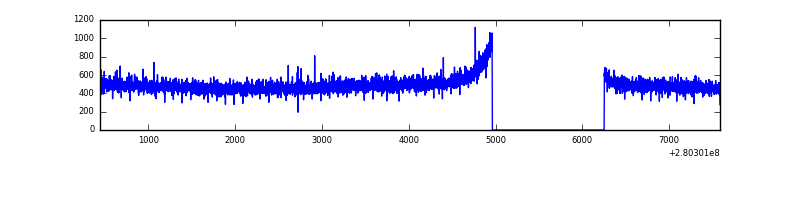 |
| B | 7145 | 5856 | 0 | 0 | 0.00% | 0.00% | 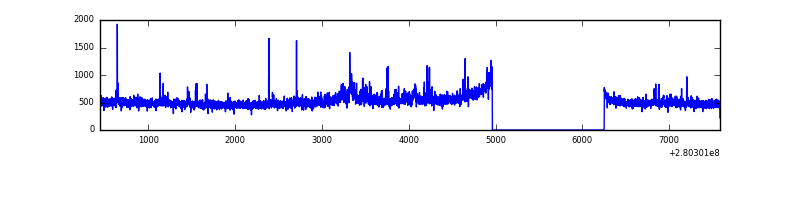 |
| C | 7145 | 5856 | 0 | 0 | 0.00% | 0.00% | 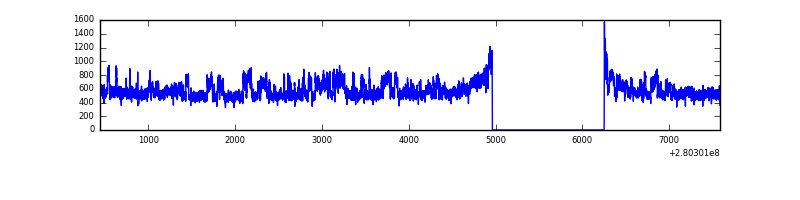 |
| D | 7145 | 5856 | 944 | 944 | 13.21% | 16.12% | 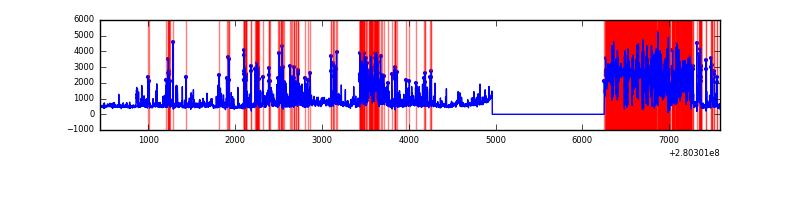 |
Top three noisy pixels from each quadrant. If the there are fewer than three noisy pixels in the level2.evt file, extra rows are filled as -1
| Pixel properties | Quadrant properties | ||||||
|---|---|---|---|---|---|---|---|
| Quadrant | DetID | PixID | Counts | Sigma | Mean | Median | Sigma |
| A | 0 | 226 | 6692 | 39.85 | 742 | 727 | 149.7 |
| A | 12 | 194 | 5510 | 31.95 | 742 | 727 | 149.7 |
| A | 3 | 137 | 5016 | 28.65 | 742 | 727 | 149.7 |
| B | 15 | 35 | 44643 | 313.82 | 739 | 723 | 140.0 |
| B | 3 | 64 | 35047 | 245.26 | 739 | 723 | 140.0 |
| B | 0 | 229 | 34451 | 241.0 | 739 | 723 | 140.0 |
| C | 3 | 233 | 462668 | 2711.85 | 724 | 731 | 170.3 |
| C | 14 | 238 | 111566 | 650.67 | 724 | 731 | 170.3 |
| C | 13 | 61 | 5105 | 25.68 | 724 | 731 | 170.3 |
| D | 1 | 52 | 3711295 | 22873.11 | 668 | 650 | 162.2 |
| D | 2 | 152 | 25437 | 152.79 | 668 | 650 | 162.2 |
| D | 2 | 234 | 20960 | 125.19 | 668 | 650 | 162.2 |
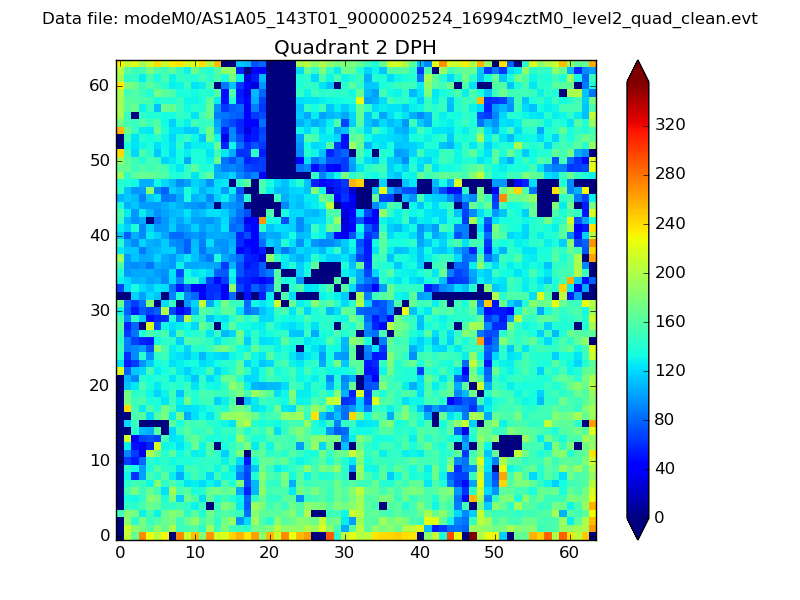
Histogram calculated using DETX and DETY for each event in the final _common_clean file
| Quadrant A | 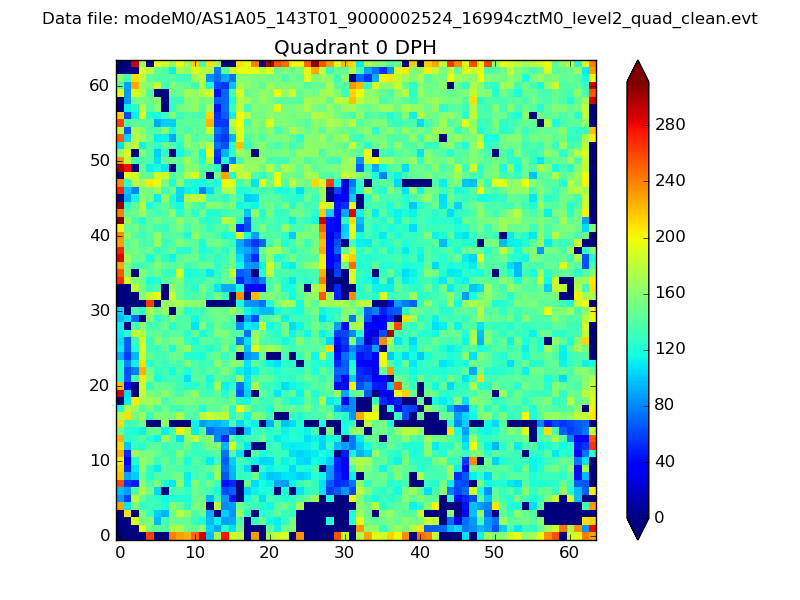 |
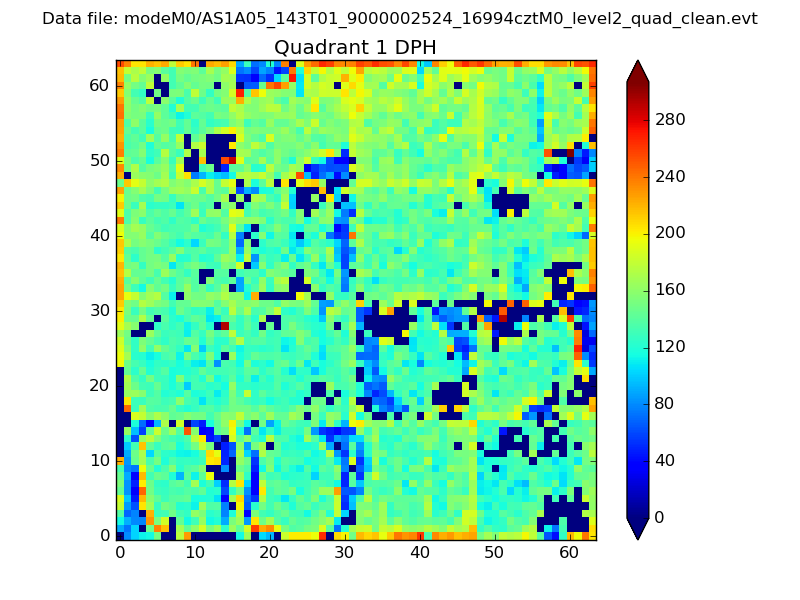 |
Quadrant B |
|---|---|---|---|
| Quadrant D | 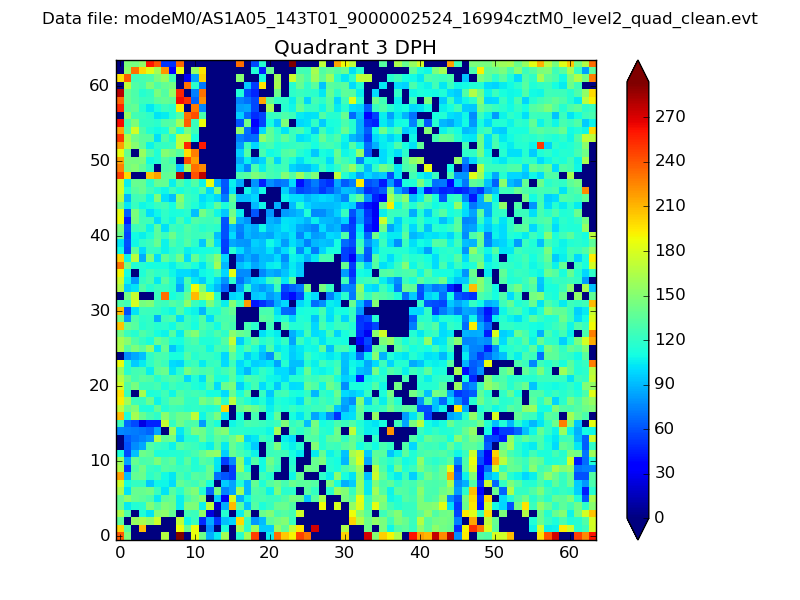 |
 |
Quadrant C |
| Plot type | Count rate plots | Images |
|---|---|---|
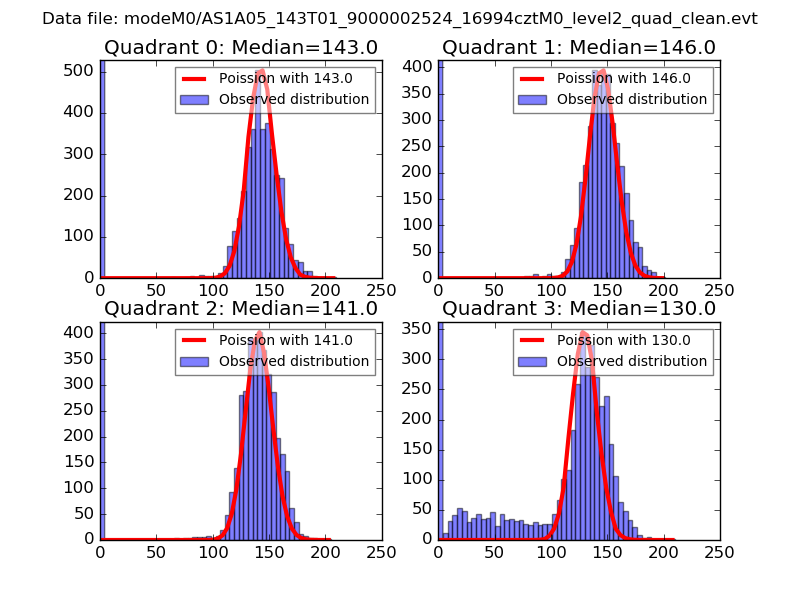
| Comparison with Poisson distribution Blue bars denote a histogram of data divided into 1 sec bins. Red curve is a Poisson curve with rate = median count rate of data. |
 |
 |
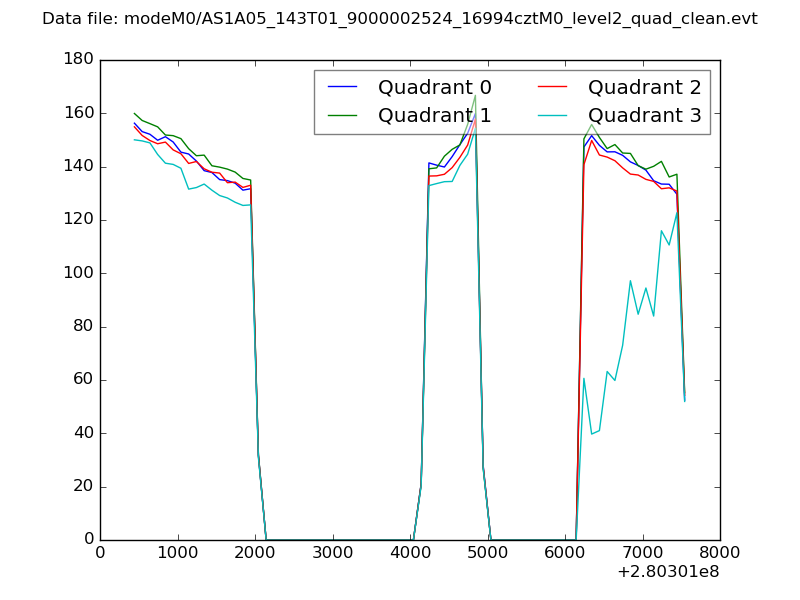
| Quadrant-wise count rates Data is divided into 100 sec bins |
 |
|
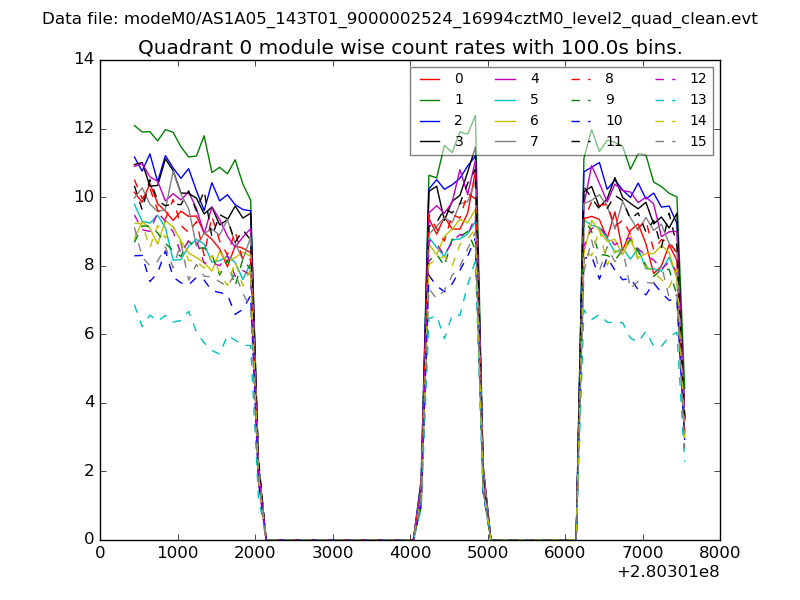
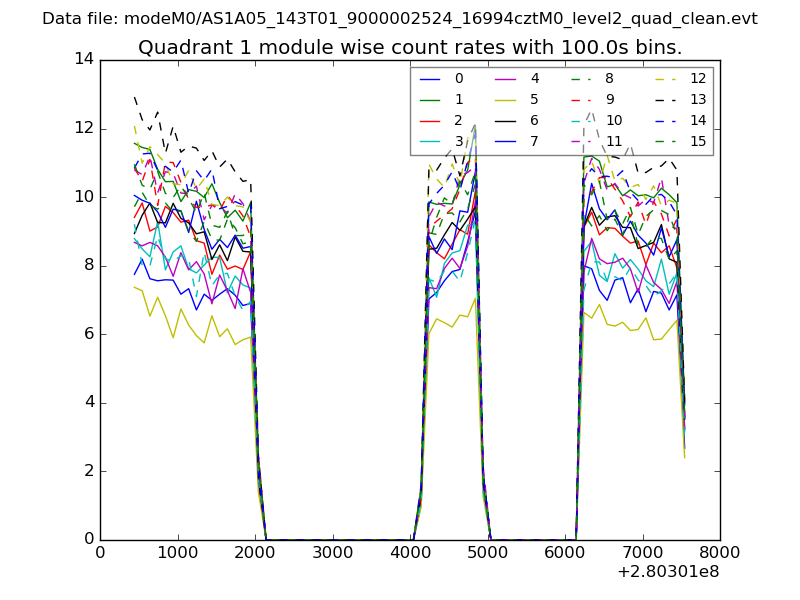
| Module-wise count rates for Quadrant A Data is divided into 100 sec bins |
 |
 |
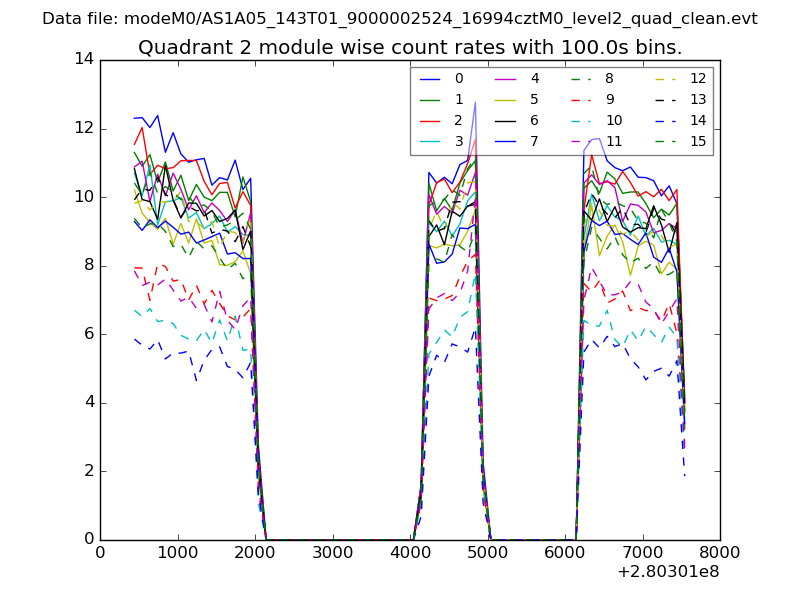
| Module-wise count rates for Quadrant B Data is divided into 100 sec bins |
 |
 |
| Module-wise count rates for Quadrant C Data is divided into 100 sec bins |
 |
 |
| Module-wise count rates for Quadrant D Data is divided into 100 sec bins |
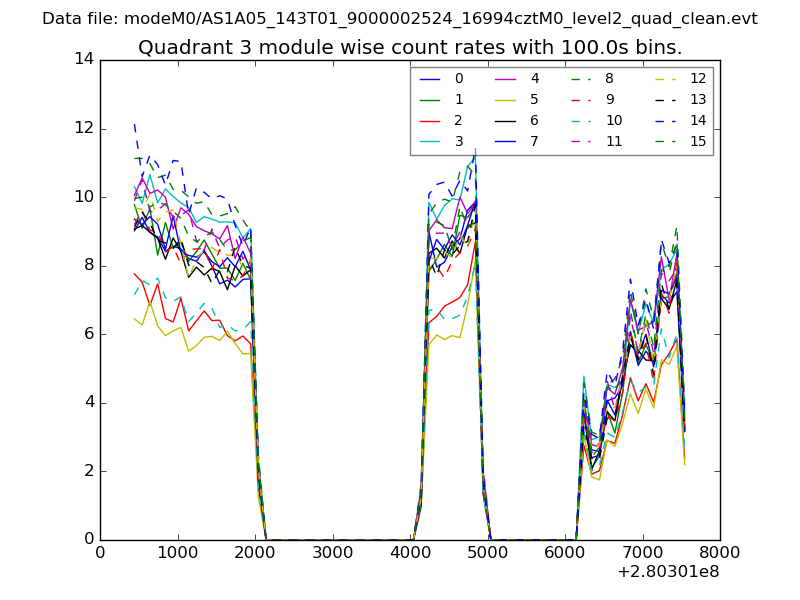 |
 |
| Parameter | Plot |
|---|---|
| CZT HV Monitor | 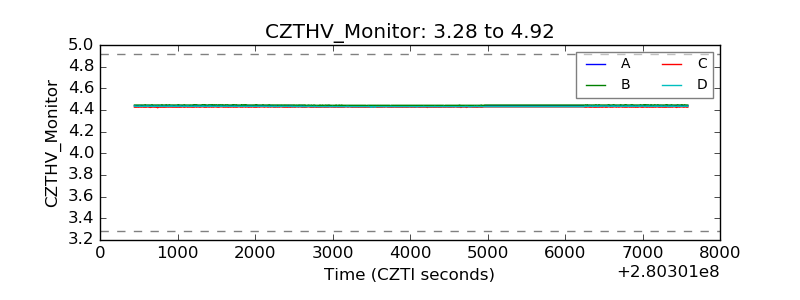 |
| D_VDD | 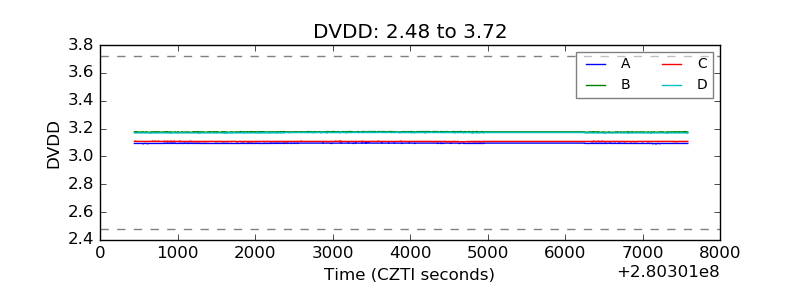 |
| Temperature 1 | 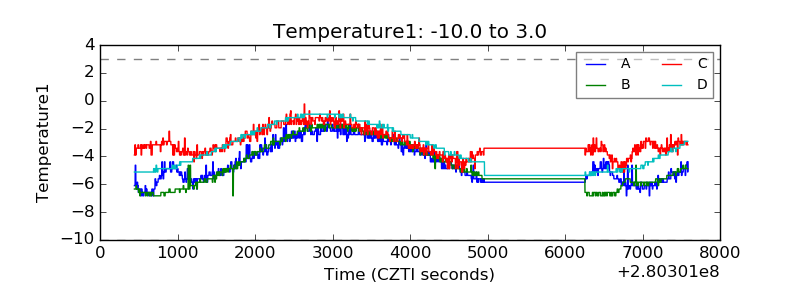 |
| Veto HV Monitor | 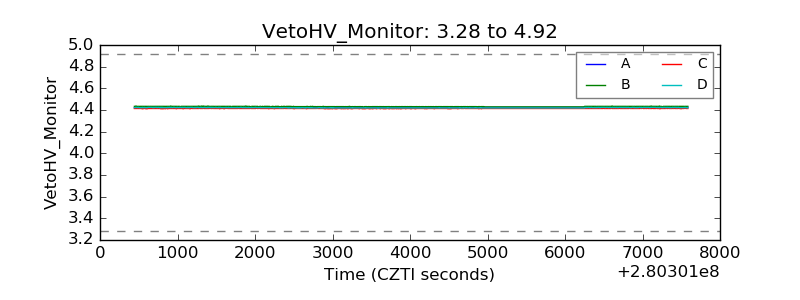 |
| Veto LLD | 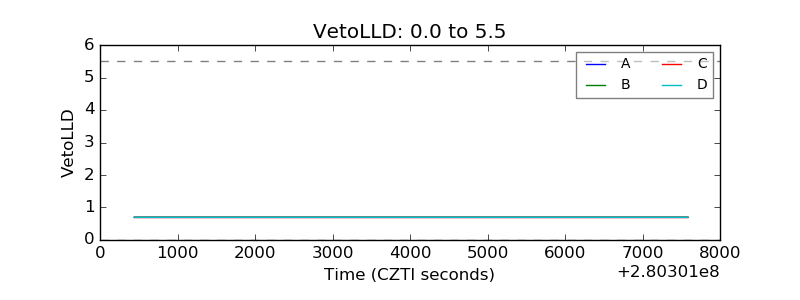 |
| Alpha Counter | 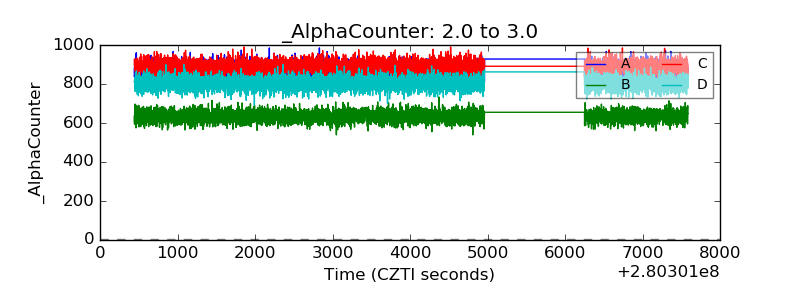 |
| _CPM_Rate | 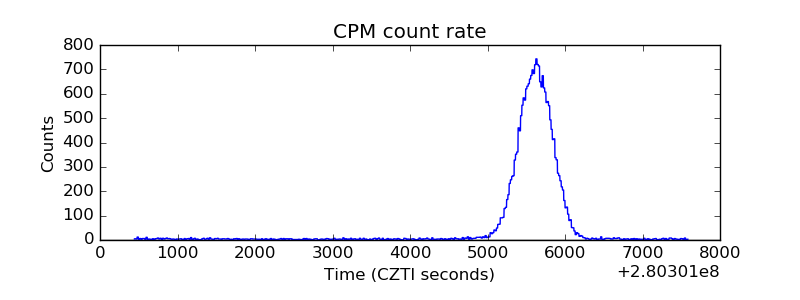 |
| CZT Counter | 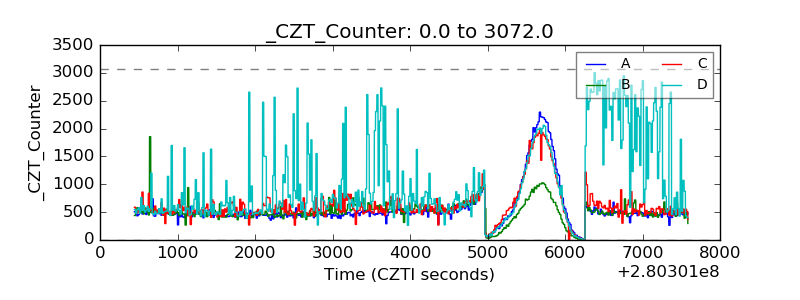 |
| +2.5 Volts monitor |  |
| +5 Volts monitor | 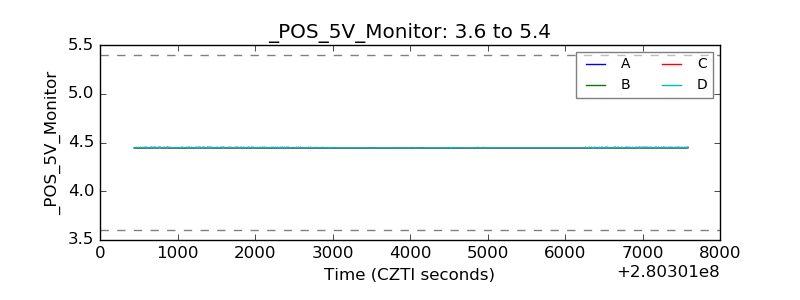 |
| _ROLL_ROT |  |
| _Roll_DEC | 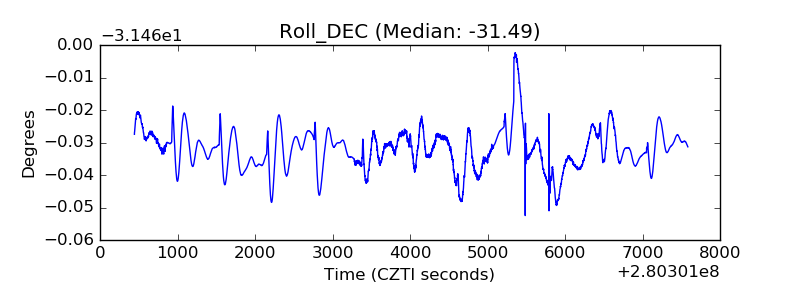 |
| _Roll_RA | 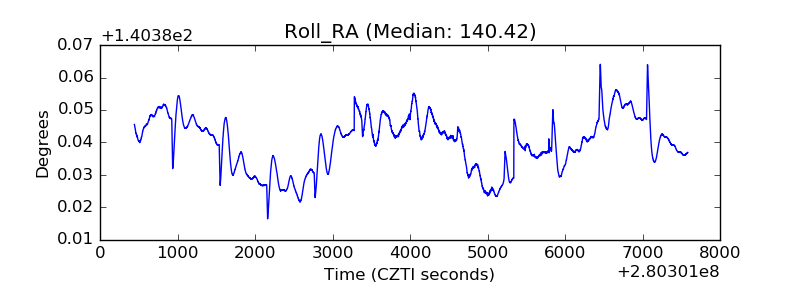 |
| Veto Counter | 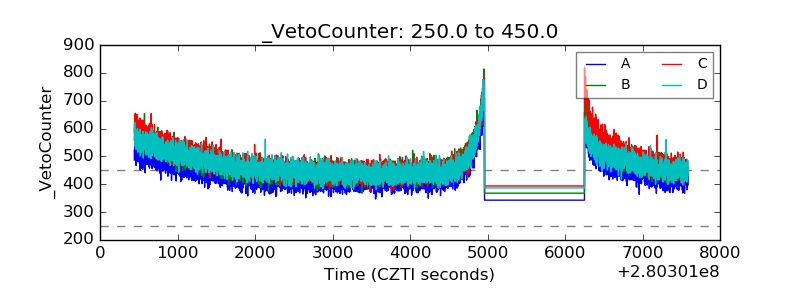 |