| Param | Original file | Final file |
|---|---|---|
| Filename | modeM0/AS1A05_143T01_9000002524_16995cztM0_level2.evt | modeM0/AS1A05_143T01_9000002524_16995cztM0_level2_quad_clean.evt |
| Size (bytes) | 554,869,440 | 80,550,720 |
| Size | 529.2 MB | 76.8 MB |
| Events in quadrant A | 2,870,014 | 517,927 |
| Events in quadrant B | 3,276,737 | 527,843 |
| Events in quadrant C | 3,335,153 | 508,332 |
| Events in quadrant D | 6,911,638 | 461,719 |
| Mode M9 | |||
|---|---|---|---|
| Quadrant | BADHDUFLAG | Total packets | Discarded packets |
| A | 0 | 9 | 0 |
| B | 0 | 9 | 0 |
| C | 0 | 9 | 0 |
| D | 0 | 9 | 0 |
| Mode SS | |||
|---|---|---|---|
| Quadrant | BADHDUFLAG | Total packets | Discarded packets |
| A | 0 | 124 | 0 |
| B | 0 | 124 | 0 |
| C | 0 | 124 | 0 |
| D | 0 | 124 | 0 |
| Mode M0 | |||
|---|---|---|---|
| Quadrant | BADHDUFLAG | Total packets | Discarded packets |
| A | 0 | 12360 | 1 |
| B | 0 | 13469 | 1 |
| C | 0 | 13571 | 1 |
| D | 0 | 24559 | 1 |
| Quadrant | Total seconds | Saturated seconds | Saturation percentage |
|---|---|---|---|
| A | 6055 | 59 | 0.974401% |
| B | 6056 | 106 | 1.750330% |
| C | 6056 | 84 | 1.387054% |
| D | 6056 | 1376 | 22.721268% |
Noise dominated data is calculated using 1-second bins in cleaned event files. If a bin has >2000 counts, and if more than 50% of those come from <1% of pixels, then it is considered to be noise-dominated and hence unusable.
| Quadrant | # 1 sec bins | Bins with >0 counts | Bins with >2000 counts | High rate bins dominated by noise | Noise dominated (total time) | Noise dominated (detector-on time) | Marked lightcurve |
|---|---|---|---|---|---|---|---|
| A | 7006 | 6057 | 0 | 0 | 0.00% | 0.00% | 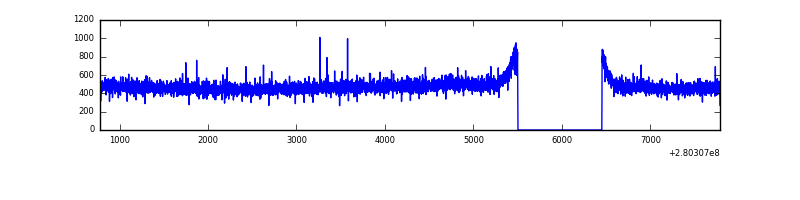 |
| B | 7007 | 6058 | 37 | 37 | 0.53% | 0.61% | 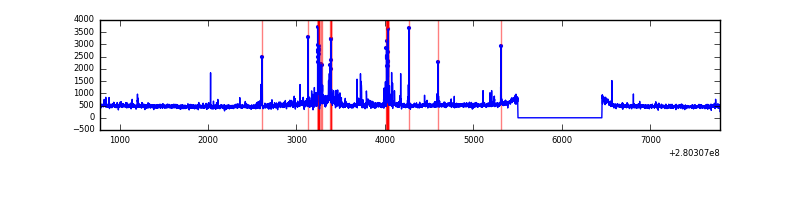 |
| C | 7007 | 6058 | 0 | 0 | 0.00% | 0.00% |  |
| D | 7007 | 6058 | 1124 | 1124 | 16.04% | 18.55% | 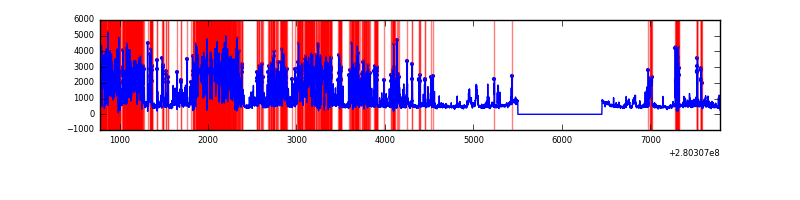 |
Top three noisy pixels from each quadrant. If the there are fewer than three noisy pixels in the level2.evt file, extra rows are filled as -1
| Pixel properties | Quadrant properties | ||||||
|---|---|---|---|---|---|---|---|
| Quadrant | DetID | PixID | Counts | Sigma | Mean | Median | Sigma |
| A | 0 | 226 | 6495 | 37.97 | 745 | 729 | 151.8 |
| A | 12 | 194 | 5505 | 31.45 | 745 | 729 | 151.8 |
| A | 3 | 137 | 5080 | 28.66 | 745 | 729 | 151.8 |
| B | 7 | 220 | 93790 | 656.83 | 739 | 721 | 141.7 |
| B | 0 | 229 | 86936 | 608.46 | 739 | 721 | 141.7 |
| B | 0 | 197 | 53345 | 371.39 | 739 | 721 | 141.7 |
| C | 3 | 233 | 401992 | 2371.05 | 722 | 729 | 169.2 |
| C | 14 | 238 | 110609 | 649.28 | 722 | 729 | 169.2 |
| C | 13 | 61 | 5108 | 25.88 | 722 | 729 | 169.2 |
| D | 1 | 52 | 4205379 | 26365.66 | 659 | 639 | 159.5 |
| D | 2 | 152 | 85966 | 535.04 | 659 | 639 | 159.5 |
| D | 12 | 110 | 82183 | 511.32 | 659 | 639 | 159.5 |
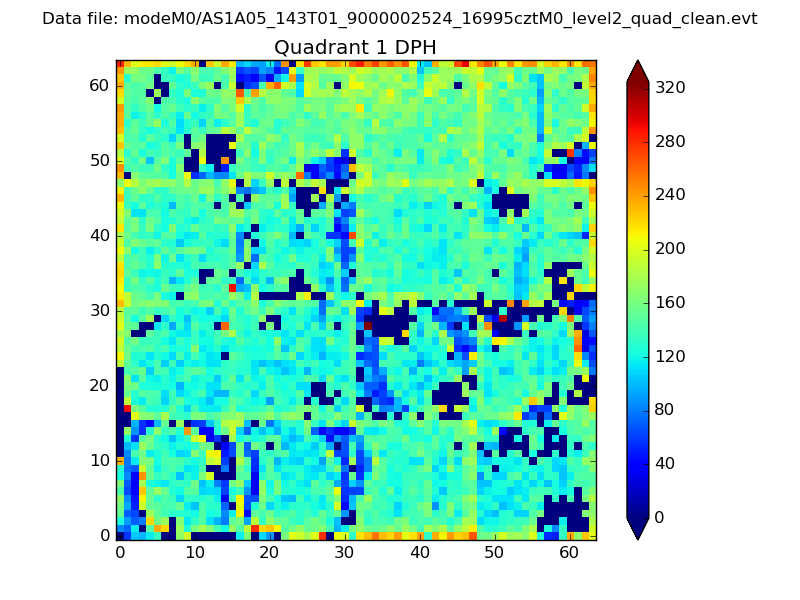
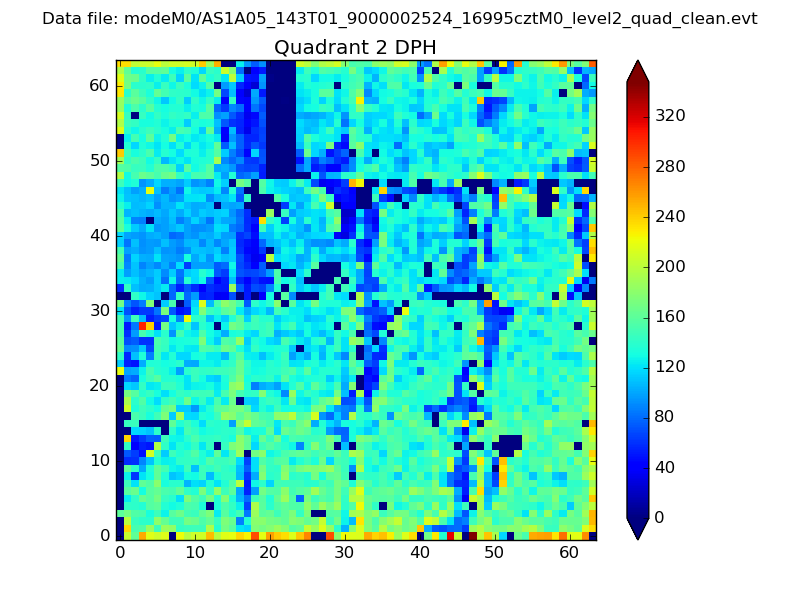
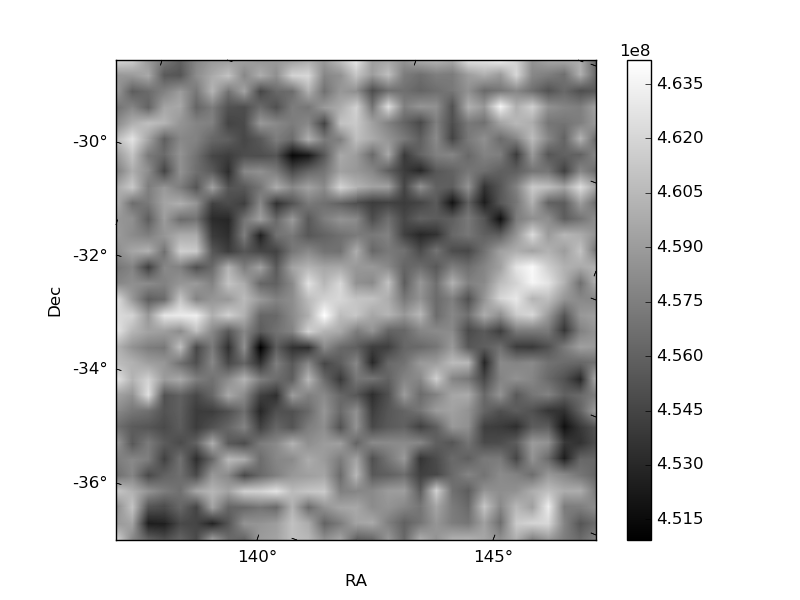
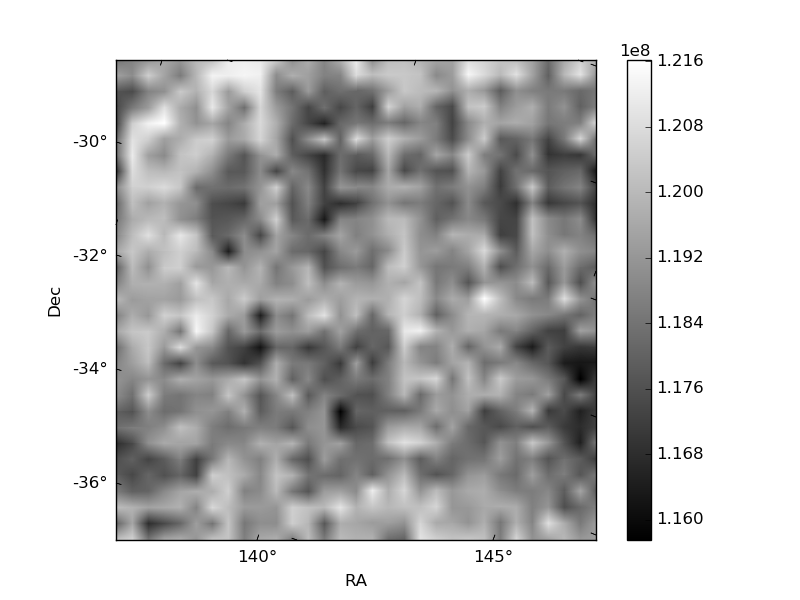
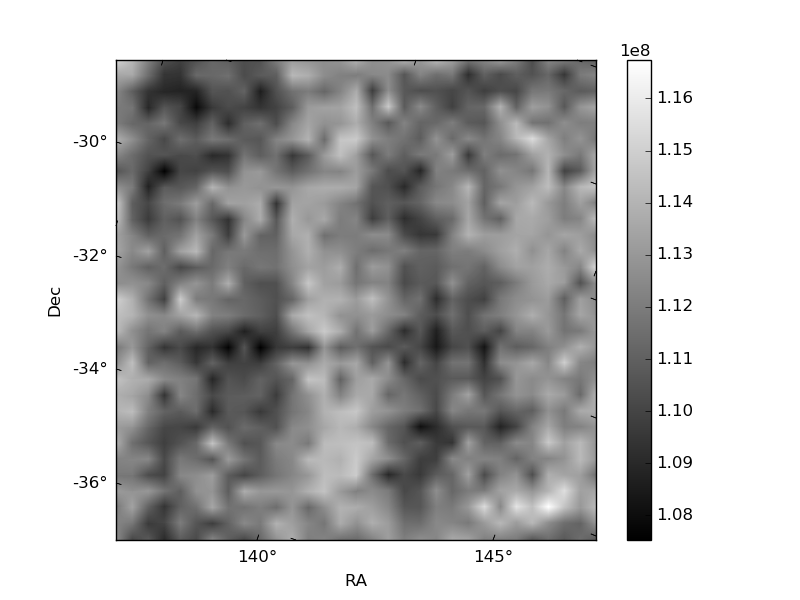
Histogram calculated using DETX and DETY for each event in the final _common_clean file
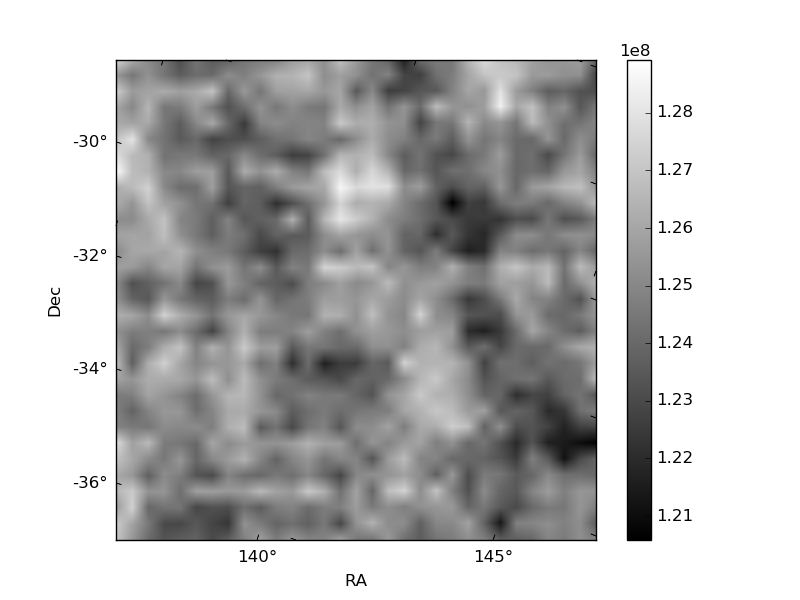
| Quadrant A | 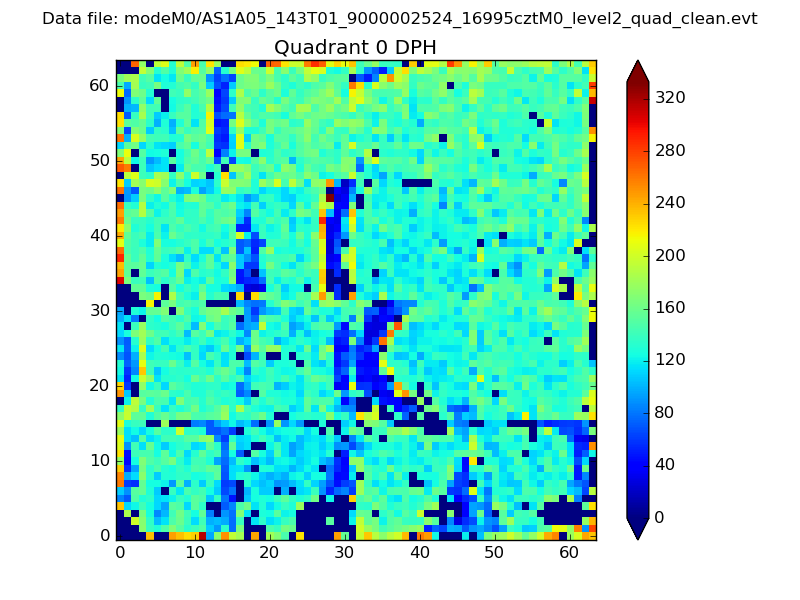 |
 |
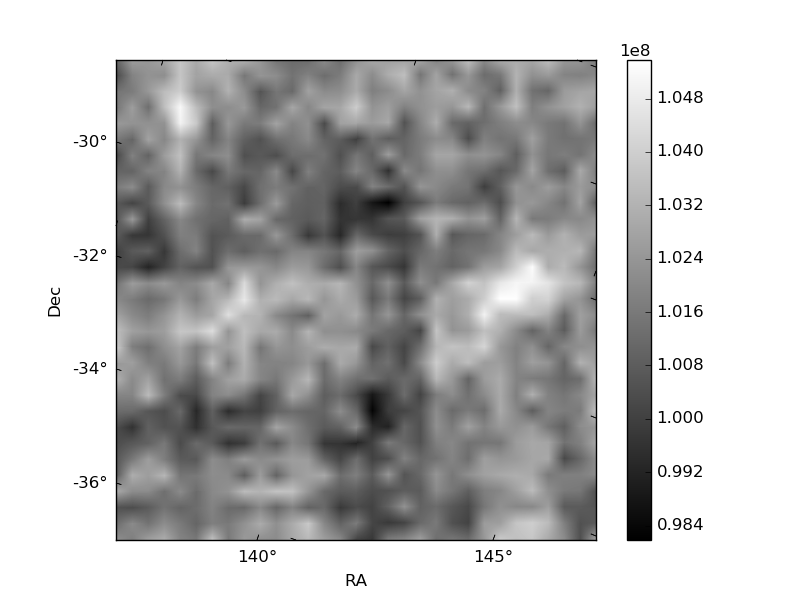
Quadrant B |
|---|---|---|---|
| Quadrant D | 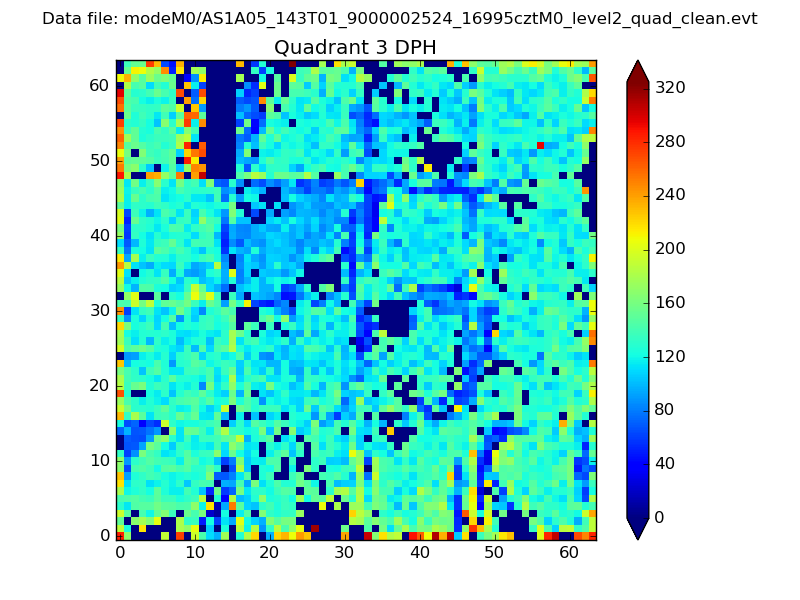 |
 |
Quadrant C |
| Plot type | Count rate plots | Images |
|---|---|---|
| Comparison with Poisson distribution Blue bars denote a histogram of data divided into 1 sec bins. Red curve is a Poisson curve with rate = median count rate of data. |
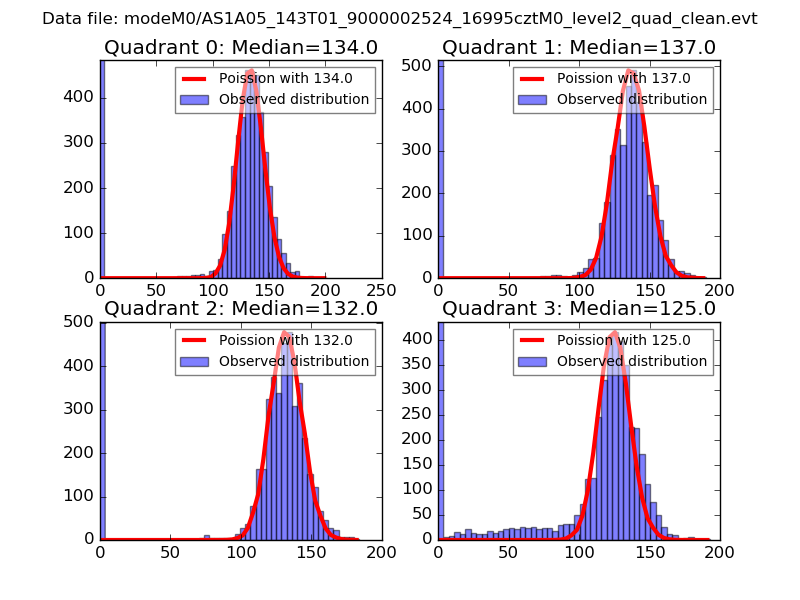 |
 |
| Quadrant-wise count rates Data is divided into 100 sec bins |
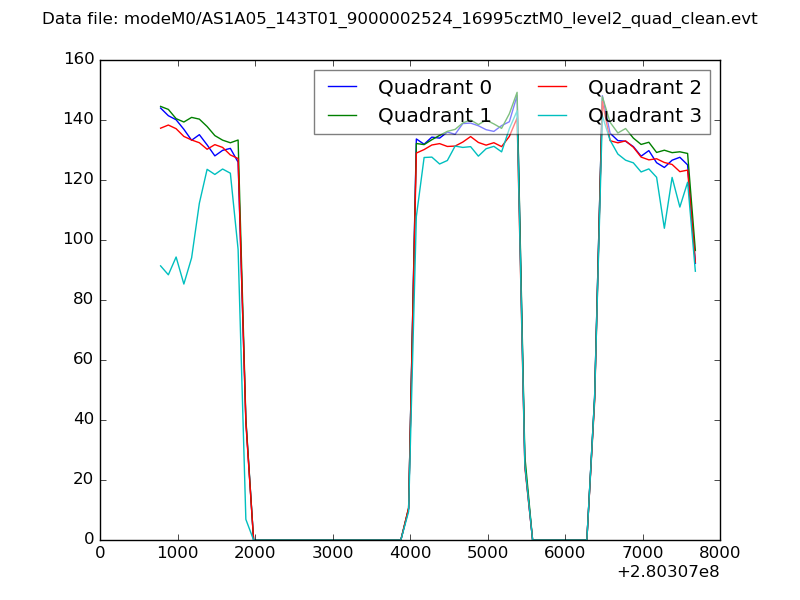 |
|
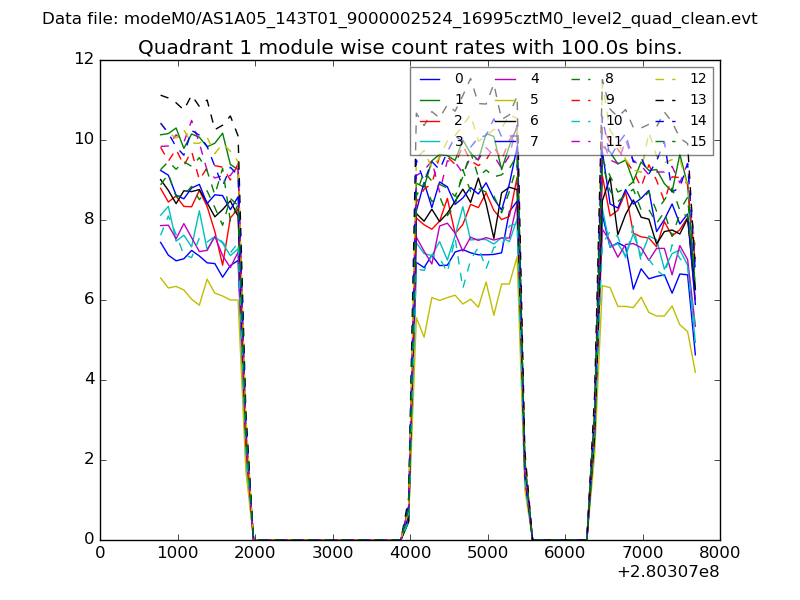
| Module-wise count rates for Quadrant A Data is divided into 100 sec bins |
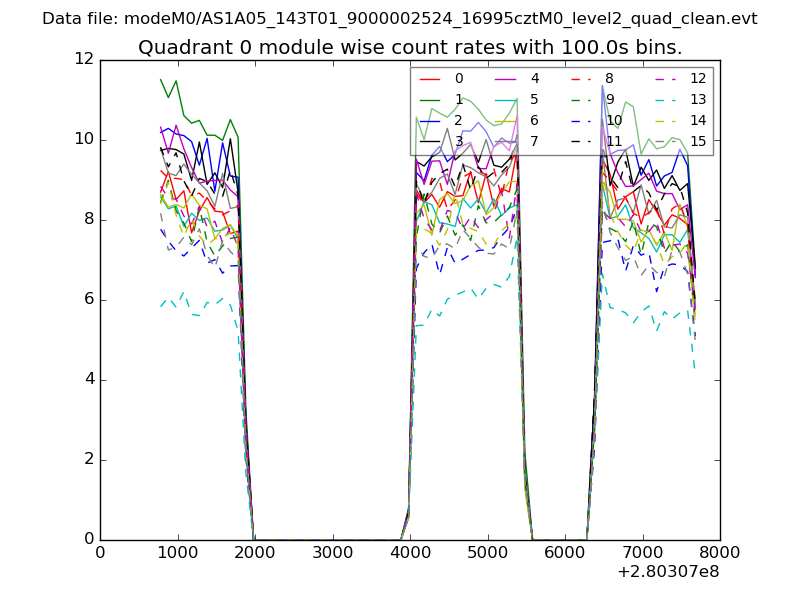 |
 |
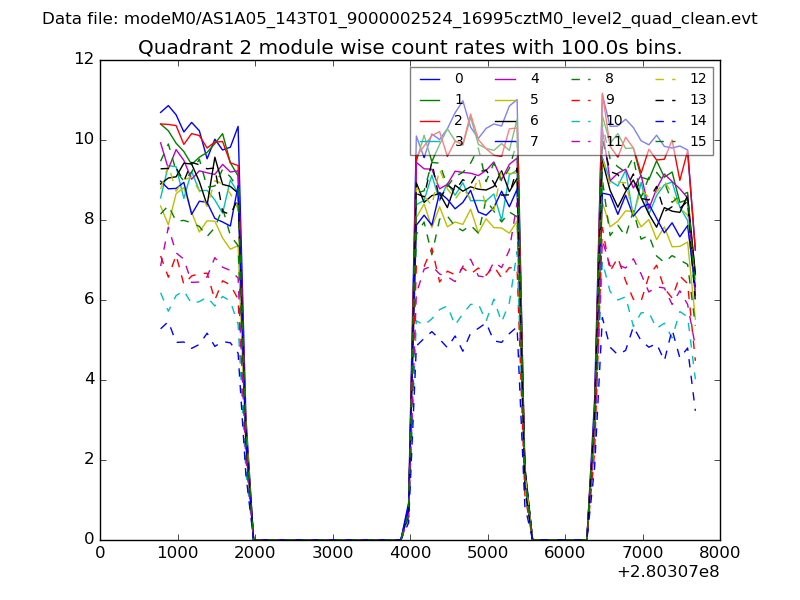
| Module-wise count rates for Quadrant B Data is divided into 100 sec bins |
 |
 |
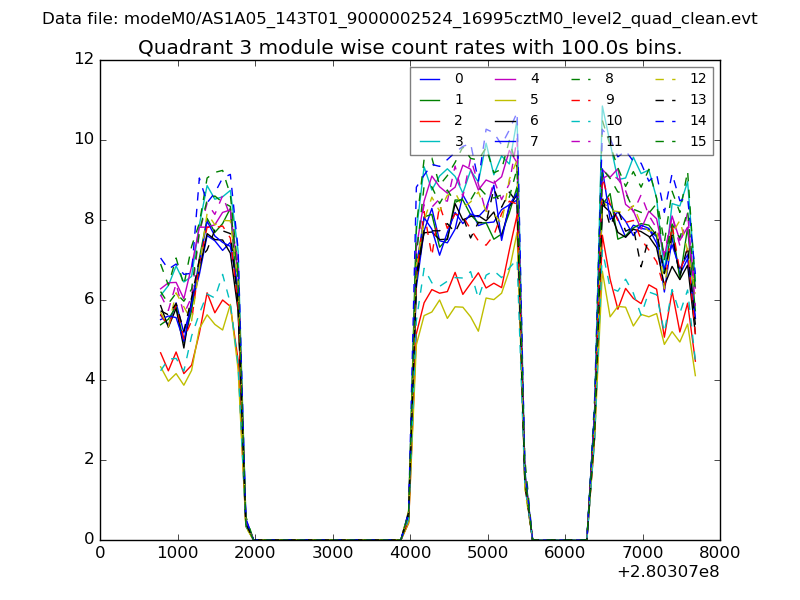
| Module-wise count rates for Quadrant C Data is divided into 100 sec bins |
 |
 |
| Module-wise count rates for Quadrant D Data is divided into 100 sec bins |
 |
 |
| Parameter | Plot |
|---|---|
| CZT HV Monitor | 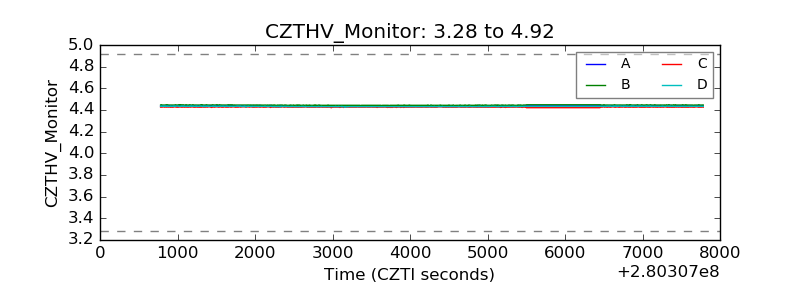 |
| D_VDD | 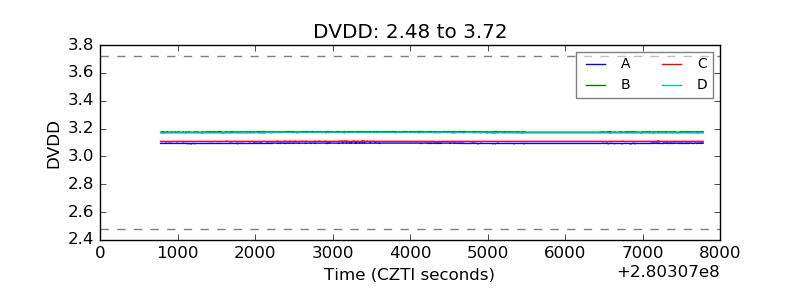 |
| Temperature 1 | 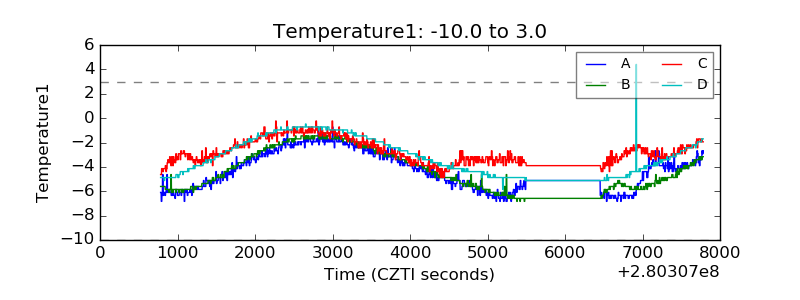 |
| Veto HV Monitor |  |
| Veto LLD | 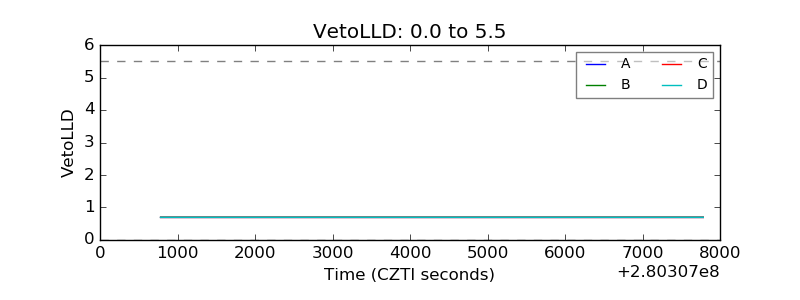 |
| Alpha Counter | 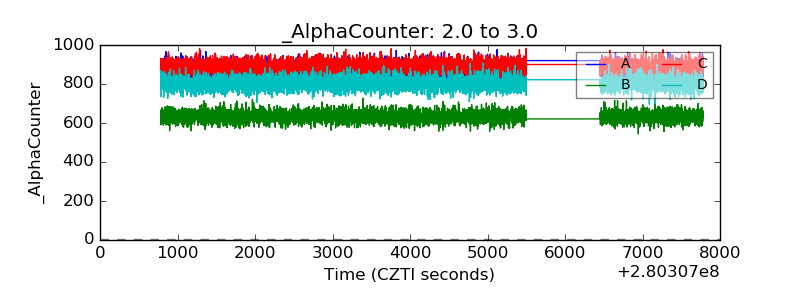 |
| _CPM_Rate | 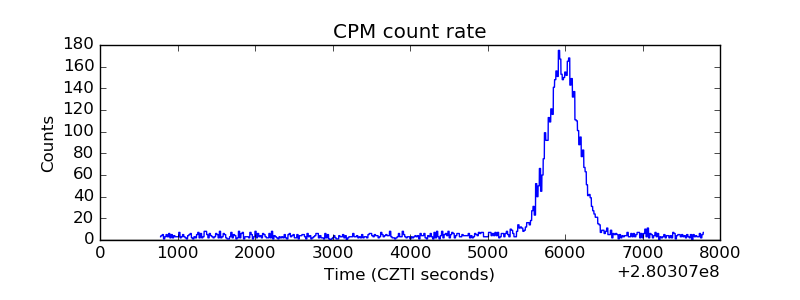 |
| CZT Counter | 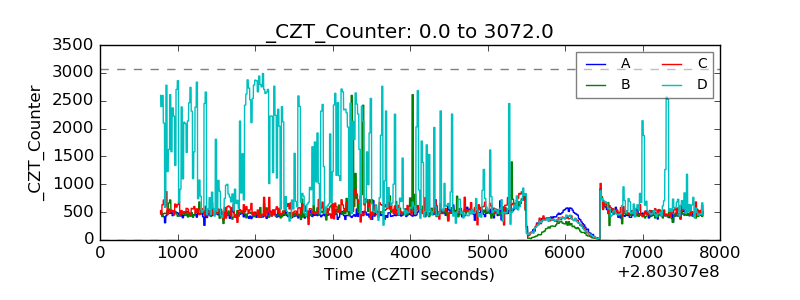 |
| +2.5 Volts monitor |  |
| +5 Volts monitor |  |
| _ROLL_ROT | 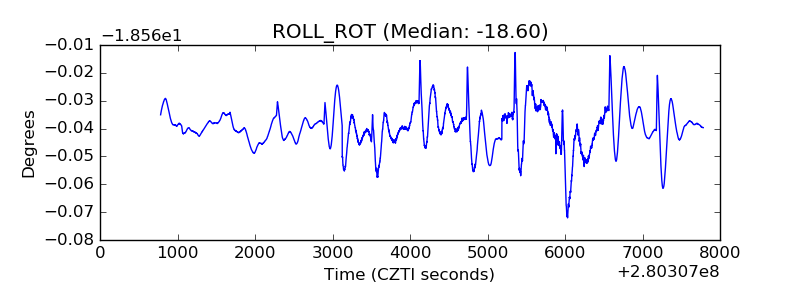 |
| _Roll_DEC | 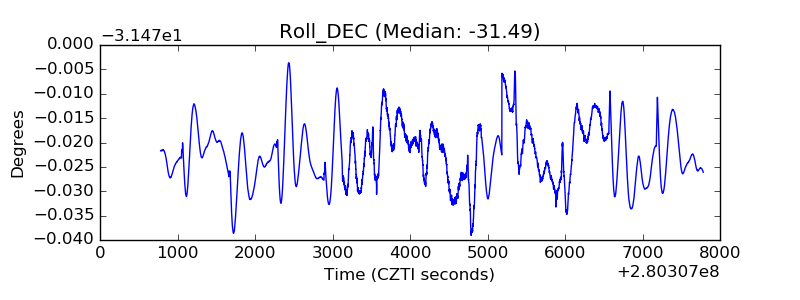 |
| _Roll_RA | 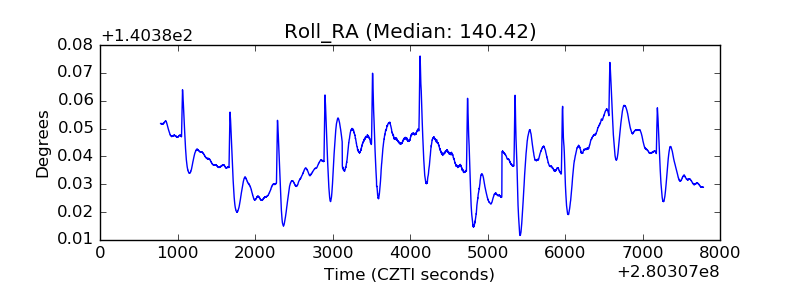 |
| Veto Counter | 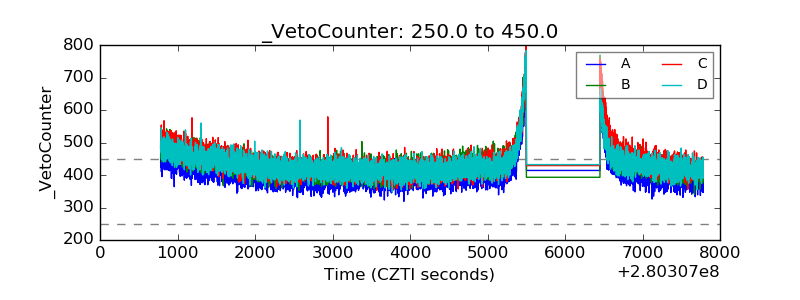 |