| Param | Original file | Final file |
|---|---|---|
| Filename | modeM0/AS1A05_143T01_9000002524_16996cztM0_level2.evt | modeM0/AS1A05_143T01_9000002524_16996cztM0_level2_quad_clean.evt |
| Size (bytes) | 527,428,800 | 92,021,760 |
| Size | 503.0 MB | 87.8 MB |
| Events in quadrant A | 3,363,765 | 578,735 |
| Events in quadrant B | 3,707,539 | 587,937 |
| Events in quadrant C | 3,840,030 | 568,048 |
| Events in quadrant D | 4,574,394 | 551,913 |
| Mode M9 | |||
|---|---|---|---|
| Quadrant | BADHDUFLAG | Total packets | Discarded packets |
| A | 0 | 5 | 0 |
| B | 0 | 5 | 0 |
| C | 0 | 5 | 0 |
| D | 0 | 5 | 0 |
| Mode SS | |||
|---|---|---|---|
| Quadrant | BADHDUFLAG | Total packets | Discarded packets |
| A | 0 | 146 | 0 |
| B | 0 | 146 | 0 |
| C | 0 | 146 | 0 |
| D | 0 | 146 | 0 |
| Mode M0 | |||
|---|---|---|---|
| Quadrant | BADHDUFLAG | Total packets | Discarded packets |
| A | 0 | 14724 | 2 |
| B | 0 | 15499 | 2 |
| C | 0 | 15829 | 4 |
| D | 0 | 18197 | 2 |
| Quadrant | Total seconds | Saturated seconds | Saturation percentage |
|---|---|---|---|
| A | 7178 | 116 | 1.616049% |
| B | 7179 | 132 | 1.838696% |
| C | 7178 | 137 | 1.908610% |
| D | 7178 | 231 | 3.218167% |
Noise dominated data is calculated using 1-second bins in cleaned event files. If a bin has >2000 counts, and if more than 50% of those come from <1% of pixels, then it is considered to be noise-dominated and hence unusable.
| Quadrant | # 1 sec bins | Bins with >0 counts | Bins with >2000 counts | High rate bins dominated by noise | Noise dominated (total time) | Noise dominated (detector-on time) | Marked lightcurve |
|---|---|---|---|---|---|---|---|
| A | 7689 | 7180 | 0 | 0 | 0.00% | 0.00% | 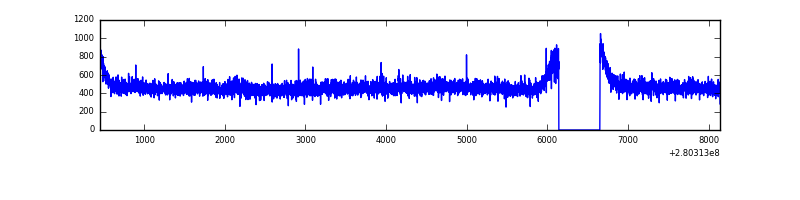 |
| B | 7690 | 7181 | 9 | 9 | 0.12% | 0.13% | 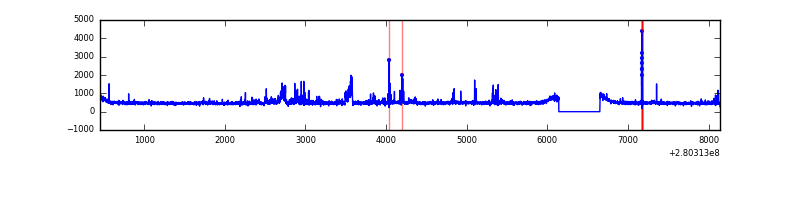 |
| C | 7689 | 7180 | 0 | 0 | 0.00% | 0.00% | 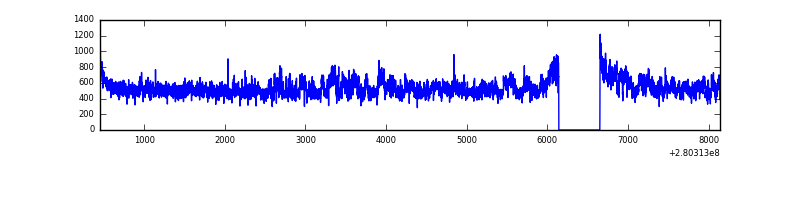 |
| D | 7689 | 7180 | 111 | 111 | 1.44% | 1.55% | 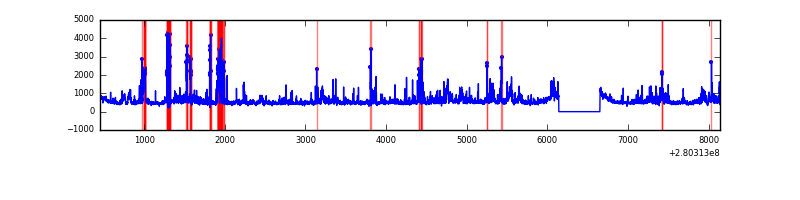 |
Top three noisy pixels from each quadrant. If the there are fewer than three noisy pixels in the level2.evt file, extra rows are filled as -1
| Pixel properties | Quadrant properties | ||||||
|---|---|---|---|---|---|---|---|
| Quadrant | DetID | PixID | Counts | Sigma | Mean | Median | Sigma |
| A | 15 | 174 | 8006 | 40.72 | 871 | 850 | 175.7 |
| A | 0 | 226 | 7697 | 38.97 | 871 | 850 | 175.7 |
| A | 12 | 189 | 6952 | 34.73 | 871 | 850 | 175.7 |
| B | 15 | 35 | 114650 | 677.4 | 869 | 845 | 168.0 |
| B | 3 | 64 | 57061 | 334.62 | 869 | 845 | 168.0 |
| B | 0 | 229 | 49760 | 291.16 | 869 | 845 | 168.0 |
| C | 3 | 233 | 410765 | 2059.56 | 845 | 850 | 199.0 |
| C | 14 | 238 | 128164 | 639.67 | 845 | 850 | 199.0 |
| C | 13 | 61 | 6044 | 26.1 | 845 | 850 | 199.0 |
| D | 1 | 52 | 1051084 | 5061.07 | 852 | 828 | 207.5 |
| D | 2 | 152 | 112499 | 538.13 | 852 | 828 | 207.5 |
| D | 12 | 110 | 87975 | 419.95 | 852 | 828 | 207.5 |
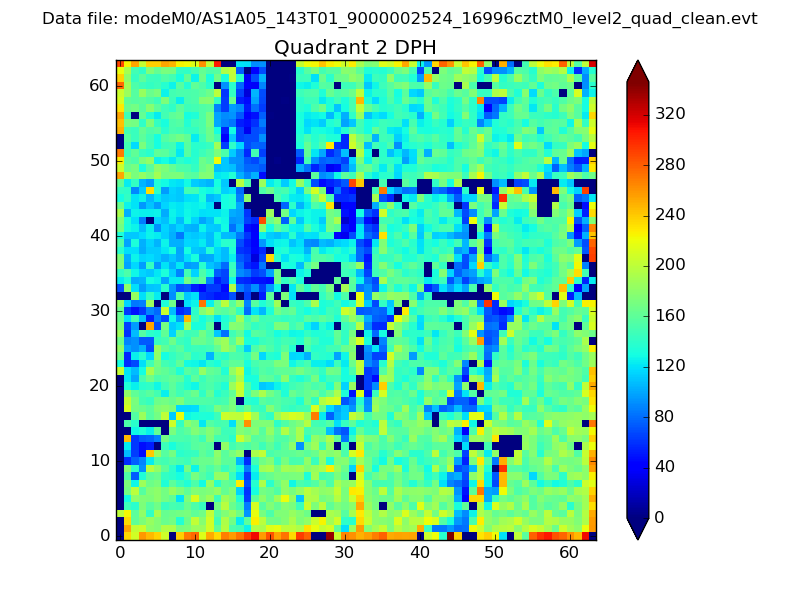
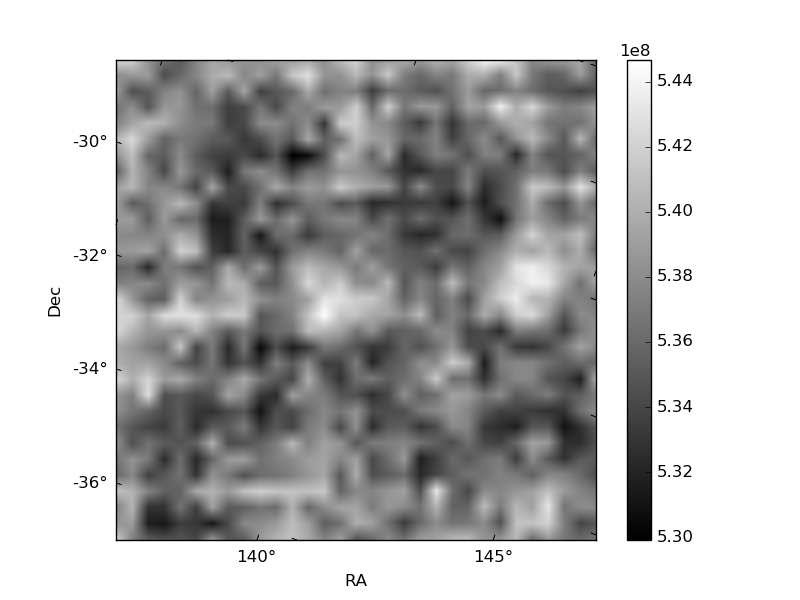
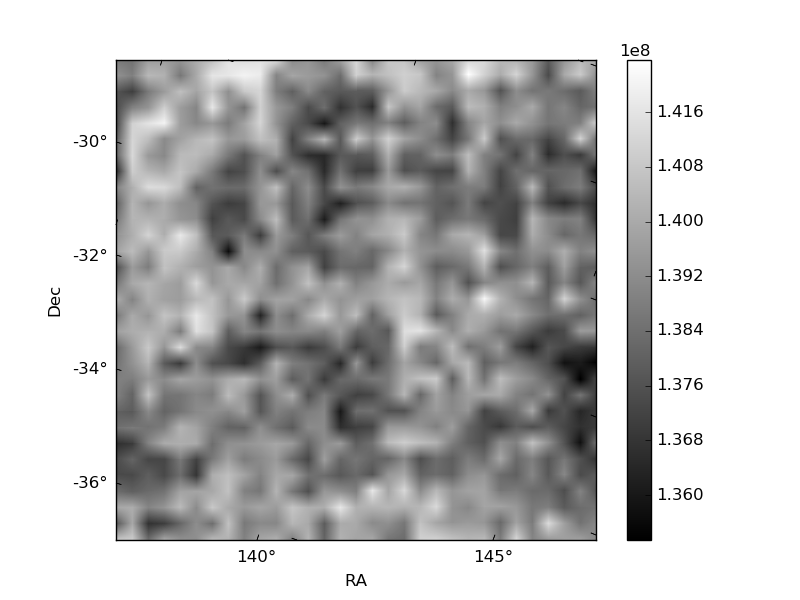
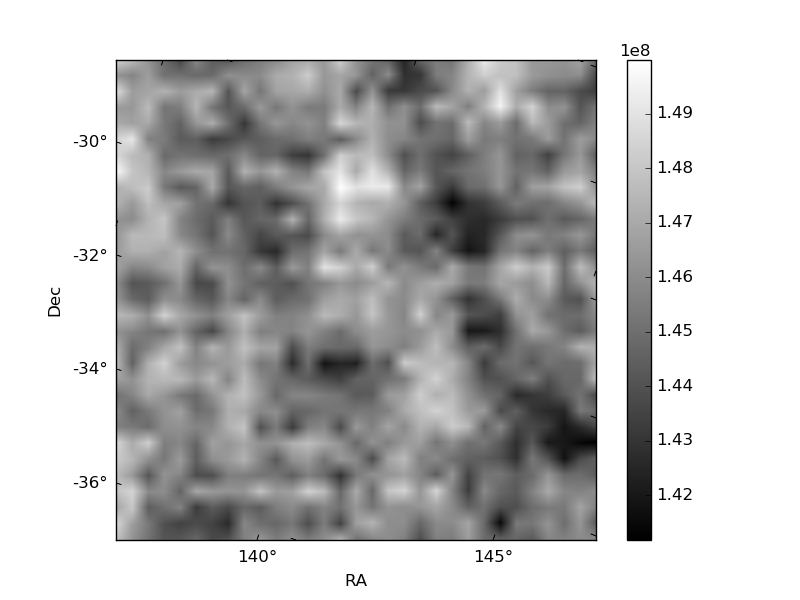
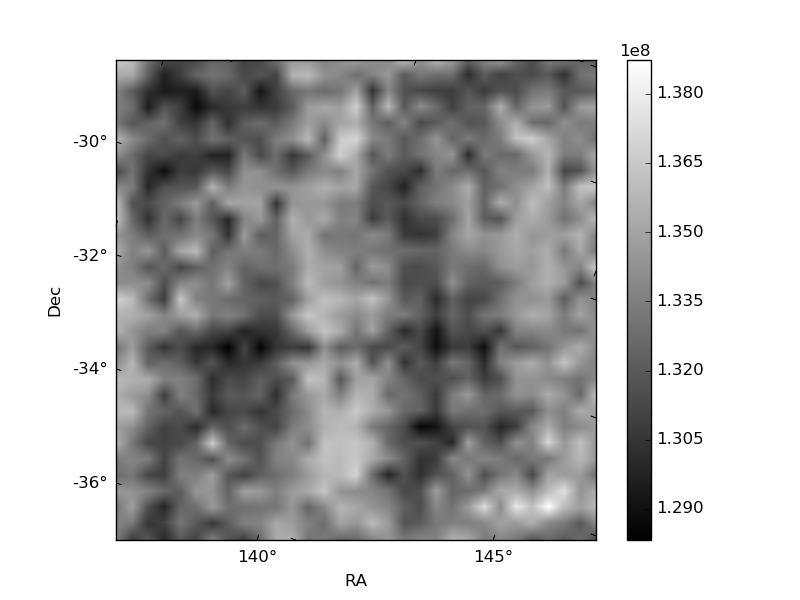
Histogram calculated using DETX and DETY for each event in the final _common_clean file
| Quadrant A | 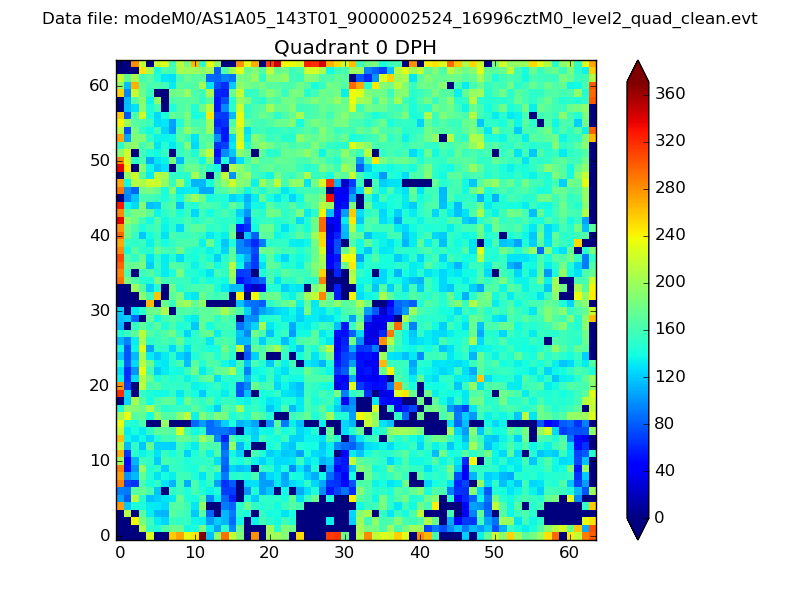 |
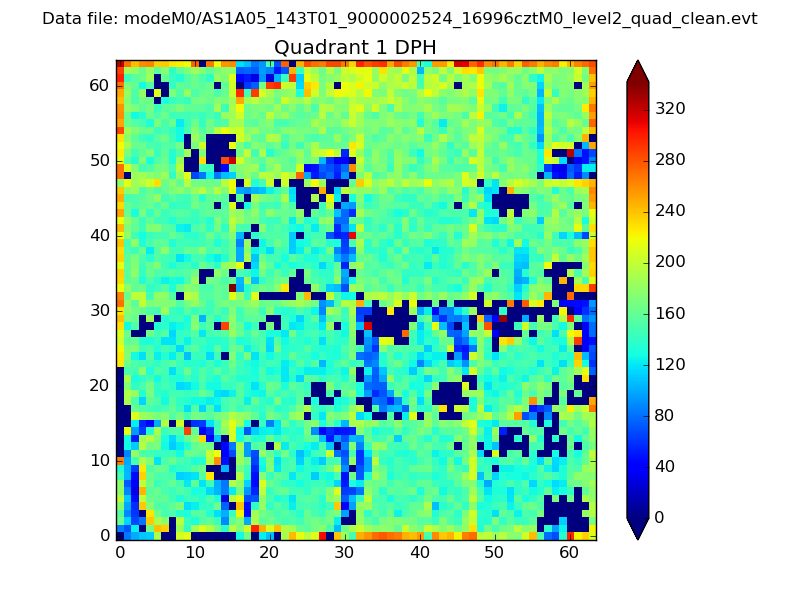 |
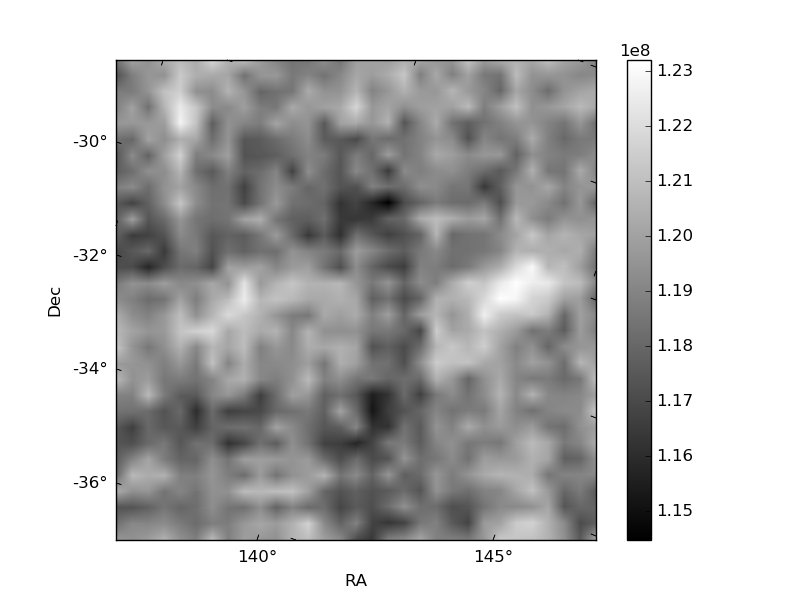
Quadrant B |
|---|---|---|---|
| Quadrant D | 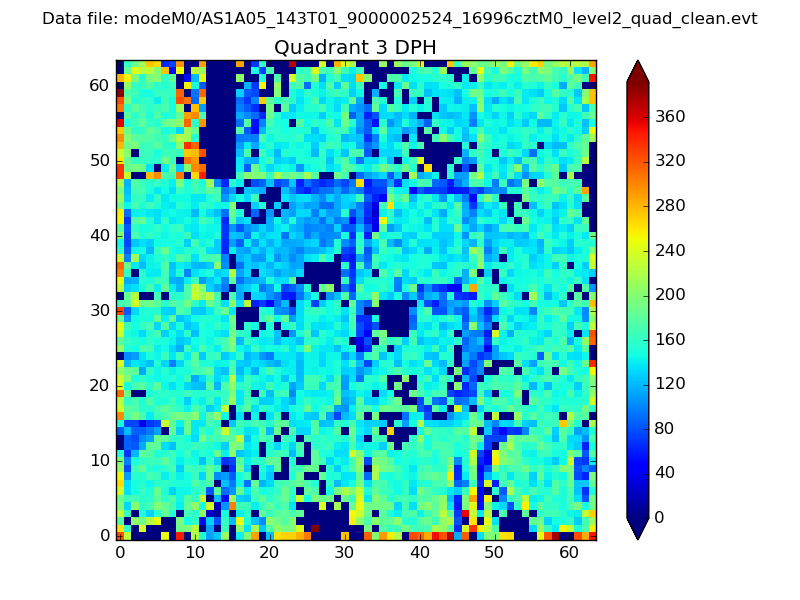 |
 |
Quadrant C |
| Plot type | Count rate plots | Images |
|---|---|---|
| Comparison with Poisson distribution Blue bars denote a histogram of data divided into 1 sec bins. Red curve is a Poisson curve with rate = median count rate of data. |
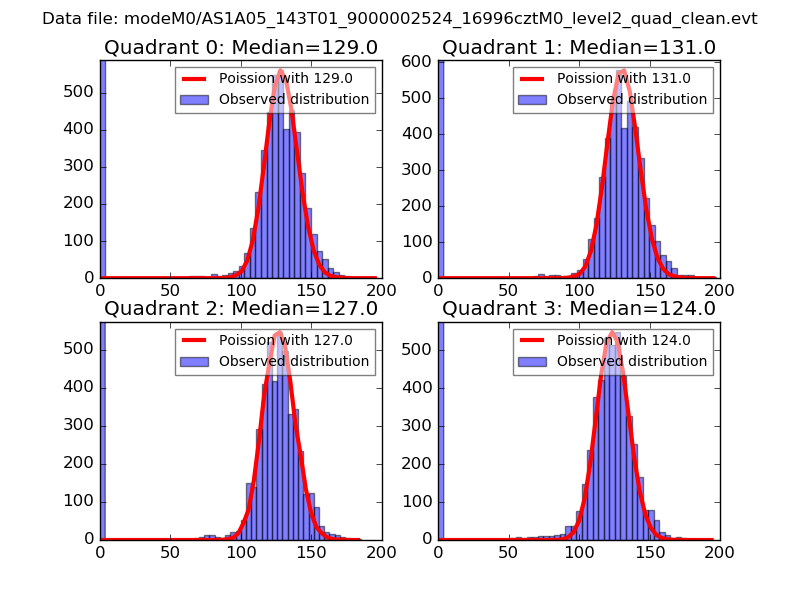 |
 |
| Quadrant-wise count rates Data is divided into 100 sec bins |
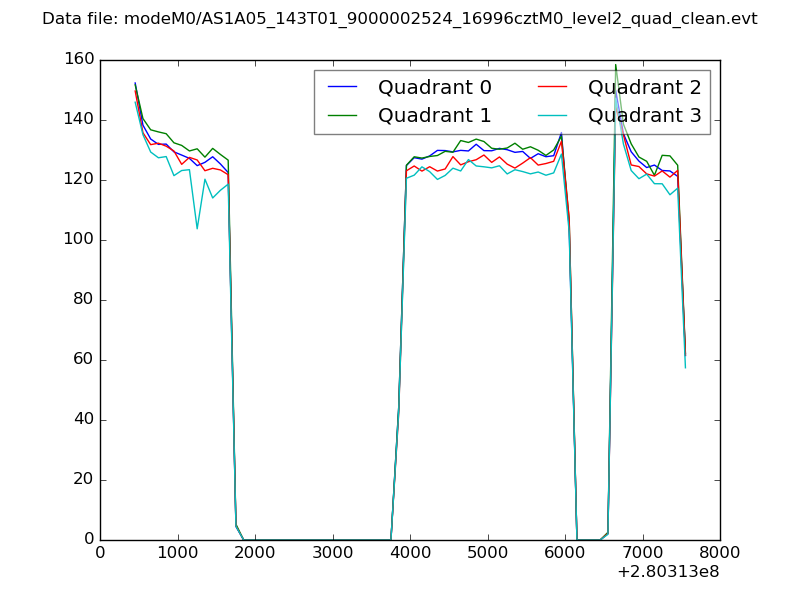 |
|
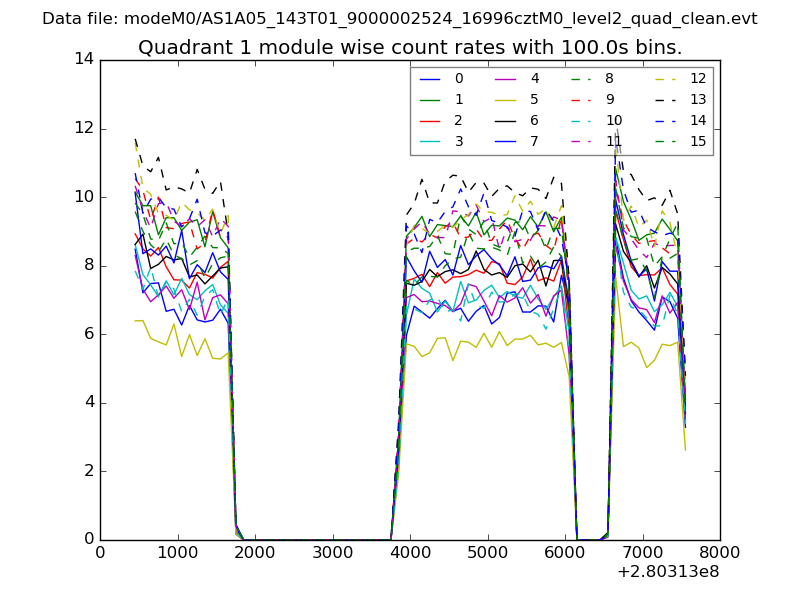
| Module-wise count rates for Quadrant A Data is divided into 100 sec bins |
 |
 |
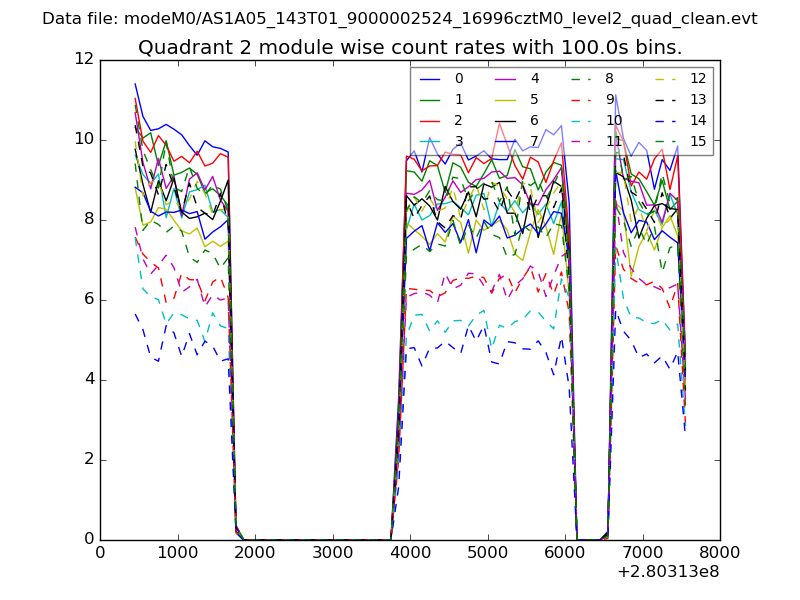
| Module-wise count rates for Quadrant B Data is divided into 100 sec bins |
 |
 |
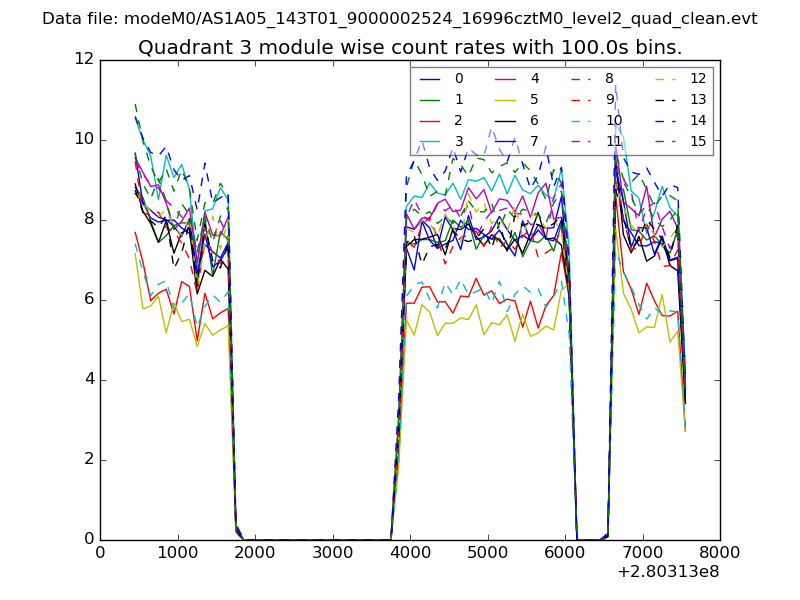
| Module-wise count rates for Quadrant C Data is divided into 100 sec bins |
 |
 |
| Module-wise count rates for Quadrant D Data is divided into 100 sec bins |
 |
 |
| Parameter | Plot |
|---|---|
| CZT HV Monitor | 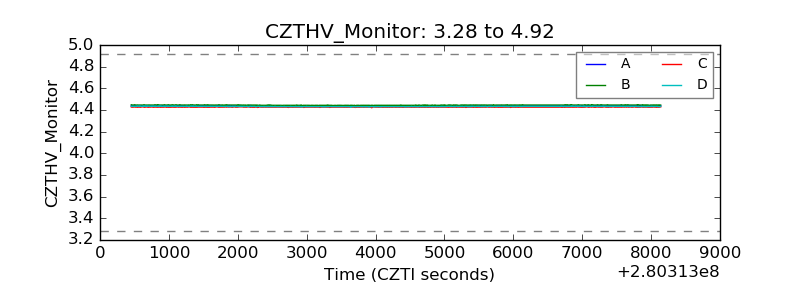 |
| D_VDD | 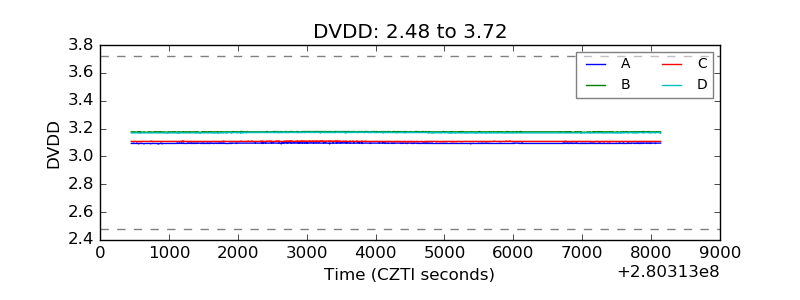 |
| Temperature 1 |  |
| Veto HV Monitor | 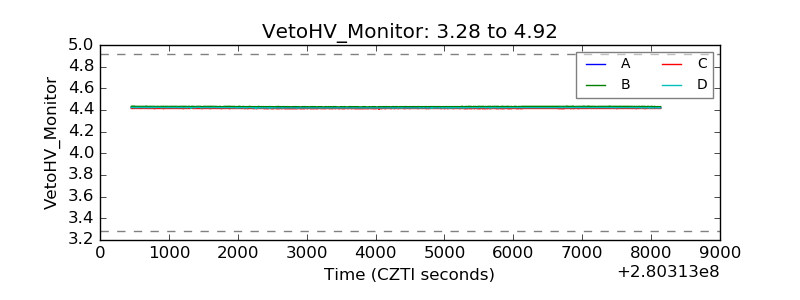 |
| Veto LLD | 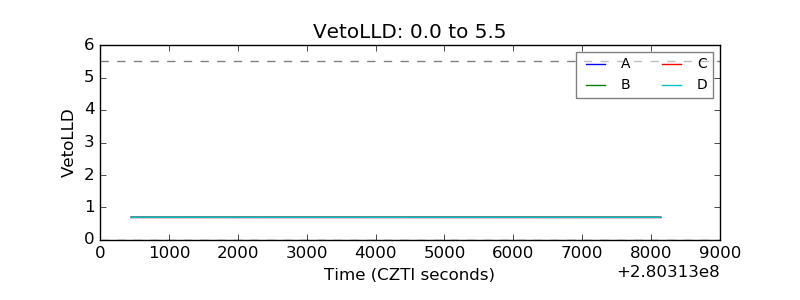 |
| Alpha Counter | 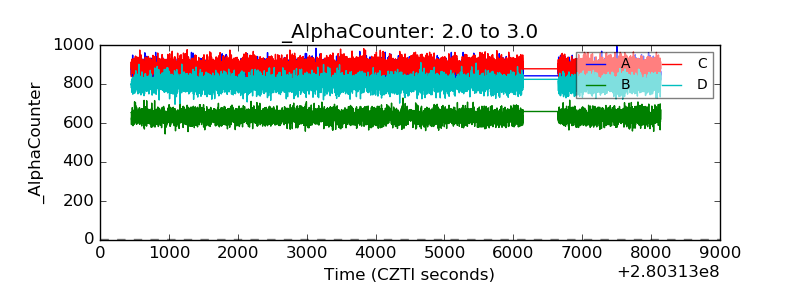 |
| _CPM_Rate | 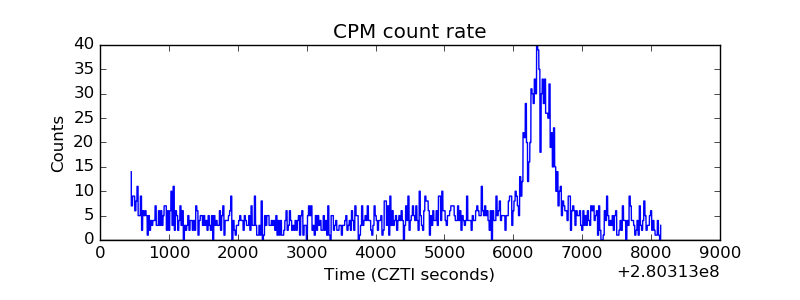 |
| CZT Counter | 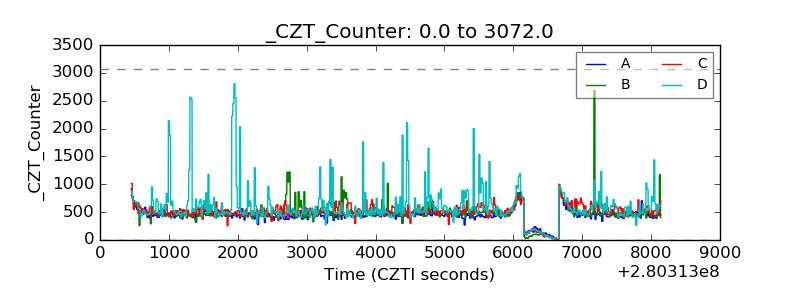 |
| +2.5 Volts monitor |  |
| +5 Volts monitor |  |
| _ROLL_ROT | 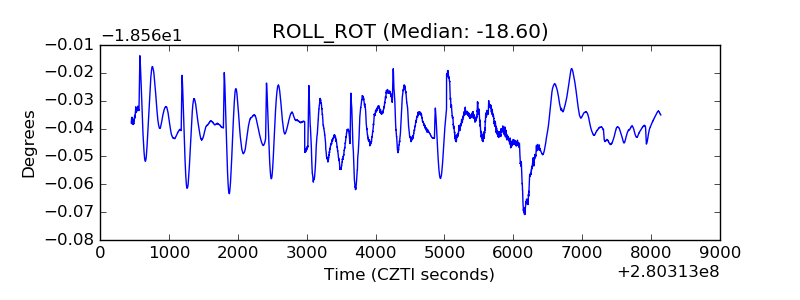 |
| _Roll_DEC |  |
| _Roll_RA | 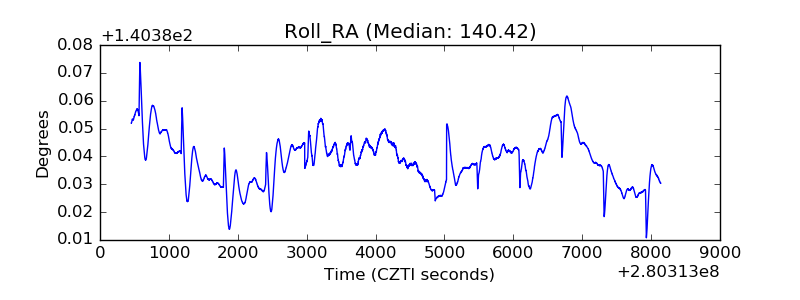 |
| Veto Counter | 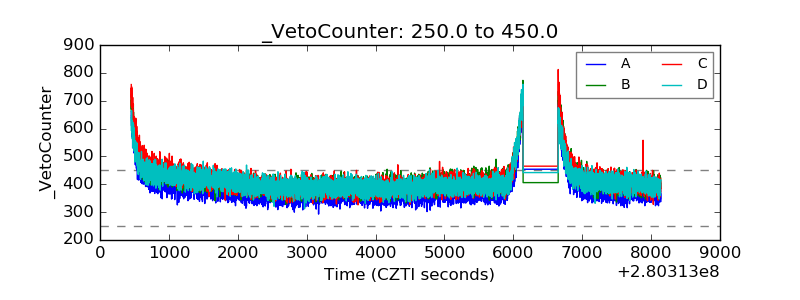 |