| Param | Original file | Final file |
|---|---|---|
| Filename | modeM0/AS1A05_143T01_9000002524_16997cztM0_level2.evt | modeM0/AS1A05_143T01_9000002524_16997cztM0_level2_quad_clean.evt |
| Size (bytes) | 670,671,360 | 87,344,640 |
| Size | 639.6 MB | 83.3 MB |
| Events in quadrant A | 3,742,725 | 549,047 |
| Events in quadrant B | 4,520,564 | 552,077 |
| Events in quadrant C | 4,302,502 | 537,367 |
| Events in quadrant D | 7,219,497 | 465,659 |
| Mode M9 | |||
|---|---|---|---|
| Quadrant | BADHDUFLAG | Total packets | Discarded packets |
| A | 0 | 1 | 0 |
| B | 0 | 1 | 0 |
| C | 0 | 1 | 0 |
| D | 0 | 1 | 0 |
| Mode SS | |||
|---|---|---|---|
| Quadrant | BADHDUFLAG | Total packets | Discarded packets |
| A | 0 | 156 | 0 |
| B | 0 | 156 | 0 |
| C | 0 | 156 | 0 |
| D | 0 | 156 | 0 |
| Mode M0 | |||
|---|---|---|---|
| Quadrant | BADHDUFLAG | Total packets | Discarded packets |
| A | 0 | 16312 | 1 |
| B | 0 | 18400 | 1 |
| C | 0 | 17801 | 1 |
| D | 0 | 26765 | 2 |
| Quadrant | Total seconds | Saturated seconds | Saturation percentage |
|---|---|---|---|
| A | 7769 | 256 | 3.295147% |
| B | 7769 | 411 | 5.290256% |
| C | 7769 | 281 | 3.616939% |
| D | 7769 | 1129 | 14.532115% |
Noise dominated data is calculated using 1-second bins in cleaned event files. If a bin has >2000 counts, and if more than 50% of those come from <1% of pixels, then it is considered to be noise-dominated and hence unusable.
| Quadrant | # 1 sec bins | Bins with >0 counts | Bins with >2000 counts | High rate bins dominated by noise | Noise dominated (total time) | Noise dominated (detector-on time) | Marked lightcurve |
|---|---|---|---|---|---|---|---|
| A | 7830 | 7771 | 1 | 1 | 0.01% | 0.01% | 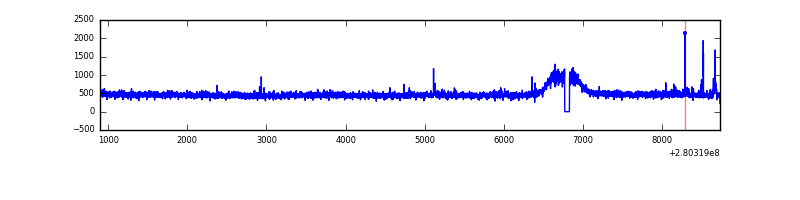 |
| B | 7830 | 7771 | 95 | 95 | 1.21% | 1.22% | 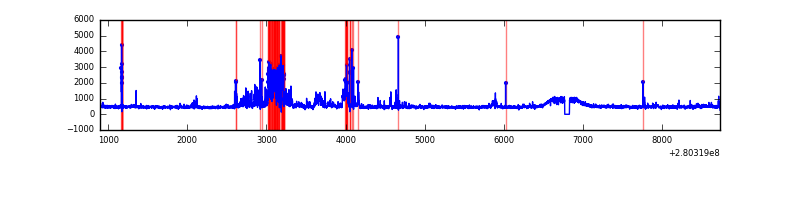 |
| C | 7830 | 7771 | 0 | 0 | 0.00% | 0.00% | 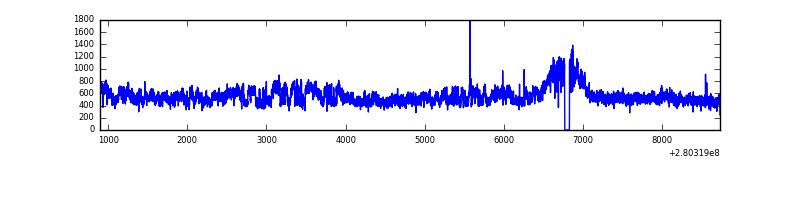 |
| D | 7830 | 7771 | 806 | 806 | 10.29% | 10.37% | 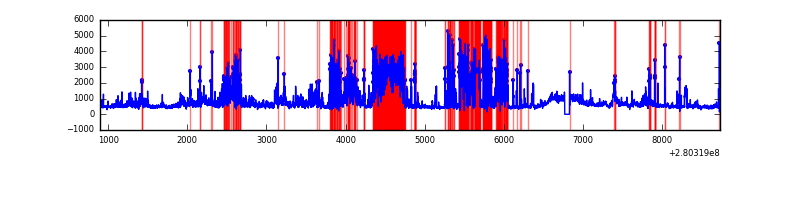 |
Top three noisy pixels from each quadrant. If the there are fewer than three noisy pixels in the level2.evt file, extra rows are filled as -1
| Pixel properties | Quadrant properties | ||||||
|---|---|---|---|---|---|---|---|
| Quadrant | DetID | PixID | Counts | Sigma | Mean | Median | Sigma |
| A | 12 | 189 | 35291 | 176.02 | 958 | 933 | 195.2 |
| A | 15 | 174 | 24344 | 119.94 | 958 | 933 | 195.2 |
| A | 0 | 226 | 8306 | 37.77 | 958 | 933 | 195.2 |
| B | 3 | 64 | 446715 | 2411.58 | 946 | 920 | 184.9 |
| B | 15 | 35 | 179410 | 965.56 | 946 | 920 | 184.9 |
| B | 7 | 220 | 62530 | 333.29 | 946 | 920 | 184.9 |
| C | 3 | 233 | 550366 | 2505.37 | 922 | 926 | 219.3 |
| C | 14 | 238 | 138786 | 628.62 | 922 | 926 | 219.3 |
| C | 9 | 54 | 7629 | 30.56 | 922 | 926 | 219.3 |
| D | 1 | 52 | 3692700 | 16985.74 | 890 | 866 | 217.3 |
| D | 12 | 110 | 51572 | 233.29 | 890 | 866 | 217.3 |
| D | 2 | 152 | 41804 | 188.35 | 890 | 866 | 217.3 |
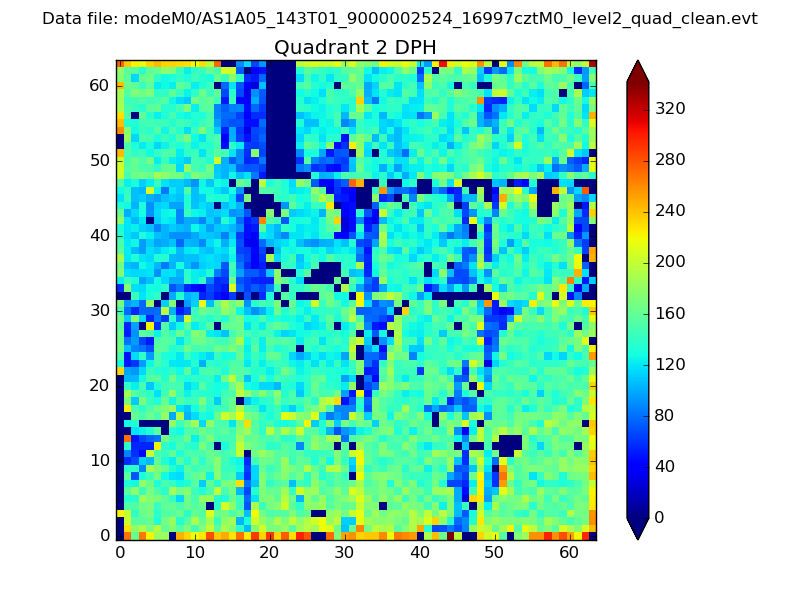
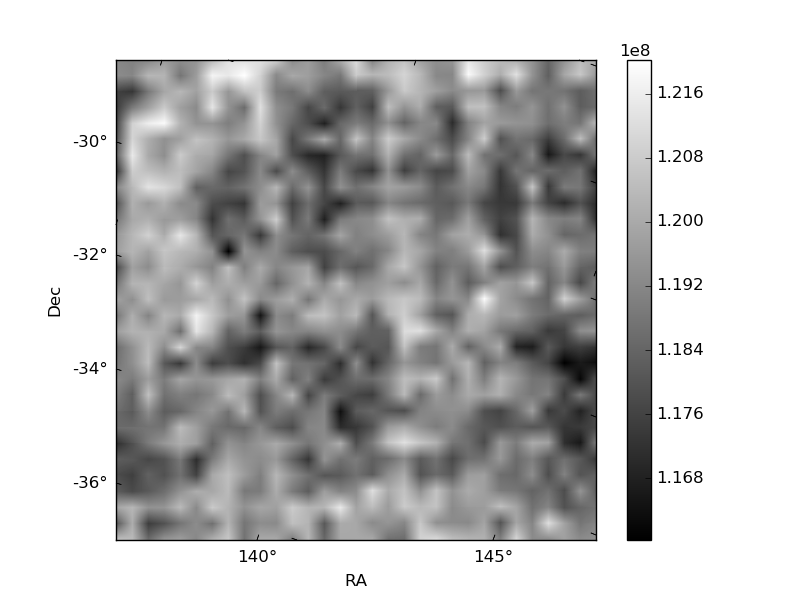
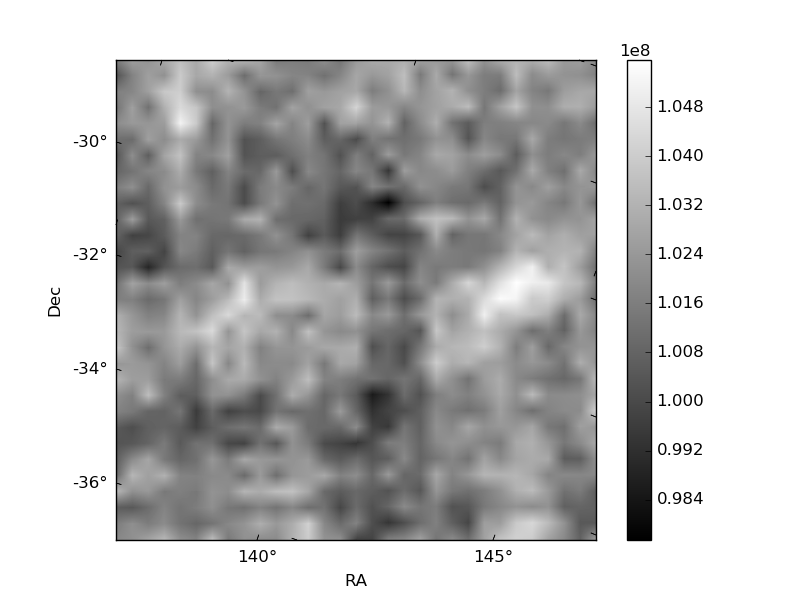
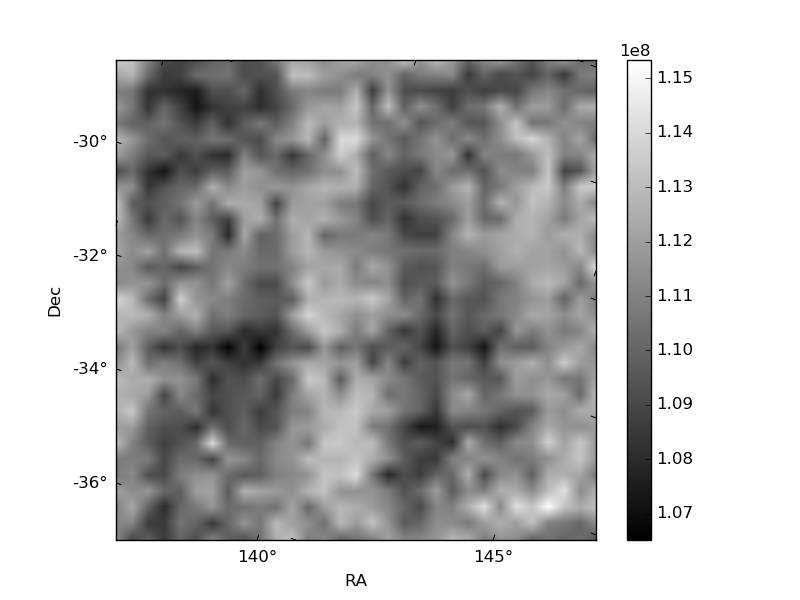
Histogram calculated using DETX and DETY for each event in the final _common_clean file
| Quadrant A | 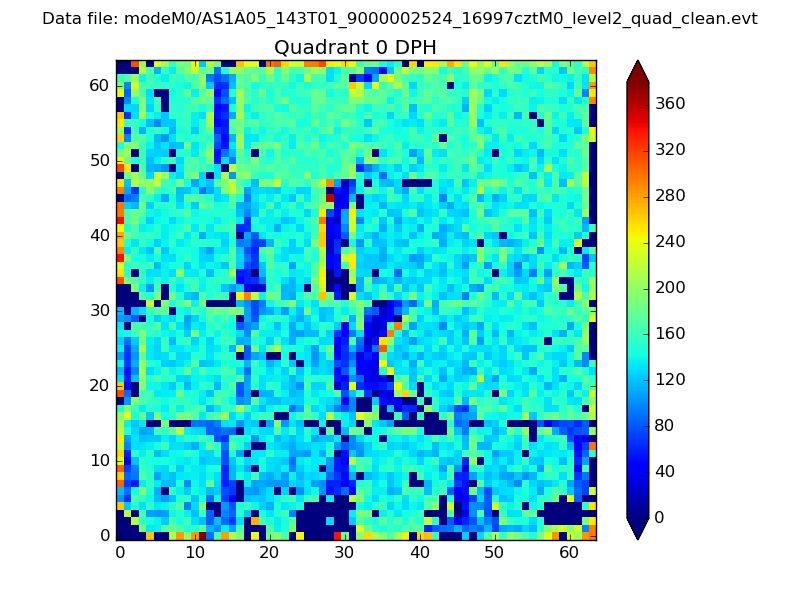 |
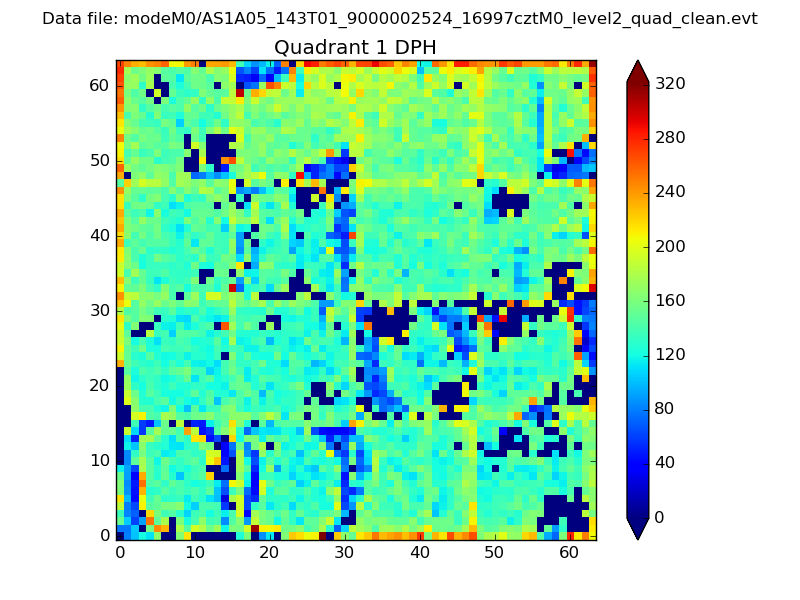 |
Quadrant B |
|---|---|---|---|
| Quadrant D | 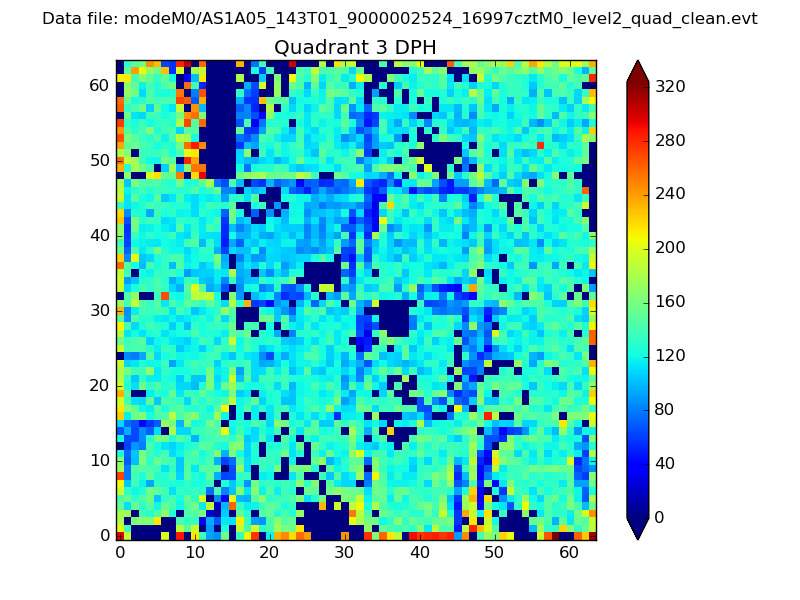 |
 |
Quadrant C |
| Plot type | Count rate plots | Images |
|---|---|---|
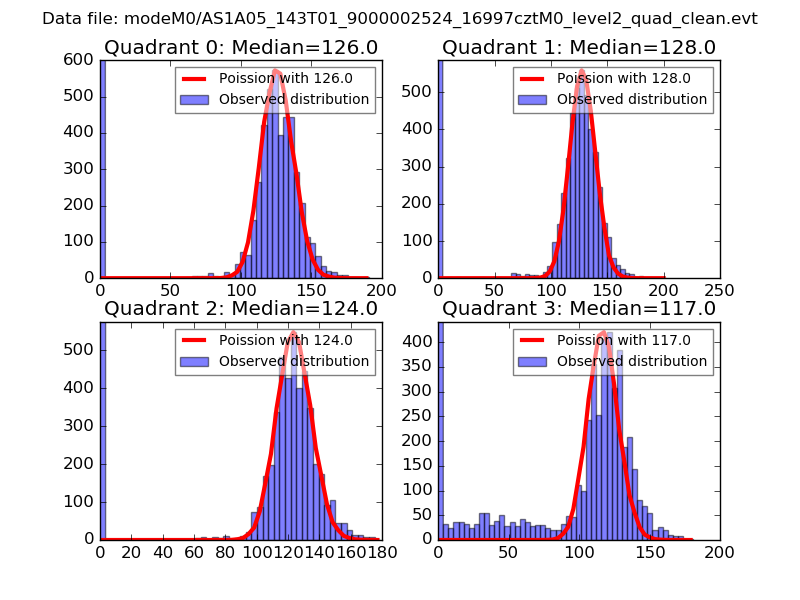
| Comparison with Poisson distribution Blue bars denote a histogram of data divided into 1 sec bins. Red curve is a Poisson curve with rate = median count rate of data. |
 |
 |
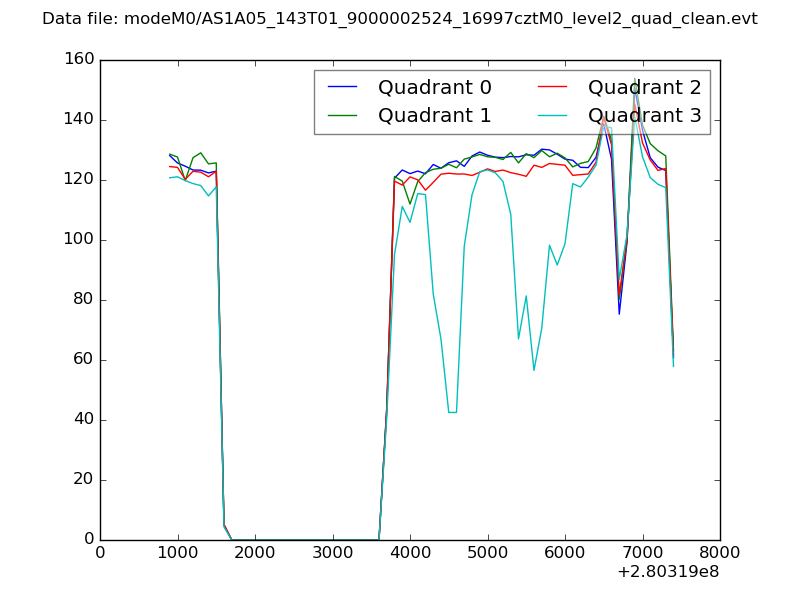
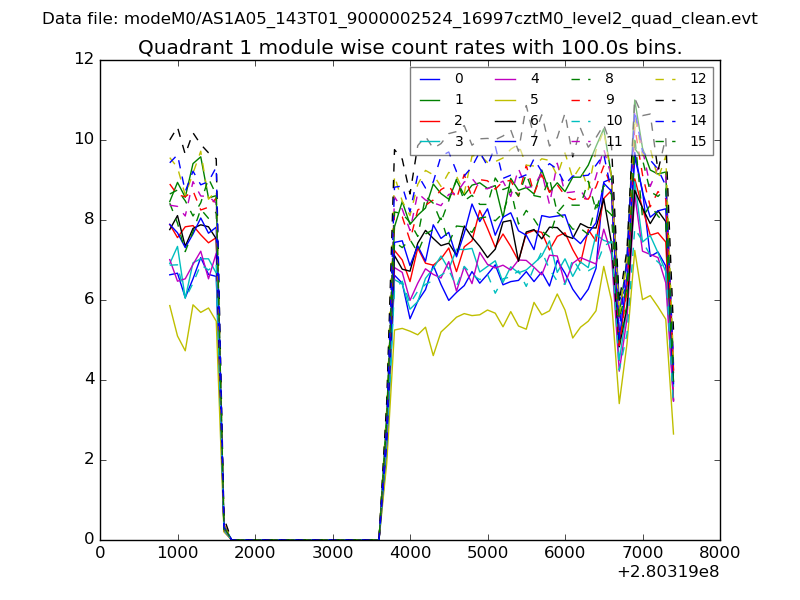
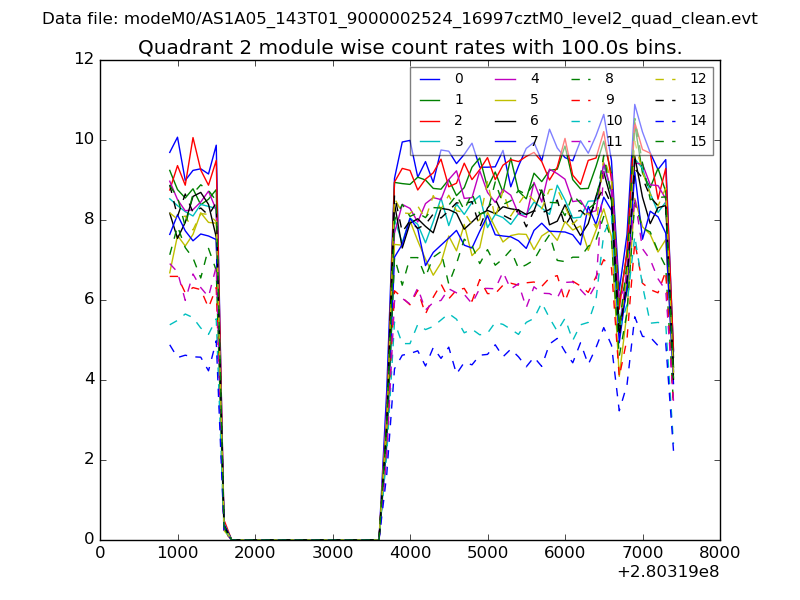
| Quadrant-wise count rates Data is divided into 100 sec bins |
 |
|
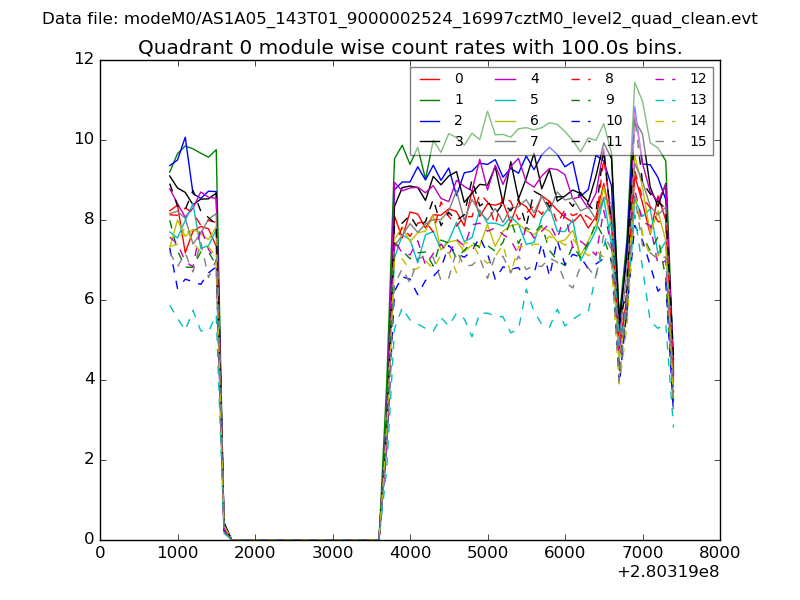
| Module-wise count rates for Quadrant A Data is divided into 100 sec bins |
 |
 |
| Module-wise count rates for Quadrant B Data is divided into 100 sec bins |
 |
 |
| Module-wise count rates for Quadrant C Data is divided into 100 sec bins |
 |
 |
| Module-wise count rates for Quadrant D Data is divided into 100 sec bins |
 |
 |
| Parameter | Plot |
|---|---|
| CZT HV Monitor | 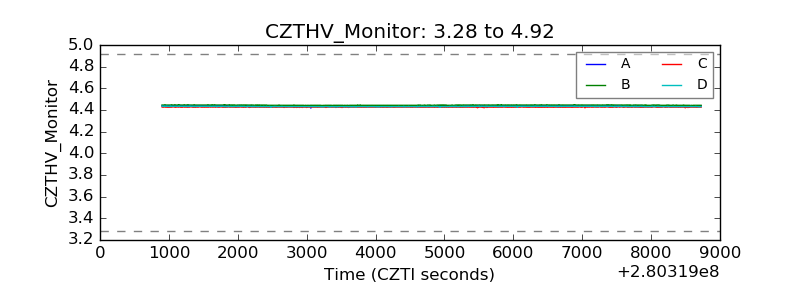 |
| D_VDD | 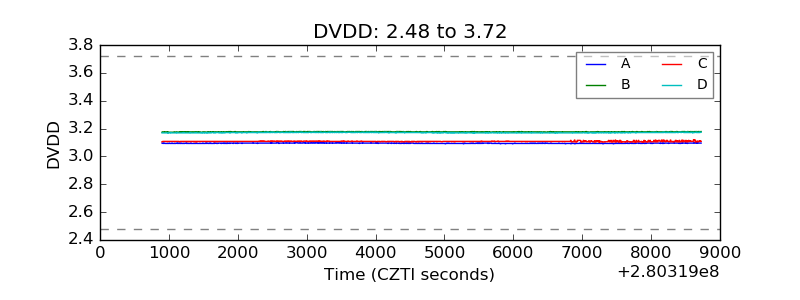 |
| Temperature 1 | 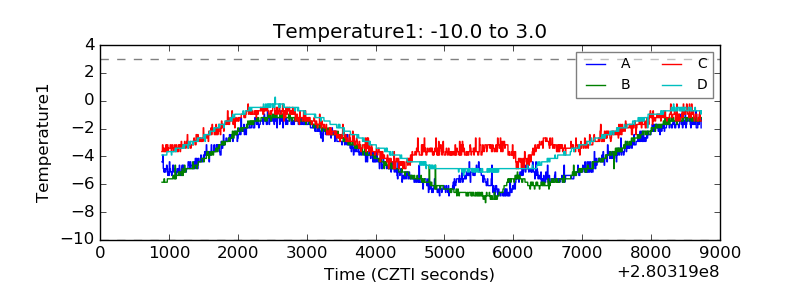 |
| Veto HV Monitor | 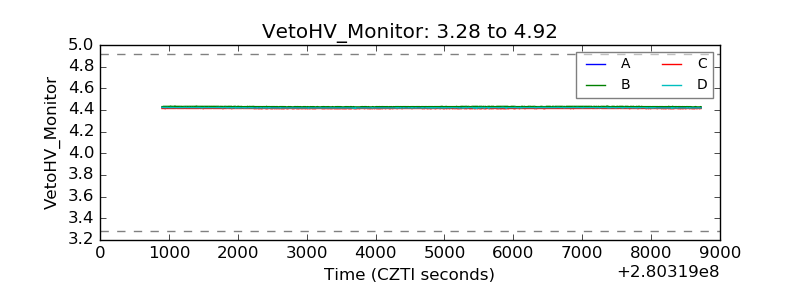 |
| Veto LLD | 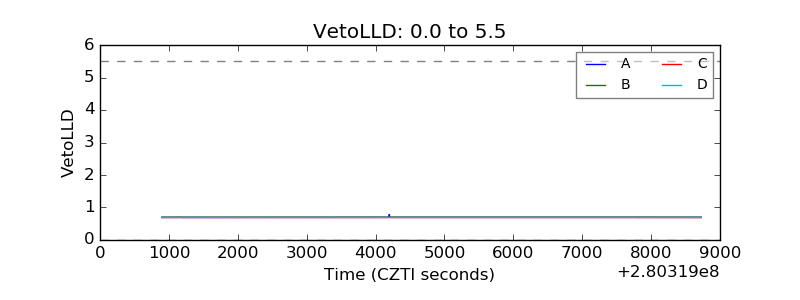 |
| Alpha Counter | 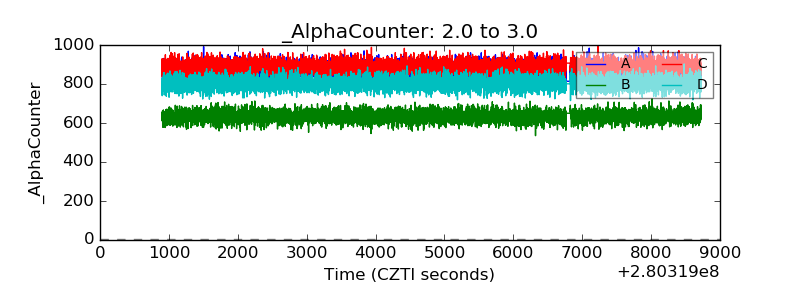 |
| _CPM_Rate | 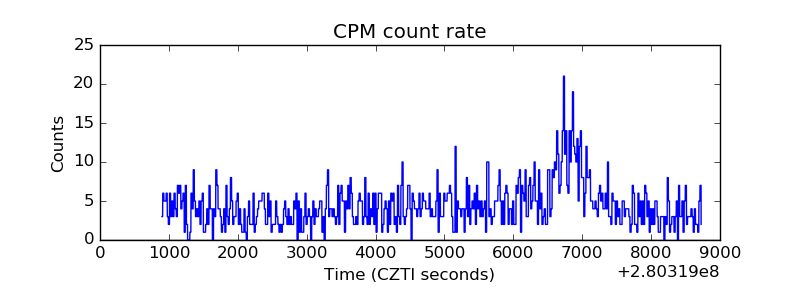 |
| CZT Counter | 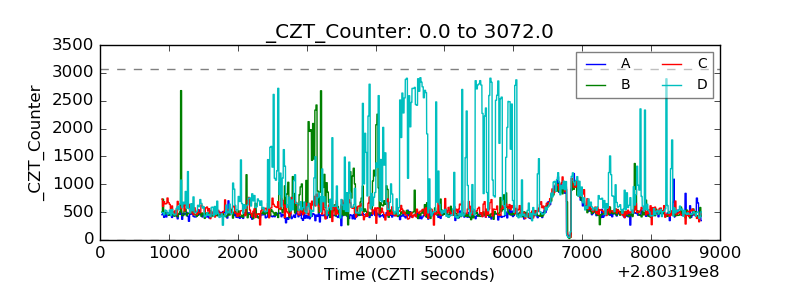 |
| +2.5 Volts monitor |  |
| +5 Volts monitor |  |
| _ROLL_ROT |  |
| _Roll_DEC |  |
| _Roll_RA | 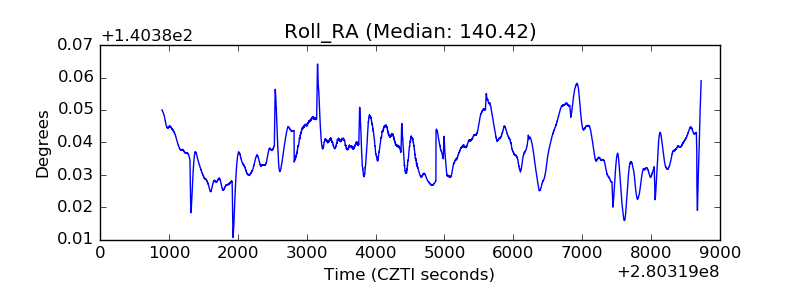 |
| Veto Counter | 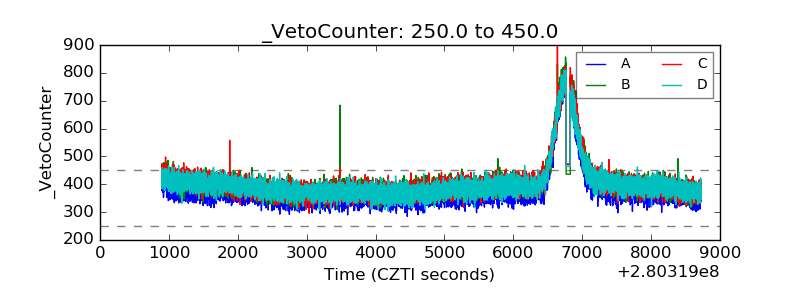 |