| Param | Original file | Final file |
|---|---|---|
| Filename | modeM0/AS1A05_143T01_9000002524_16998cztM0_level2.evt | modeM0/AS1A05_143T01_9000002524_16998cztM0_level2_quad_clean.evt |
| Size (bytes) | 557,856,000 | 82,065,600 |
| Size | 532.0 MB | 78.3 MB |
| Events in quadrant A | 3,721,283 | 492,225 |
| Events in quadrant B | 3,956,854 | 498,693 |
| Events in quadrant C | 4,097,460 | 481,133 |
| Events in quadrant D | 4,591,703 | 472,183 |
| Mode M9 | |||
|---|---|---|---|
| Quadrant | BADHDUFLAG | Total packets | Discarded packets |
| A | 0 | 1 | 0 |
| B | 0 | 1 | 0 |
| C | 0 | 1 | 0 |
| D | 0 | 1 | 0 |
| Mode SS | |||
|---|---|---|---|
| Quadrant | BADHDUFLAG | Total packets | Discarded packets |
| A | 0 | 158 | 0 |
| B | 0 | 158 | 0 |
| C | 0 | 158 | 0 |
| D | 0 | 158 | 0 |
| Mode M0 | |||
|---|---|---|---|
| Quadrant | BADHDUFLAG | Total packets | Discarded packets |
| A | 0 | 16251 | 1 |
| B | 0 | 16668 | 1 |
| C | 0 | 16981 | 1 |
| D | 0 | 18826 | 1 |
| Quadrant | Total seconds | Saturated seconds | Saturation percentage |
|---|---|---|---|
| A | 7768 | 235 | 3.025232% |
| B | 7769 | 247 | 3.179302% |
| C | 7768 | 253 | 3.256952% |
| D | 7768 | 297 | 3.823378% |
Noise dominated data is calculated using 1-second bins in cleaned event files. If a bin has >2000 counts, and if more than 50% of those come from <1% of pixels, then it is considered to be noise-dominated and hence unusable.
| Quadrant | # 1 sec bins | Bins with >0 counts | Bins with >2000 counts | High rate bins dominated by noise | Noise dominated (total time) | Noise dominated (detector-on time) | Marked lightcurve |
|---|---|---|---|---|---|---|---|
| A | 7899 | 7770 | 1 | 1 | 0.01% | 0.01% |  |
| B | 7900 | 7770 | 7 | 7 | 0.09% | 0.09% |  |
| C | 7899 | 7770 | 0 | 0 | 0.00% | 0.00% |  |
| D | 7899 | 7770 | 104 | 104 | 1.32% | 1.34% |  |
Top three noisy pixels from each quadrant. If the there are fewer than three noisy pixels in the level2.evt file, extra rows are filled as -1
| Pixel properties | Quadrant properties | ||||||
|---|---|---|---|---|---|---|---|
| Quadrant | DetID | PixID | Counts | Sigma | Mean | Median | Sigma |
| A | 12 | 189 | 35419 | 177.4 | 952 | 928 | 194.4 |
| A | 15 | 174 | 24347 | 120.45 | 952 | 928 | 194.4 |
| A | 0 | 226 | 8526 | 39.08 | 952 | 928 | 194.4 |
| B | 7 | 220 | 90795 | 488.17 | 947 | 924 | 184.1 |
| B | 0 | 197 | 36825 | 195.01 | 947 | 924 | 184.1 |
| B | 0 | 230 | 23510 | 122.68 | 947 | 924 | 184.1 |
| C | 3 | 233 | 356889 | 1639.58 | 917 | 923 | 217.1 |
| C | 14 | 238 | 139241 | 637.09 | 917 | 923 | 217.1 |
| C | 8 | 128 | 10239 | 42.91 | 917 | 923 | 217.1 |
| D | 1 | 52 | 870233 | 3809.51 | 932 | 906 | 228.2 |
| D | 12 | 110 | 89557 | 388.48 | 932 | 906 | 228.2 |
| D | 7 | 223 | 69716 | 301.53 | 932 | 906 | 228.2 |
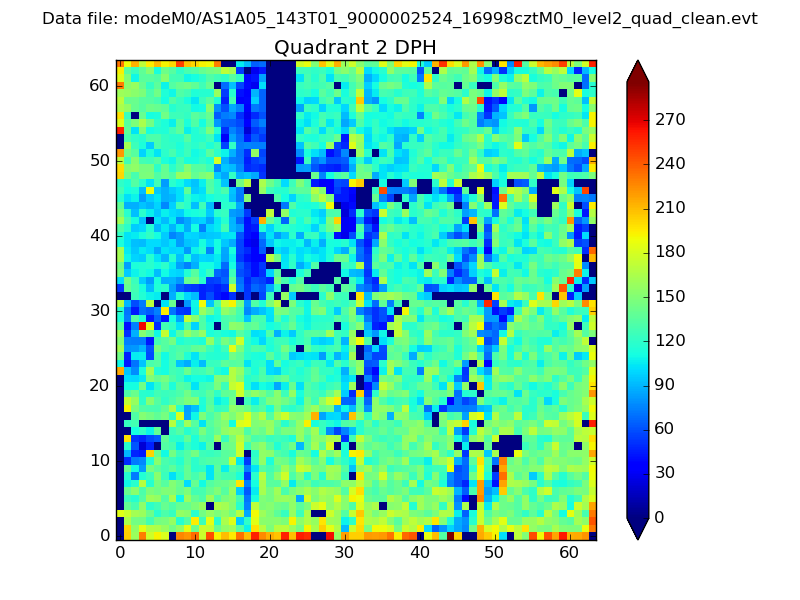
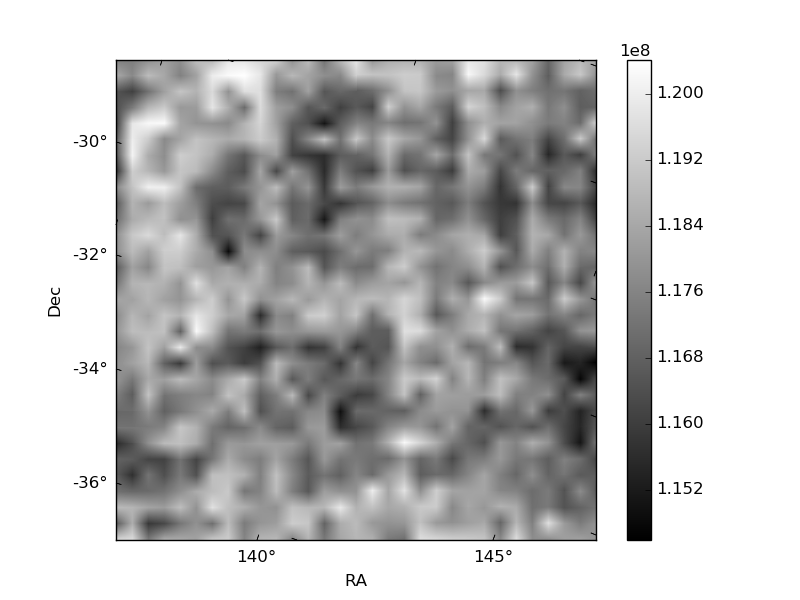
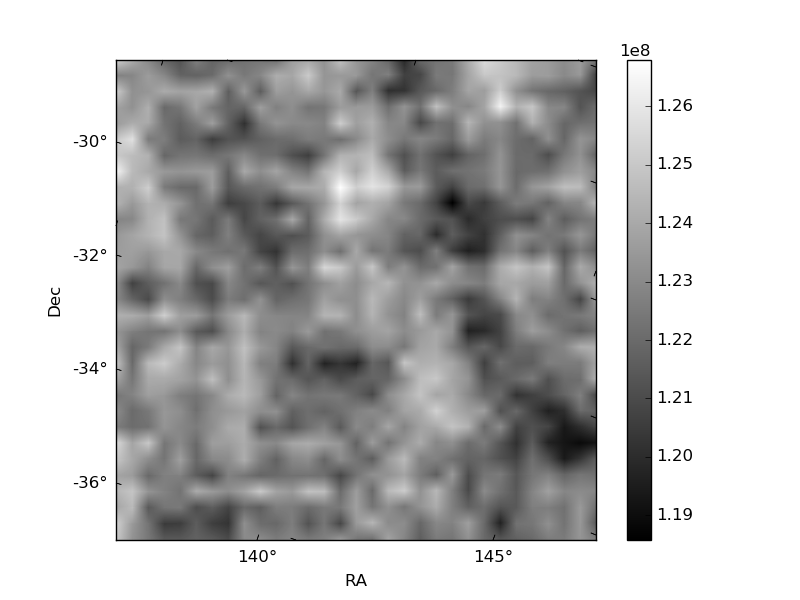
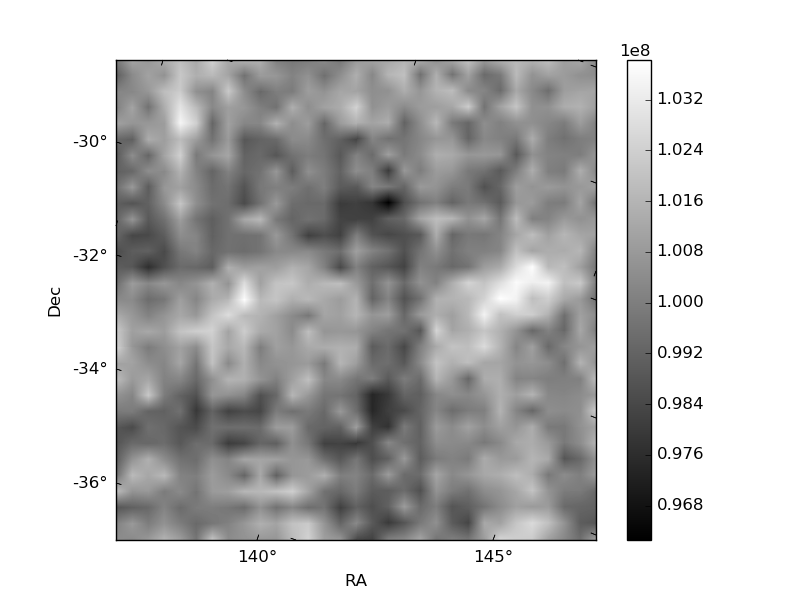
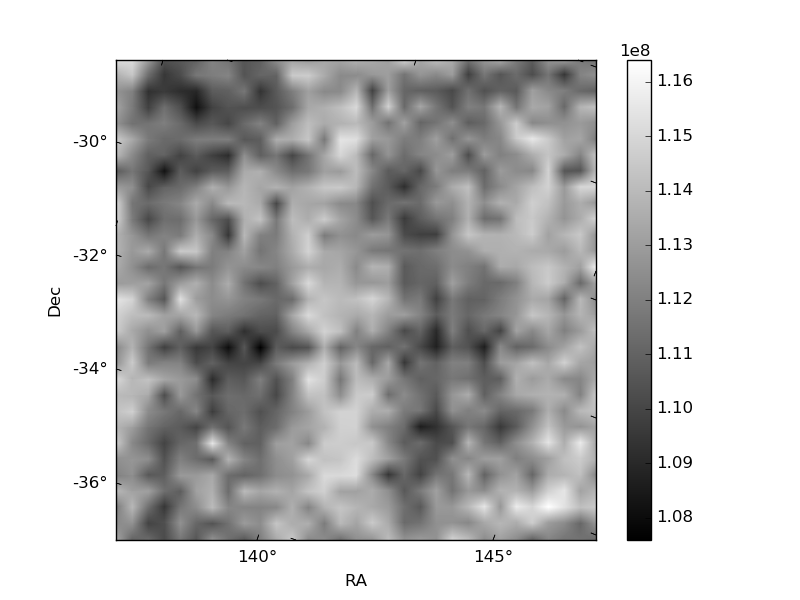
Histogram calculated using DETX and DETY for each event in the final _common_clean file
| Quadrant A | 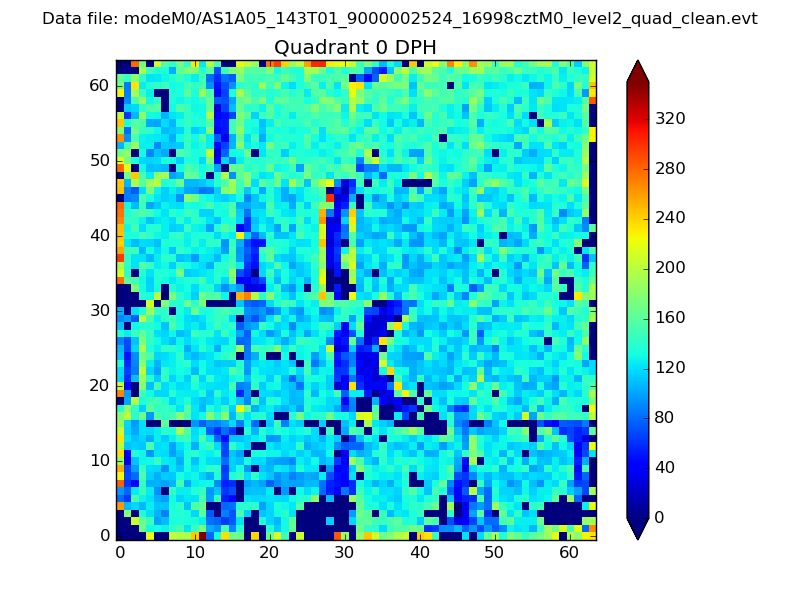 |
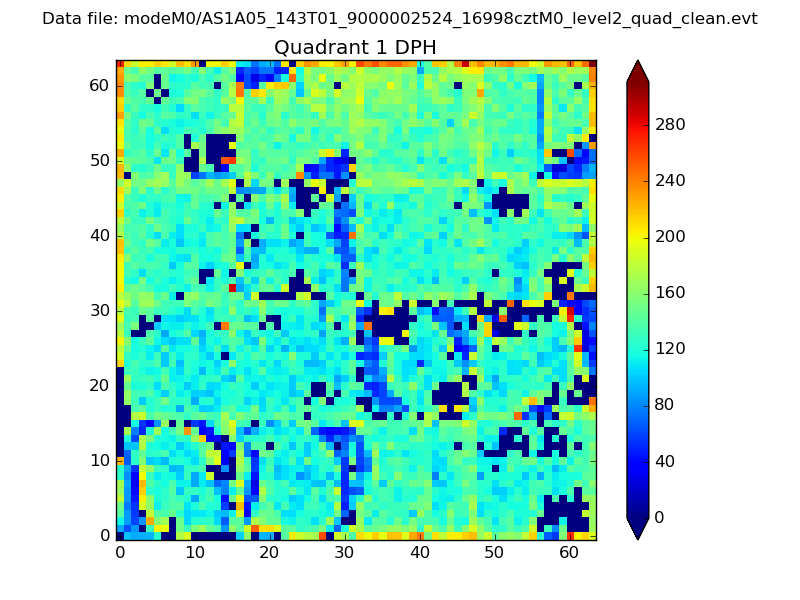 |
Quadrant B |
|---|---|---|---|
| Quadrant D | 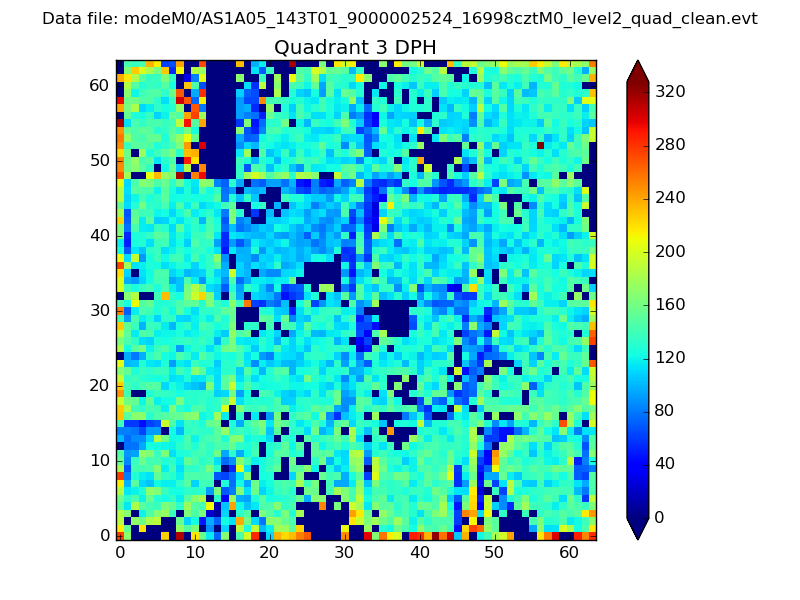 |
 |
Quadrant C |
| Plot type | Count rate plots | Images |
|---|---|---|
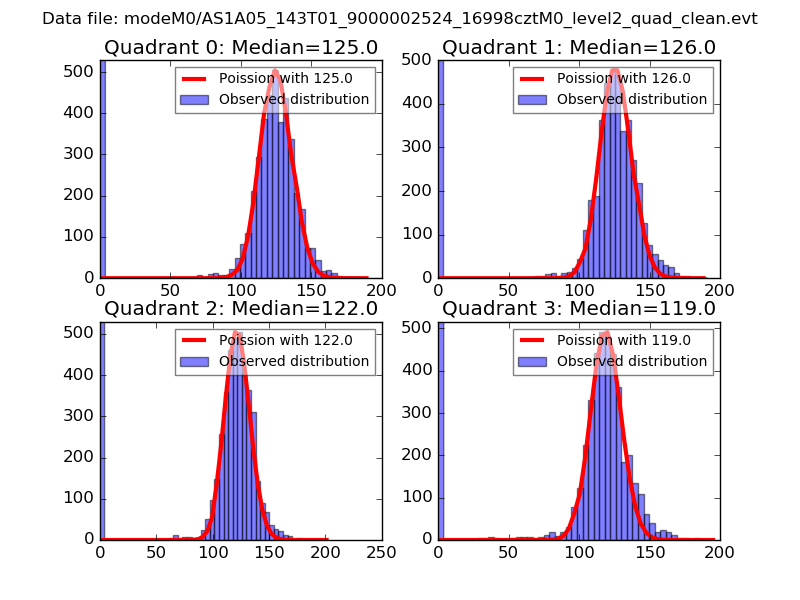
| Comparison with Poisson distribution Blue bars denote a histogram of data divided into 1 sec bins. Red curve is a Poisson curve with rate = median count rate of data. |
 |
 |
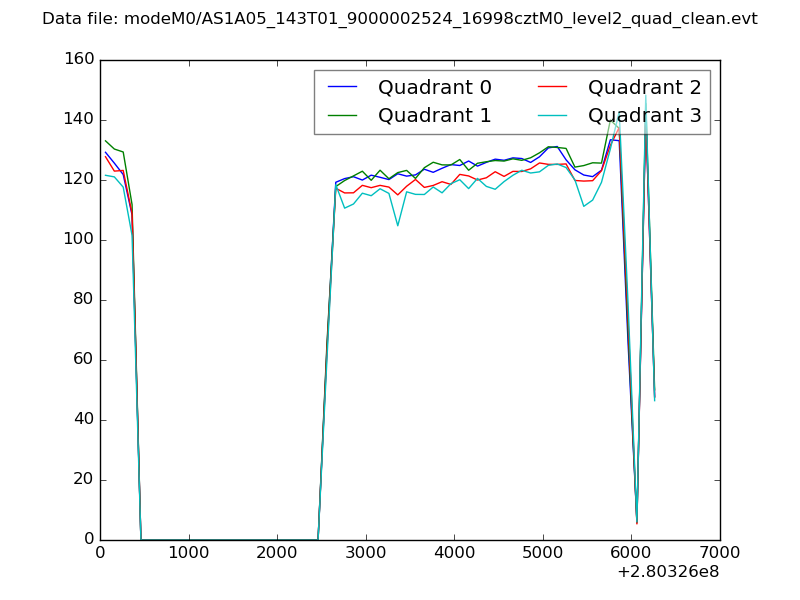
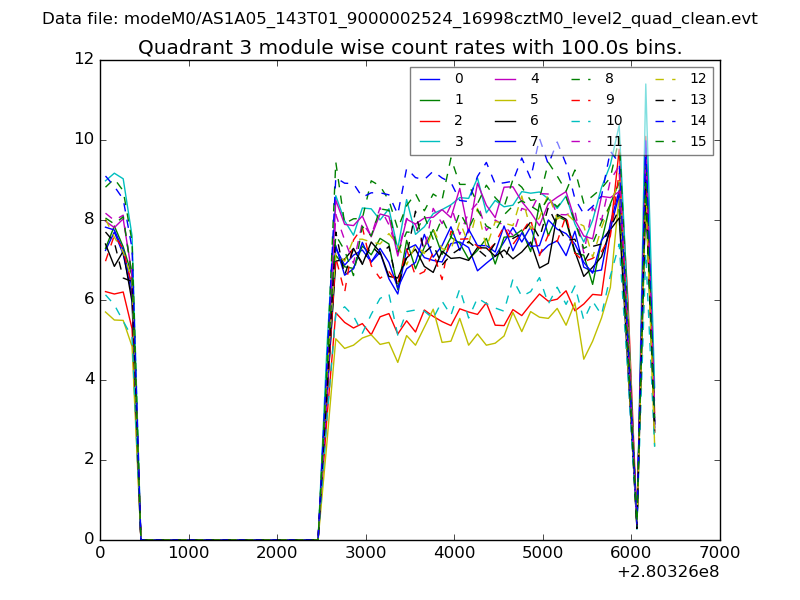
| Quadrant-wise count rates Data is divided into 100 sec bins |
 |
|
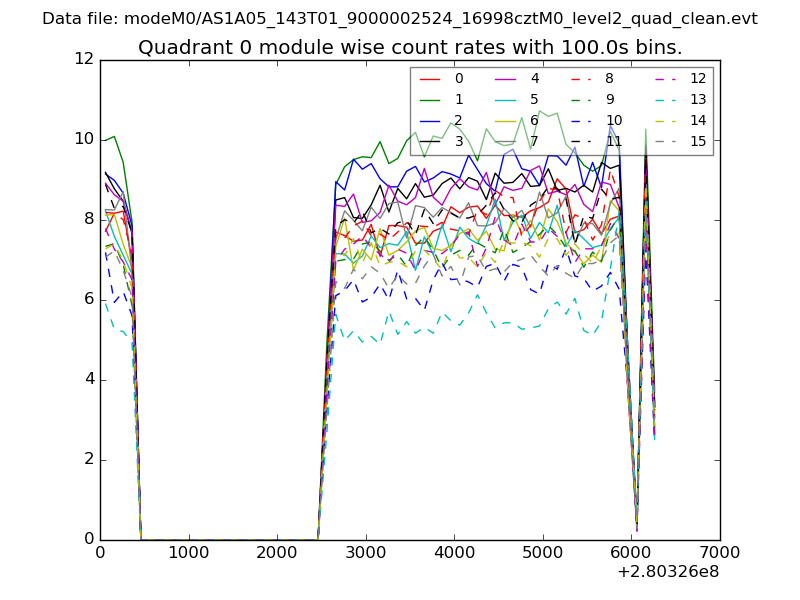
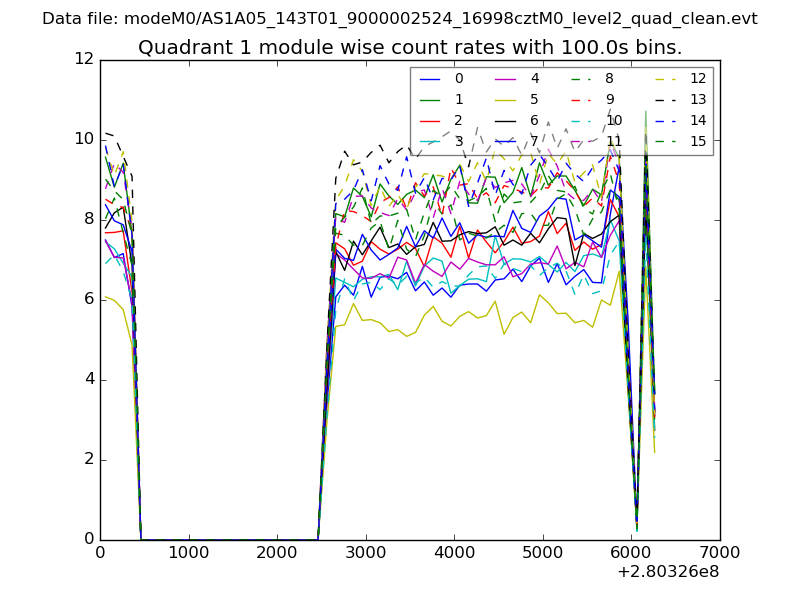
| Module-wise count rates for Quadrant A Data is divided into 100 sec bins |
 |
 |
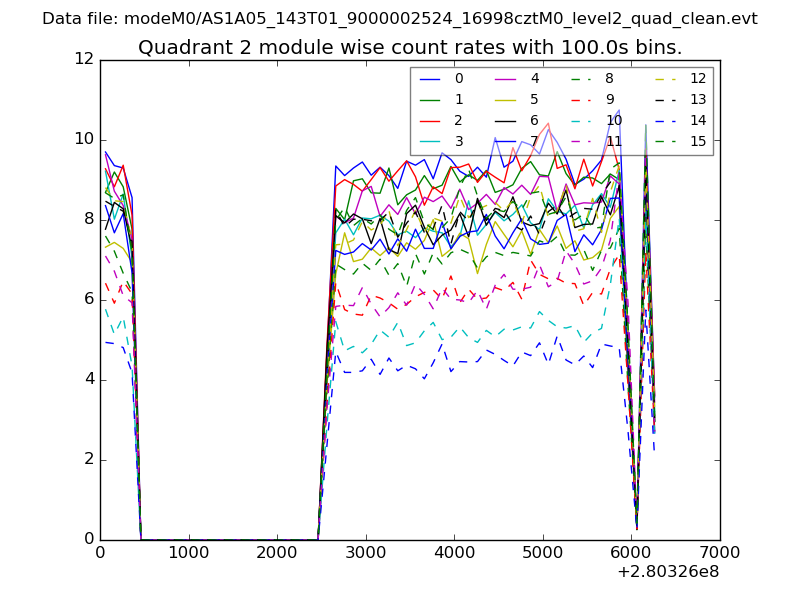
| Module-wise count rates for Quadrant B Data is divided into 100 sec bins |
 |
 |
| Module-wise count rates for Quadrant C Data is divided into 100 sec bins |
 |
 |
| Module-wise count rates for Quadrant D Data is divided into 100 sec bins |
 |
 |
| Parameter | Plot |
|---|---|
| CZT HV Monitor | 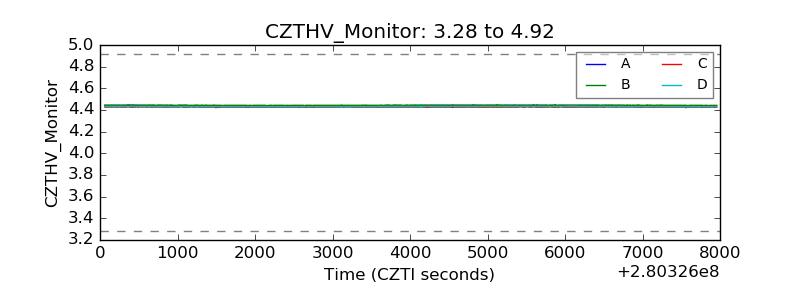 |
| D_VDD | 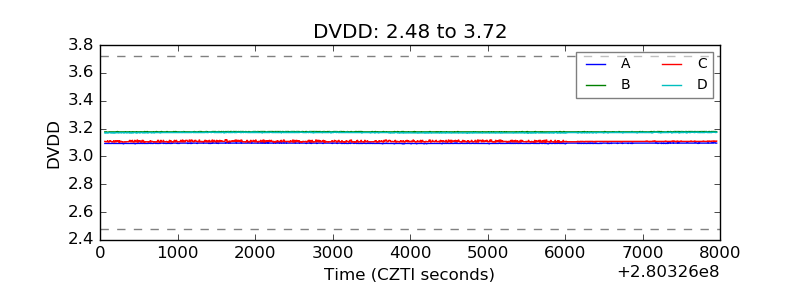 |
| Temperature 1 |  |
| Veto HV Monitor | 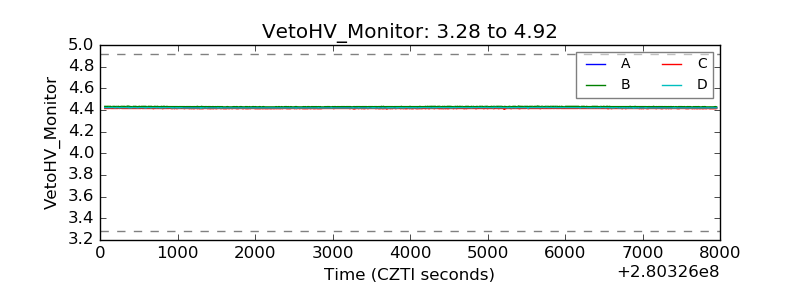 |
| Veto LLD | 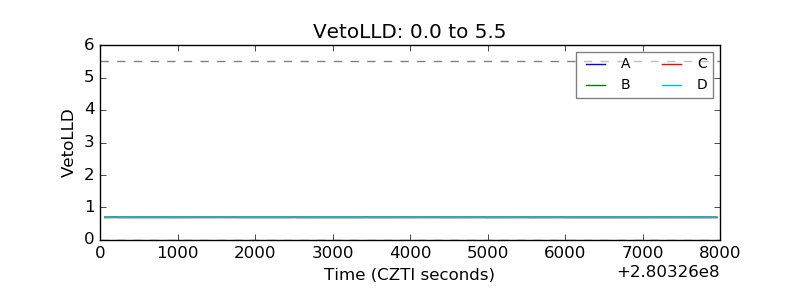 |
| Alpha Counter | 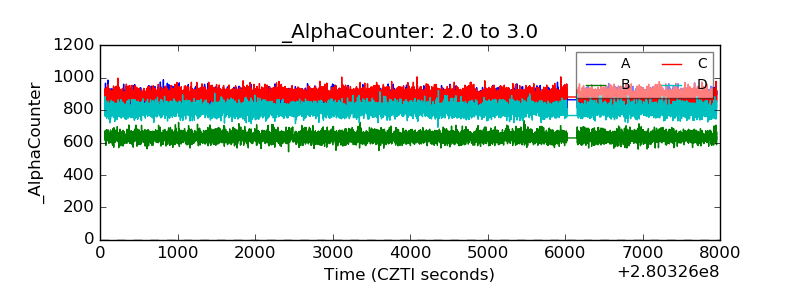 |
| _CPM_Rate | 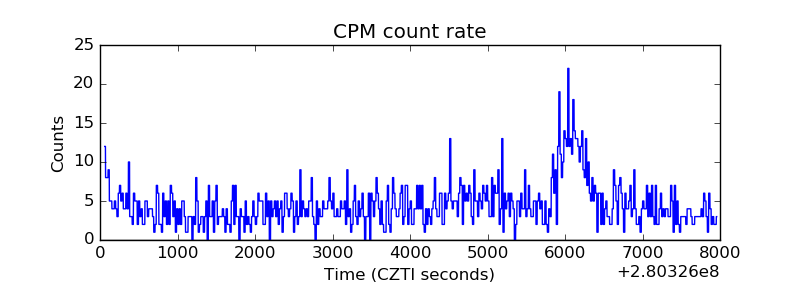 |
| CZT Counter |  |
| +2.5 Volts monitor |  |
| +5 Volts monitor |  |
| _ROLL_ROT | 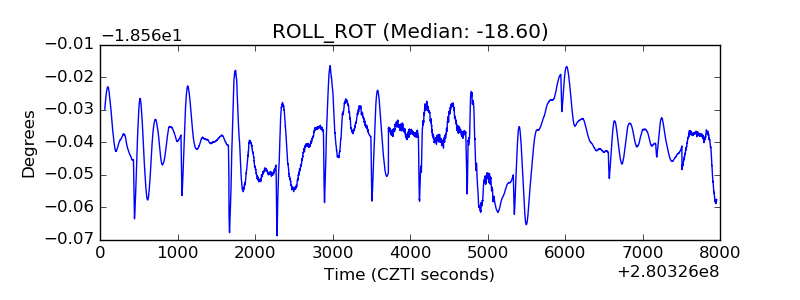 |
| _Roll_DEC | 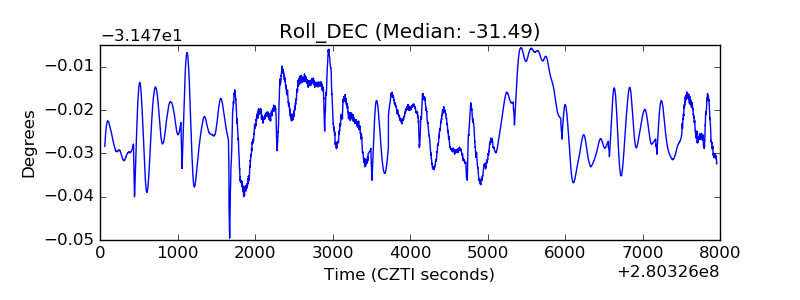 |
| _Roll_RA | 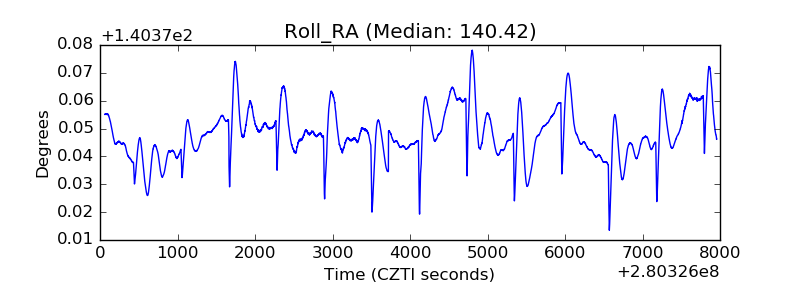 |
| Veto Counter | 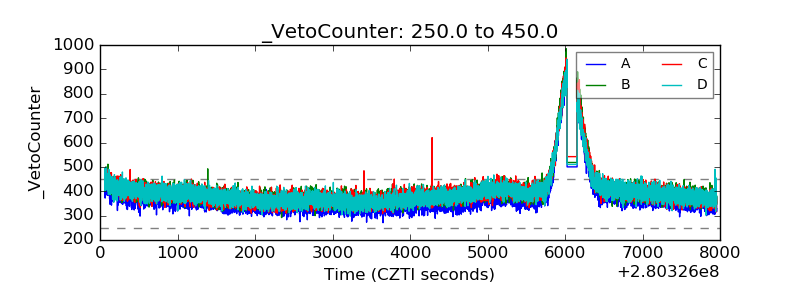 |