| Param | Original file | Final file |
|---|---|---|
| Filename | modeM0/AS1A05_143T01_9000002524_17002cztM0_level2.evt | modeM0/AS1A05_143T01_9000002524_17002cztM0_level2_quad_clean.evt |
| Size (bytes) | 591,641,280 | 88,047,360 |
| Size | 564.2 MB | 84.0 MB |
| Events in quadrant A | 3,169,974 | 579,512 |
| Events in quadrant B | 5,126,362 | 525,607 |
| Events in quadrant C | 3,680,387 | 564,259 |
| Events in quadrant D | 5,488,151 | 530,527 |
| Mode M9 | |||
|---|---|---|---|
| Quadrant | BADHDUFLAG | Total packets | Discarded packets |
| A | 0 | 19 | 0 |
| B | 0 | 19 | 0 |
| C | 0 | 19 | 0 |
| D | 0 | 19 | 0 |
| Mode SS | |||
|---|---|---|---|
| Quadrant | BADHDUFLAG | Total packets | Discarded packets |
| A | 0 | 136 | 0 |
| B | 0 | 136 | 0 |
| C | 0 | 136 | 0 |
| D | 0 | 136 | 0 |
| Mode M0 | |||
|---|---|---|---|
| Quadrant | BADHDUFLAG | Total packets | Discarded packets |
| A | 0 | 13843 | 2 |
| B | 0 | 19539 | 2 |
| C | 0 | 15290 | 2 |
| D | 0 | 20849 | 2 |
| Quadrant | Total seconds | Saturated seconds | Saturation percentage |
|---|---|---|---|
| A | 6688 | 69 | 1.031699% |
| B | 6688 | 877 | 13.113038% |
| C | 6689 | 92 | 1.375392% |
| D | 6689 | 502 | 7.504859% |
Noise dominated data is calculated using 1-second bins in cleaned event files. If a bin has >2000 counts, and if more than 50% of those come from <1% of pixels, then it is considered to be noise-dominated and hence unusable.
| Quadrant | # 1 sec bins | Bins with >0 counts | Bins with >2000 counts | High rate bins dominated by noise | Noise dominated (total time) | Noise dominated (detector-on time) | Marked lightcurve |
|---|---|---|---|---|---|---|---|
| A | 8509 | 6690 | 6 | 6 | 0.07% | 0.09% | 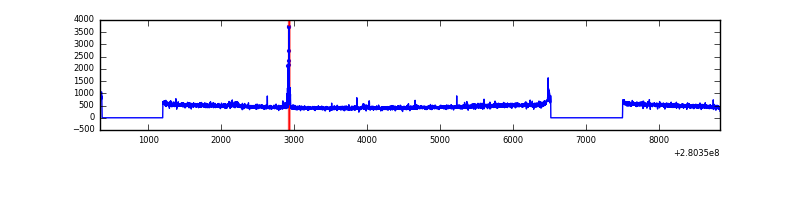 |
| B | 8509 | 6690 | 662 | 662 | 7.78% | 9.90% | 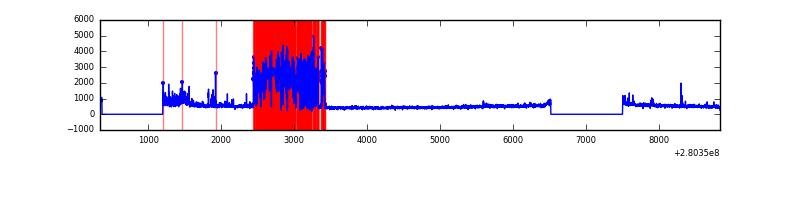 |
| C | 8510 | 6692 | 1 | 1 | 0.01% | 0.01% |  |
| D | 8510 | 6692 | 392 | 392 | 4.61% | 5.86% | 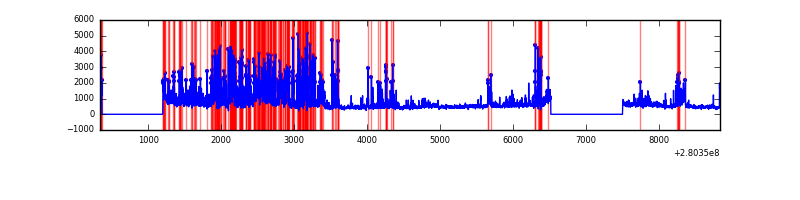 |
Top three noisy pixels from each quadrant. If the there are fewer than three noisy pixels in the level2.evt file, extra rows are filled as -1
| Pixel properties | Quadrant properties | ||||||
|---|---|---|---|---|---|---|---|
| Quadrant | DetID | PixID | Counts | Sigma | Mean | Median | Sigma |
| A | 15 | 174 | 57483 | 342.89 | 810 | 792 | 165.3 |
| A | 0 | 226 | 7298 | 39.35 | 810 | 792 | 165.3 |
| A | 12 | 194 | 6118 | 32.21 | 810 | 792 | 165.3 |
| B | 3 | 64 | 1897616 | 12885.11 | 764 | 743 | 147.2 |
| B | 15 | 35 | 127700 | 862.4 | 764 | 743 | 147.2 |
| B | 0 | 197 | 26860 | 177.41 | 764 | 743 | 147.2 |
| C | 3 | 233 | 510638 | 2783.63 | 777 | 782 | 183.2 |
| C | 14 | 238 | 117267 | 635.97 | 777 | 782 | 183.2 |
| C | 5 | 112 | 21724 | 114.34 | 777 | 782 | 183.2 |
| D | 1 | 52 | 2243334 | 12088.38 | 761 | 739 | 185.5 |
| D | 4 | 239 | 208833 | 1121.7 | 761 | 739 | 185.5 |
| D | 2 | 152 | 64853 | 345.6 | 761 | 739 | 185.5 |
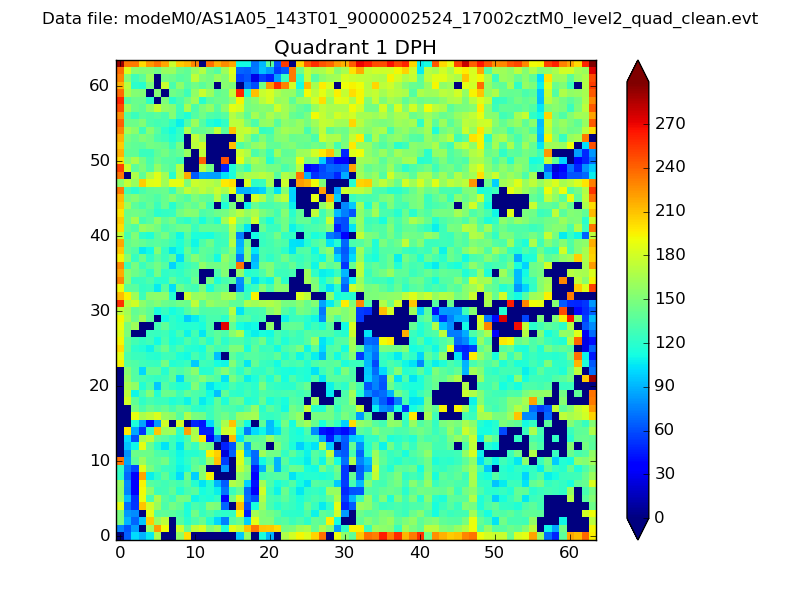
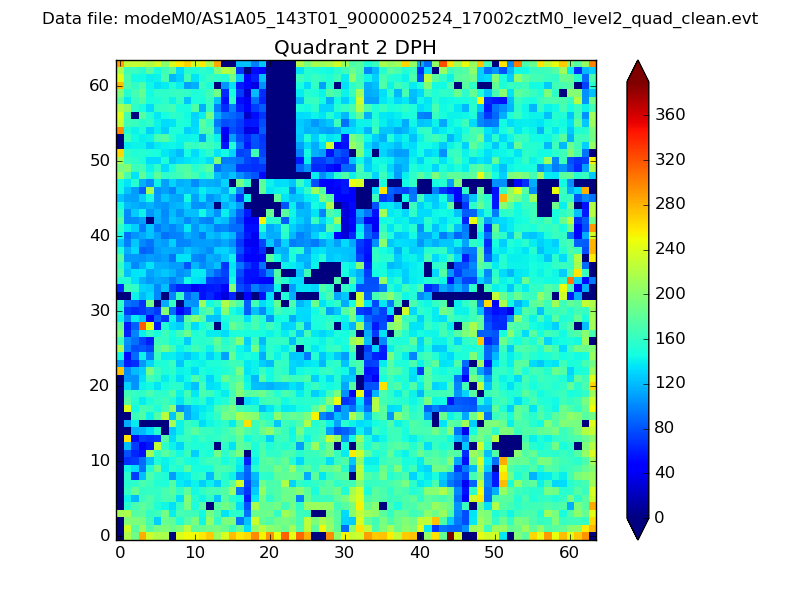
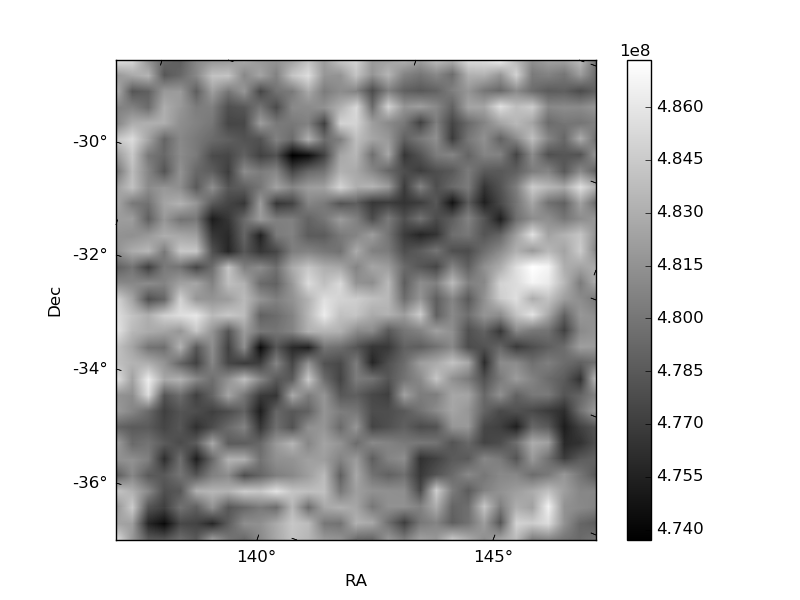
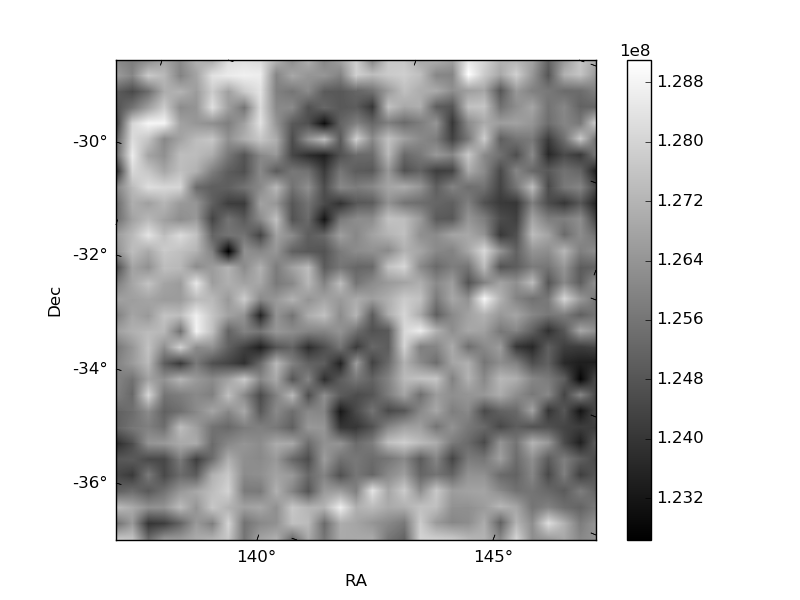
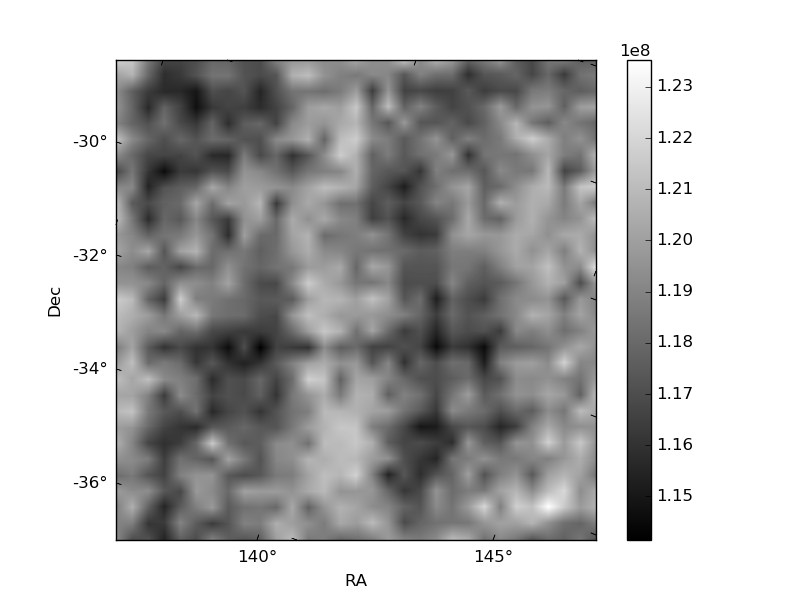
Histogram calculated using DETX and DETY for each event in the final _common_clean file
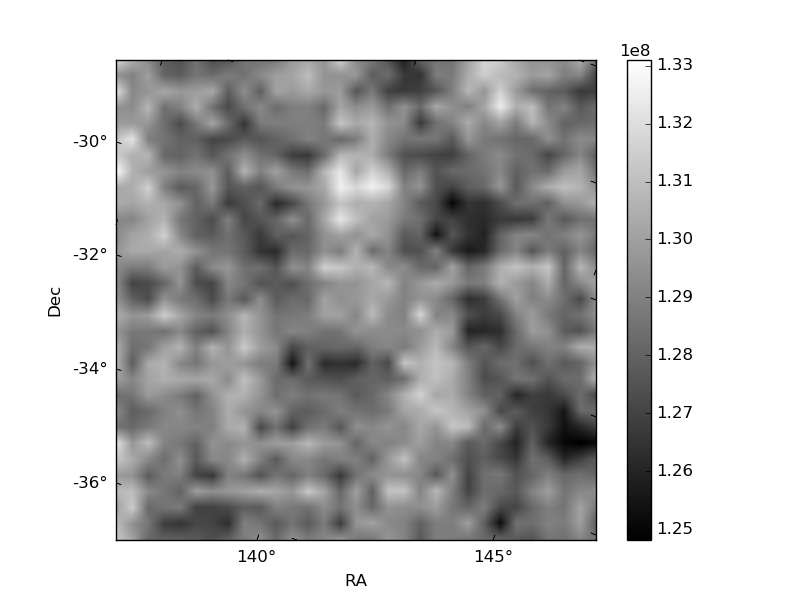
| Quadrant A | 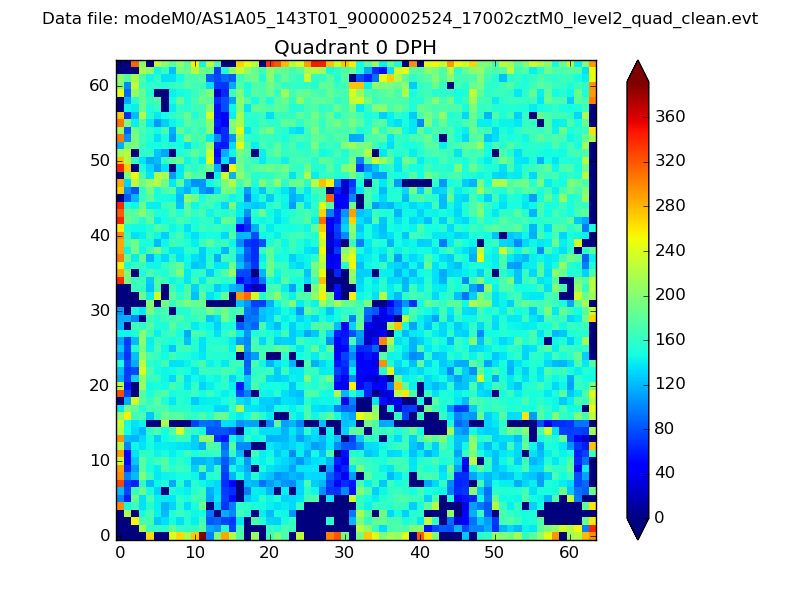 |
 |
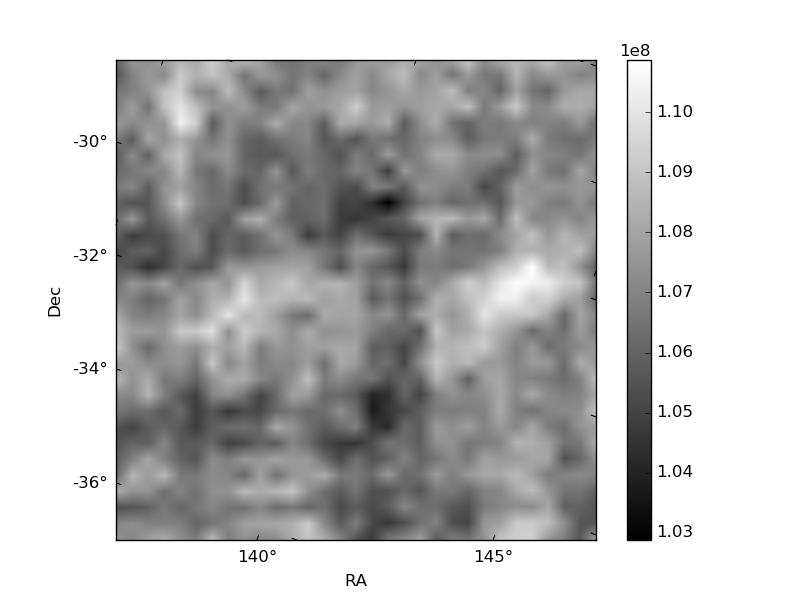
Quadrant B |
|---|---|---|---|
| Quadrant D | 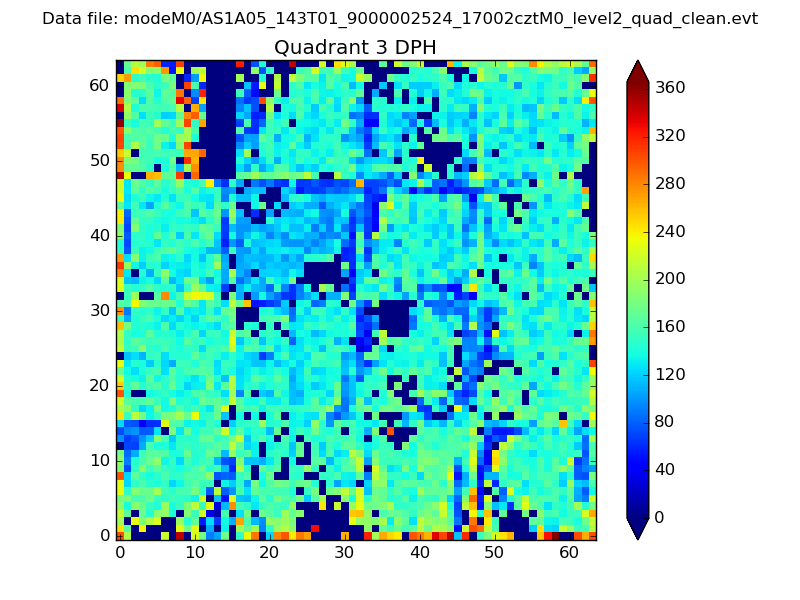 |
 |
Quadrant C |
| Plot type | Count rate plots | Images |
|---|---|---|
| Comparison with Poisson distribution Blue bars denote a histogram of data divided into 1 sec bins. Red curve is a Poisson curve with rate = median count rate of data. |
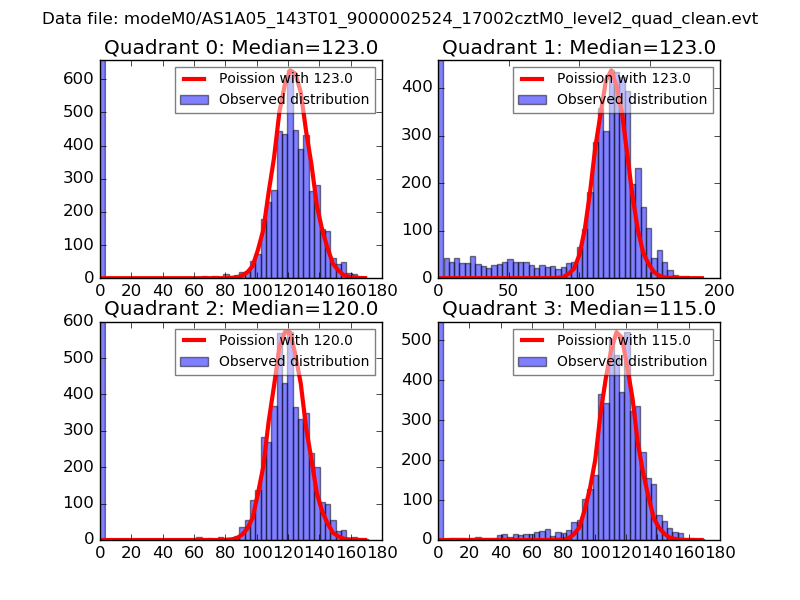 |
 |
| Quadrant-wise count rates Data is divided into 100 sec bins |
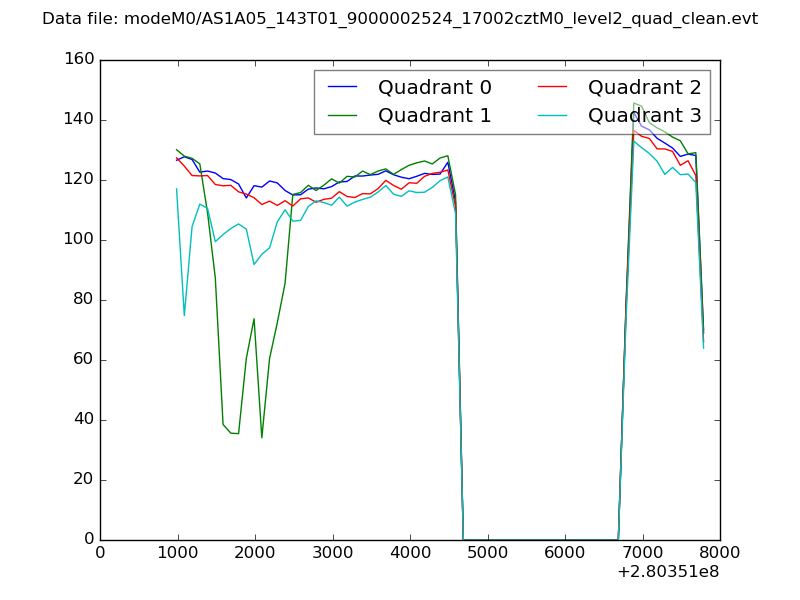 |
|
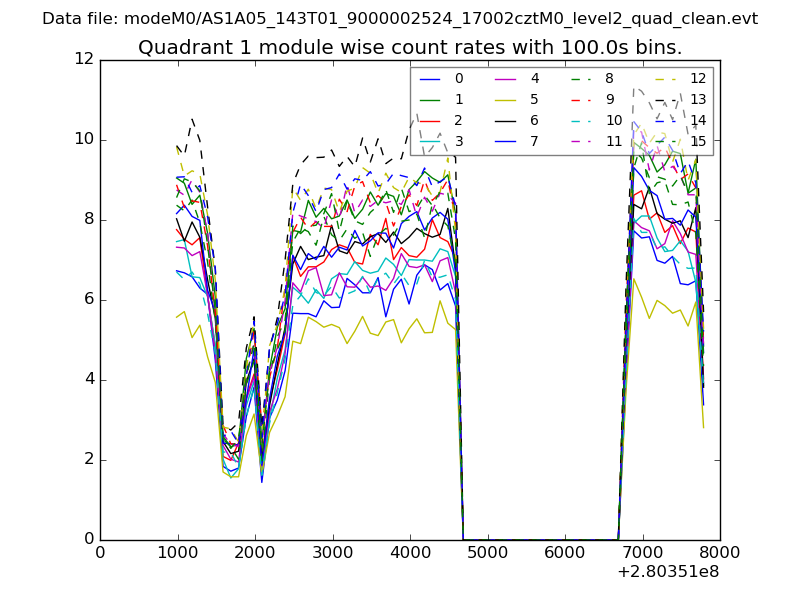
| Module-wise count rates for Quadrant A Data is divided into 100 sec bins |
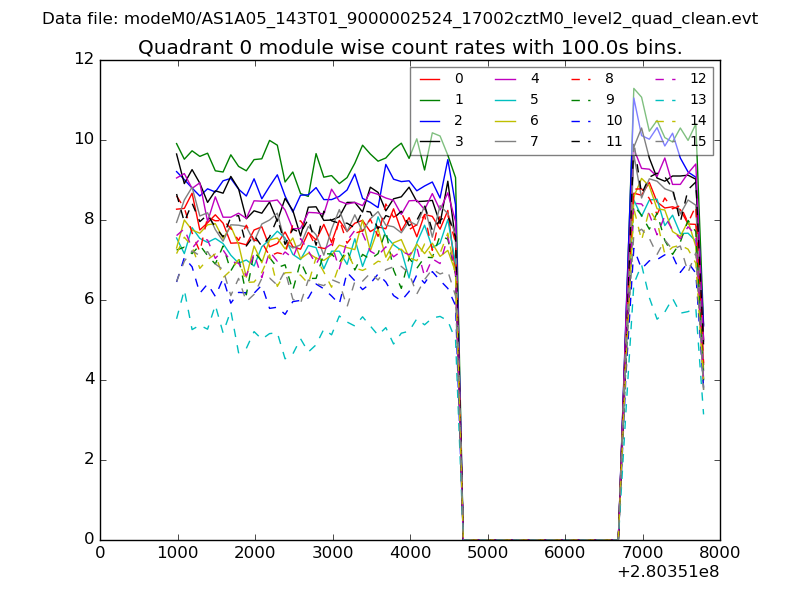 |
 |
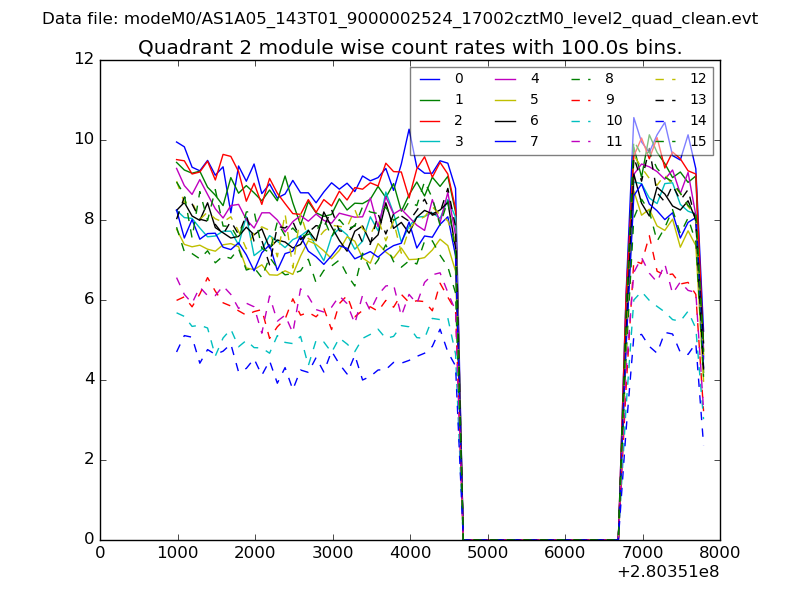
| Module-wise count rates for Quadrant B Data is divided into 100 sec bins |
 |
 |
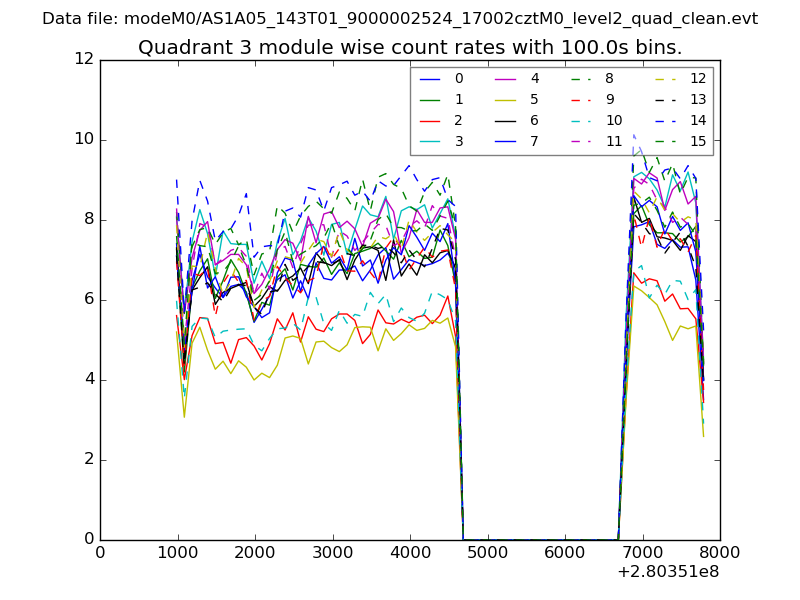
| Module-wise count rates for Quadrant C Data is divided into 100 sec bins |
 |
 |
| Module-wise count rates for Quadrant D Data is divided into 100 sec bins |
 |
 |
| Parameter | Plot |
|---|---|
| CZT HV Monitor | 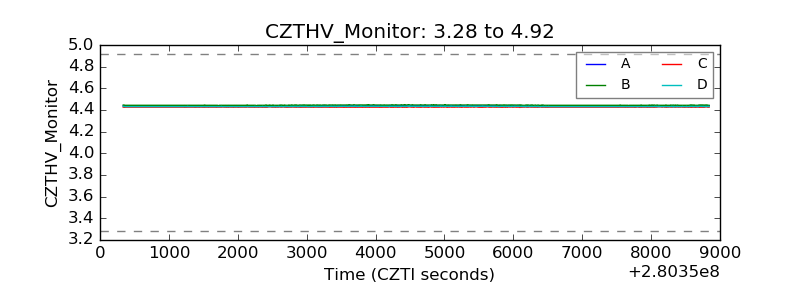 |
| D_VDD | 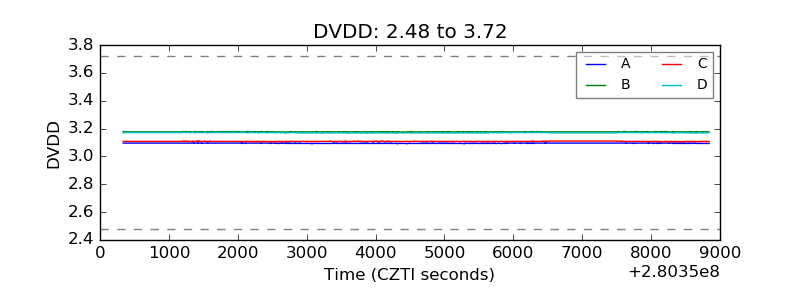 |
| Temperature 1 | 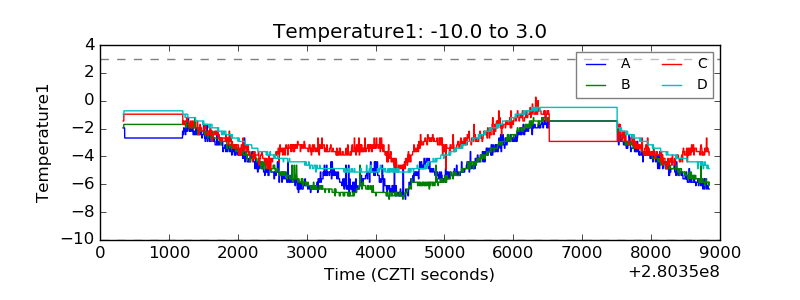 |
| Veto HV Monitor |  |
| Veto LLD | 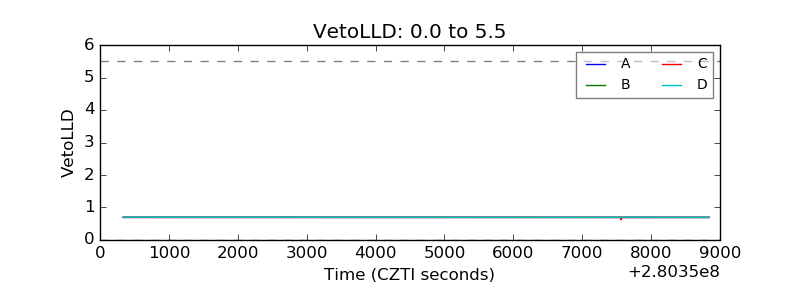 |
| Alpha Counter | 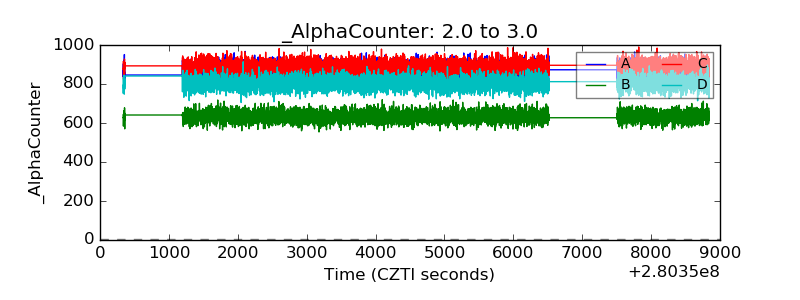 |
| _CPM_Rate | 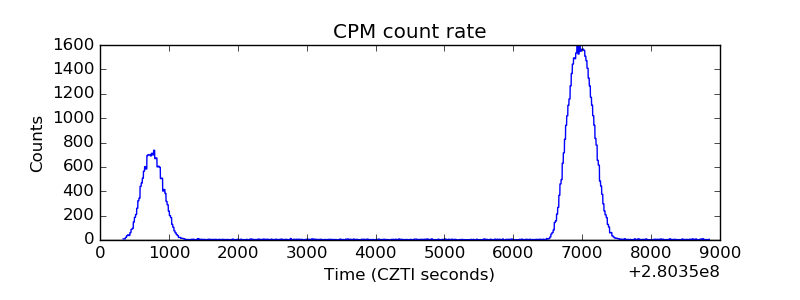 |
| CZT Counter | 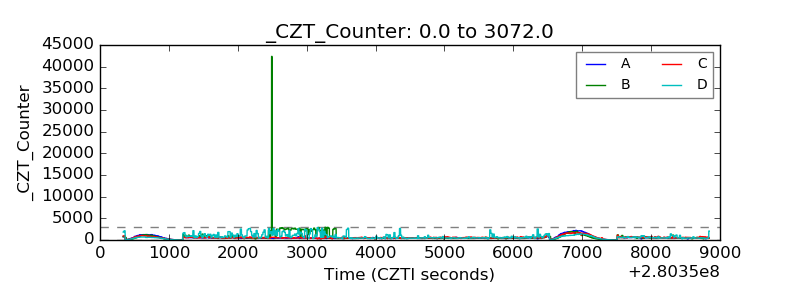 |
| +2.5 Volts monitor |  |
| +5 Volts monitor |  |
| _ROLL_ROT | 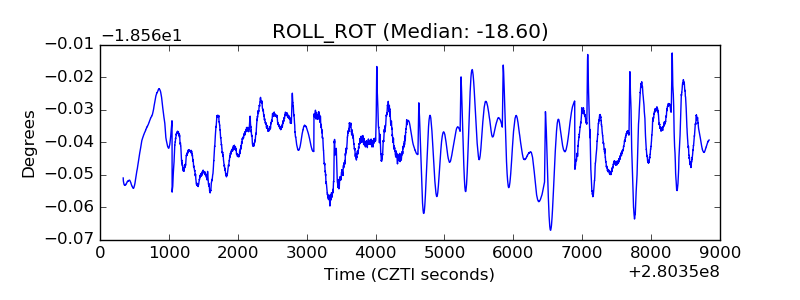 |
| _Roll_DEC | 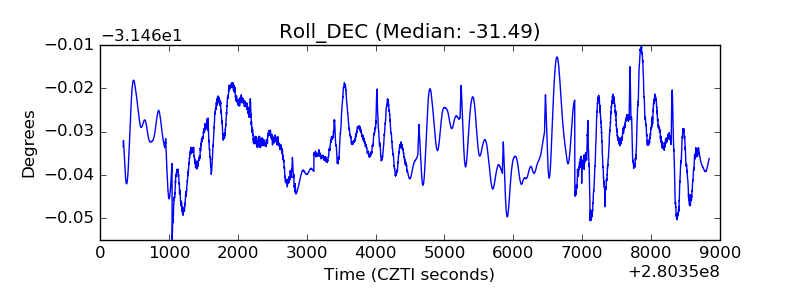 |
| _Roll_RA | 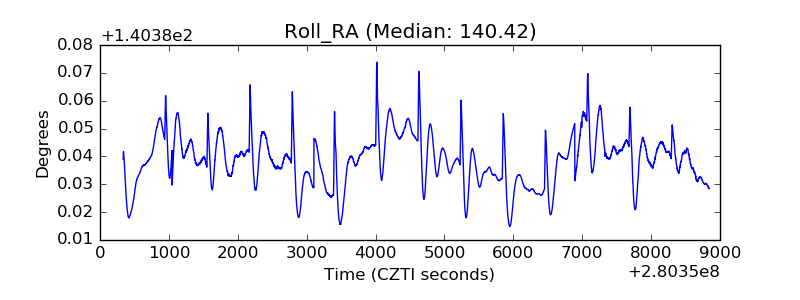 |
| Veto Counter | 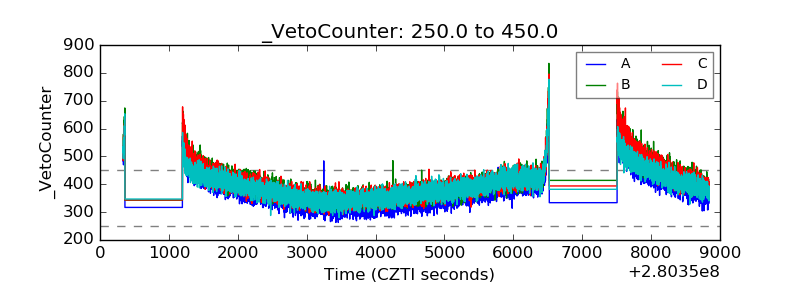 |