| Param | Original file | Final file |
|---|---|---|
| Filename | modeM0/AS1A05_143T01_9000002524_17005cztM0_level2.evt | modeM0/AS1A05_143T01_9000002524_17005cztM0_level2_quad_clean.evt |
| Size (bytes) | 506,116,800 | 104,932,800 |
| Size | 482.7 MB | 100.1 MB |
| Events in quadrant A | 3,091,194 | 691,847 |
| Events in quadrant B | 3,302,538 | 717,452 |
| Events in quadrant C | 3,467,365 | 683,596 |
| Events in quadrant D | 5,035,947 | 642,112 |
| Mode M9 | |||
|---|---|---|---|
| Quadrant | BADHDUFLAG | Total packets | Discarded packets |
| A | 0 | 21 | 0 |
| B | 0 | 22 | 0 |
| C | 0 | 22 | 0 |
| D | 0 | 22 | 0 |
| Mode SS | |||
|---|---|---|---|
| Quadrant | BADHDUFLAG | Total packets | Discarded packets |
| A | 0 | 130 | 0 |
| B | 0 | 130 | 0 |
| C | 0 | 130 | 0 |
| D | 0 | 130 | 0 |
| Mode M0 | |||
|---|---|---|---|
| Quadrant | BADHDUFLAG | Total packets | Discarded packets |
| A | 0 | 13326 | 2 |
| B | 0 | 13961 | 2 |
| C | 0 | 14376 | 2 |
| D | 0 | 19189 | 2 |
| Quadrant | Total seconds | Saturated seconds | Saturation percentage |
|---|---|---|---|
| A | 6345 | 33 | 0.520095% |
| B | 6345 | 70 | 1.103231% |
| C | 6345 | 74 | 1.166273% |
| D | 6345 | 488 | 7.691095% |
Noise dominated data is calculated using 1-second bins in cleaned event files. If a bin has >2000 counts, and if more than 50% of those come from <1% of pixels, then it is considered to be noise-dominated and hence unusable.
| Quadrant | # 1 sec bins | Bins with >0 counts | Bins with >2000 counts | High rate bins dominated by noise | Noise dominated (total time) | Noise dominated (detector-on time) | Marked lightcurve |
|---|---|---|---|---|---|---|---|
| A | 7571 | 6347 | 4 | 4 | 0.05% | 0.06% | 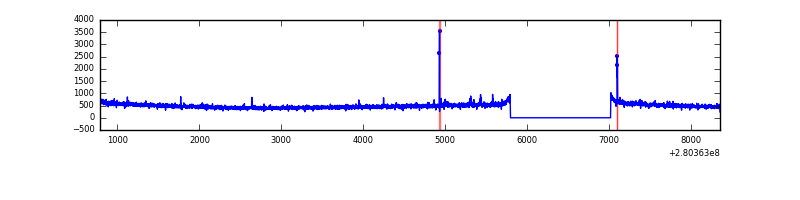 |
| B | 7571 | 6347 | 3 | 3 | 0.04% | 0.05% | 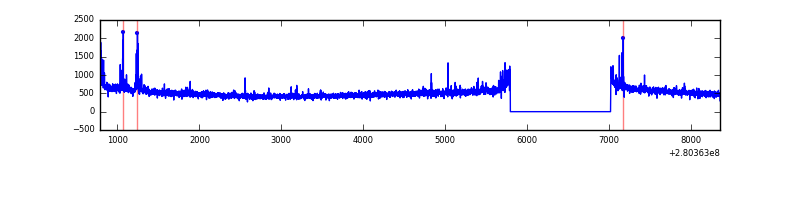 |
| C | 7571 | 6347 | 0 | 0 | 0.00% | 0.00% | 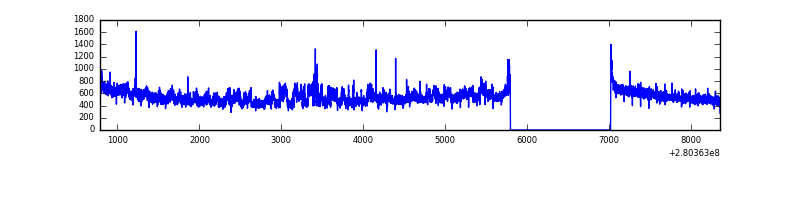 |
| D | 7571 | 6347 | 398 | 398 | 5.26% | 6.27% | 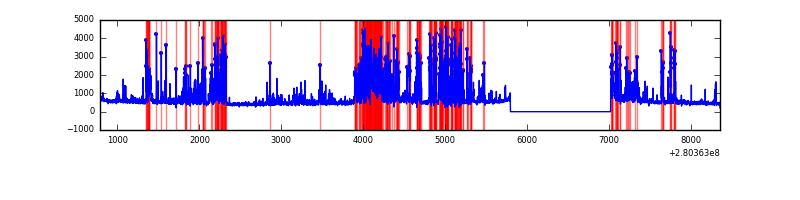 |
Top three noisy pixels from each quadrant. If the there are fewer than three noisy pixels in the level2.evt file, extra rows are filled as -1
| Pixel properties | Quadrant properties | ||||||
|---|---|---|---|---|---|---|---|
| Quadrant | DetID | PixID | Counts | Sigma | Mean | Median | Sigma |
| A | 15 | 174 | 39015 | 239.2 | 794 | 780 | 159.8 |
| A | 0 | 226 | 7134 | 39.75 | 794 | 780 | 159.8 |
| A | 12 | 194 | 5682 | 30.67 | 794 | 780 | 159.8 |
| B | 0 | 197 | 72695 | 474.44 | 807 | 786 | 151.6 |
| B | 3 | 209 | 22551 | 143.6 | 807 | 786 | 151.6 |
| B | 12 | 111 | 17479 | 110.14 | 807 | 786 | 151.6 |
| C | 3 | 233 | 300175 | 1651.7 | 778 | 784 | 181.3 |
| C | 14 | 238 | 121211 | 664.38 | 778 | 784 | 181.3 |
| C | 5 | 112 | 11938 | 61.54 | 778 | 784 | 181.3 |
| D | 1 | 52 | 2138410 | 11709.23 | 752 | 729 | 182.6 |
| D | 2 | 234 | 25461 | 135.47 | 752 | 729 | 182.6 |
| D | 10 | 70 | 20495 | 108.27 | 752 | 729 | 182.6 |
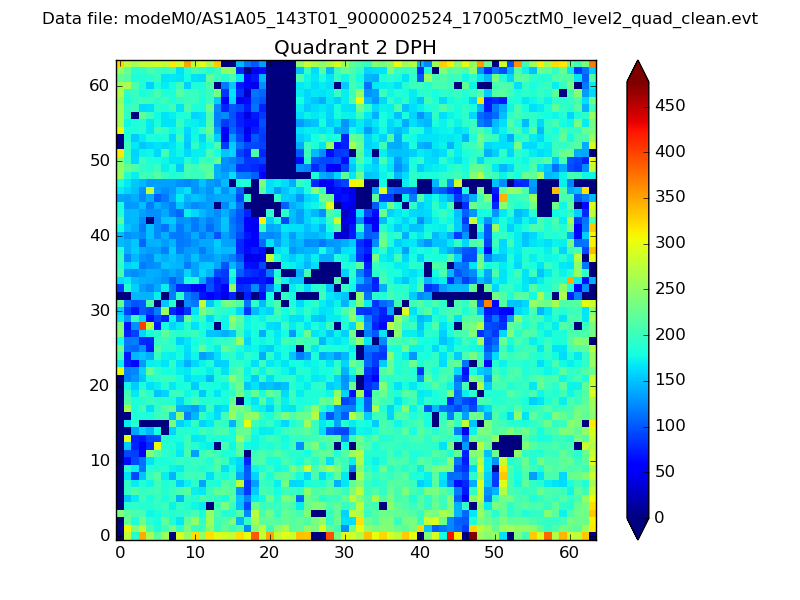
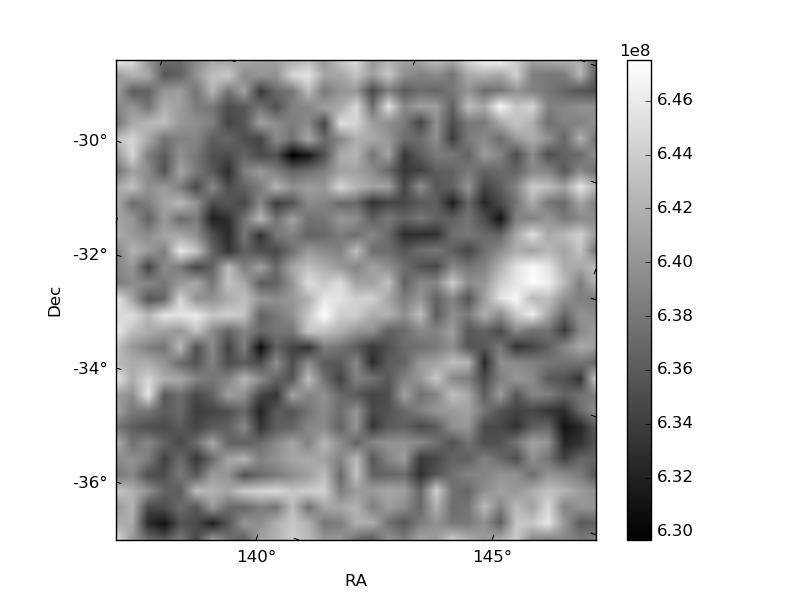
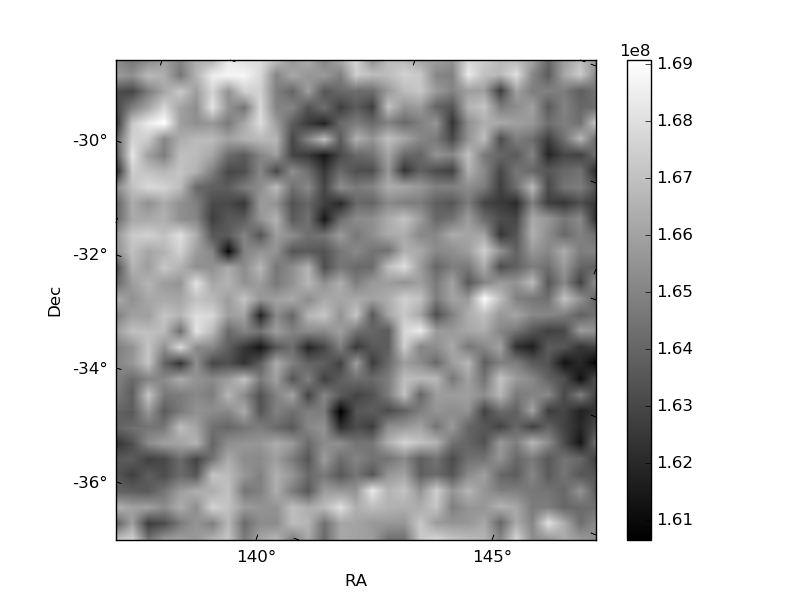
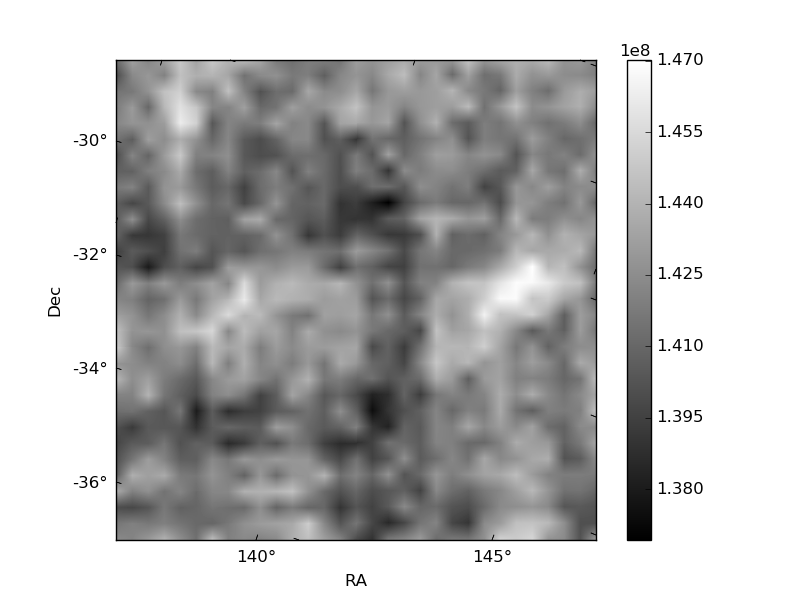
Histogram calculated using DETX and DETY for each event in the final _common_clean file
| Quadrant A | 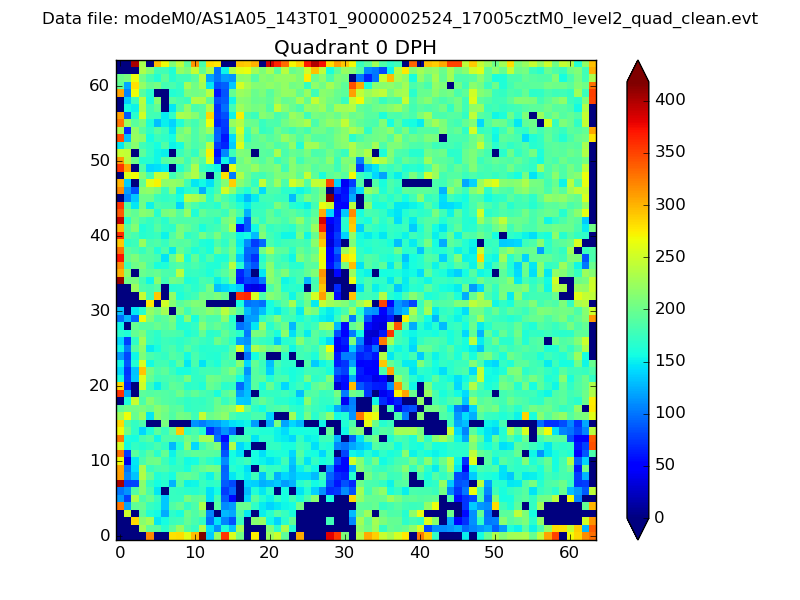 |
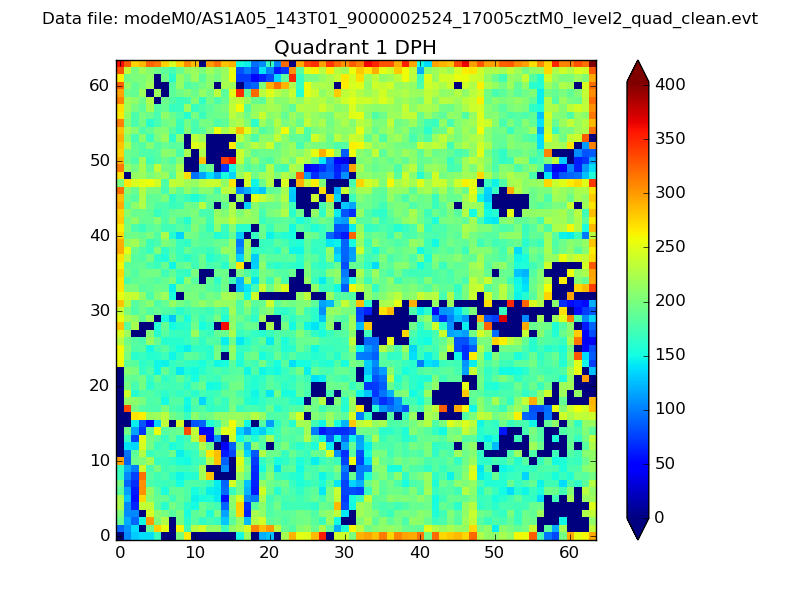 |
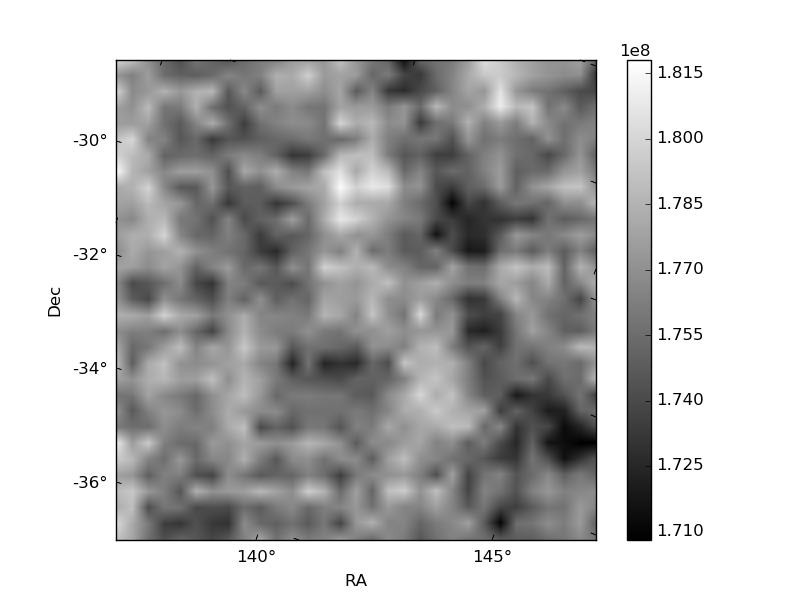
Quadrant B |
|---|---|---|---|
| Quadrant D | 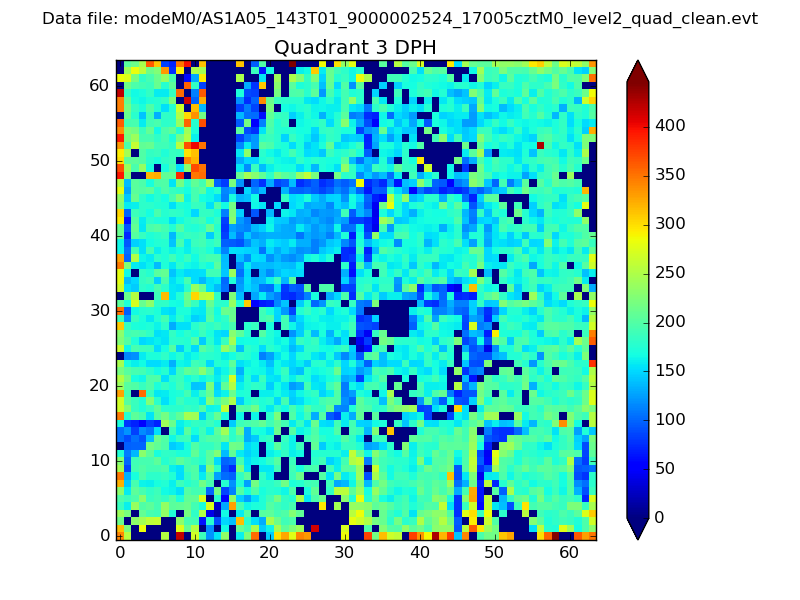 |
 |
Quadrant C |
| Plot type | Count rate plots | Images |
|---|---|---|
| Comparison with Poisson distribution Blue bars denote a histogram of data divided into 1 sec bins. Red curve is a Poisson curve with rate = median count rate of data. |
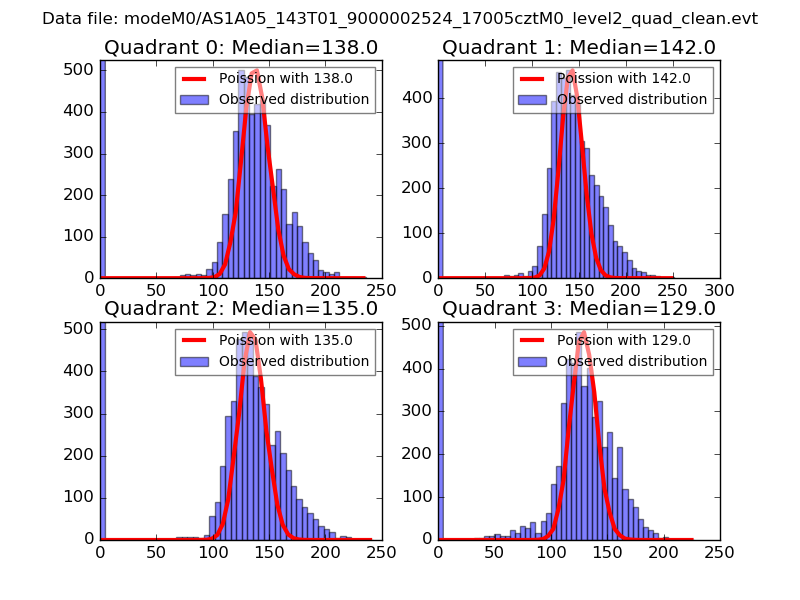 |
 |
| Quadrant-wise count rates Data is divided into 100 sec bins |
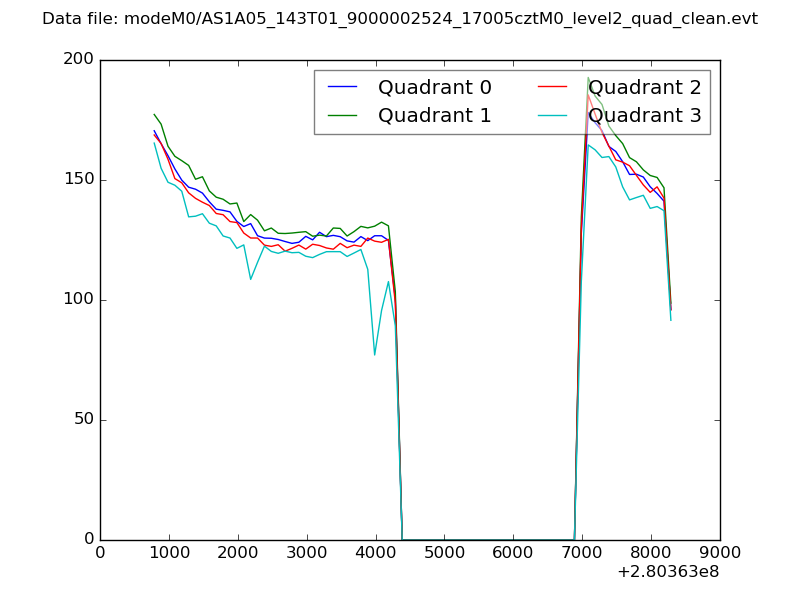 |
|
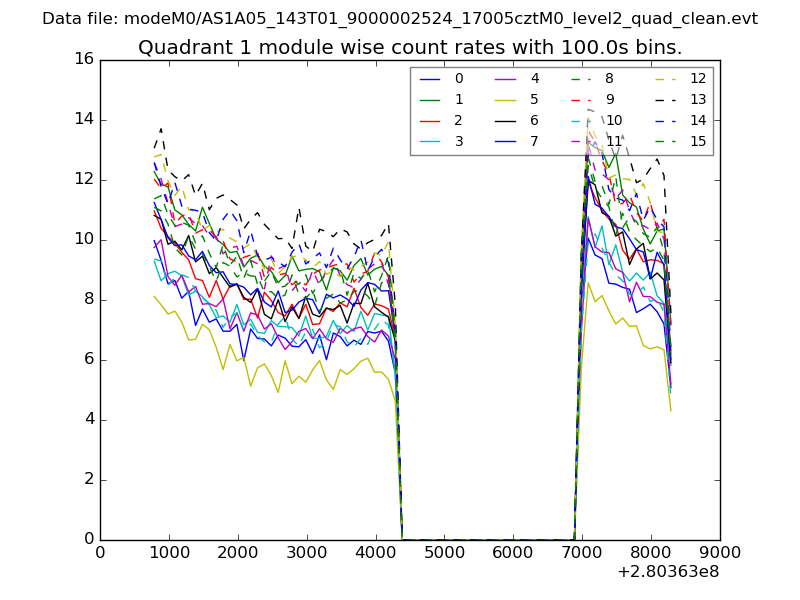
| Module-wise count rates for Quadrant A Data is divided into 100 sec bins |
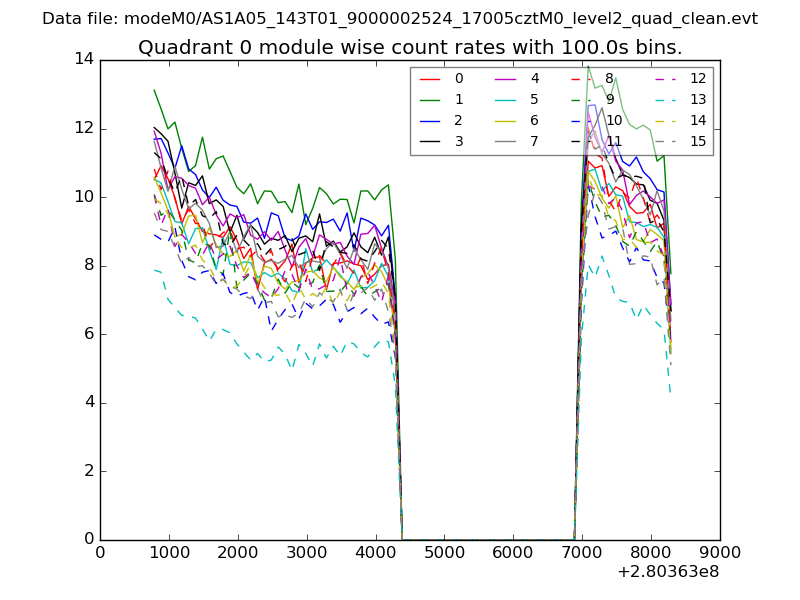 |
 |
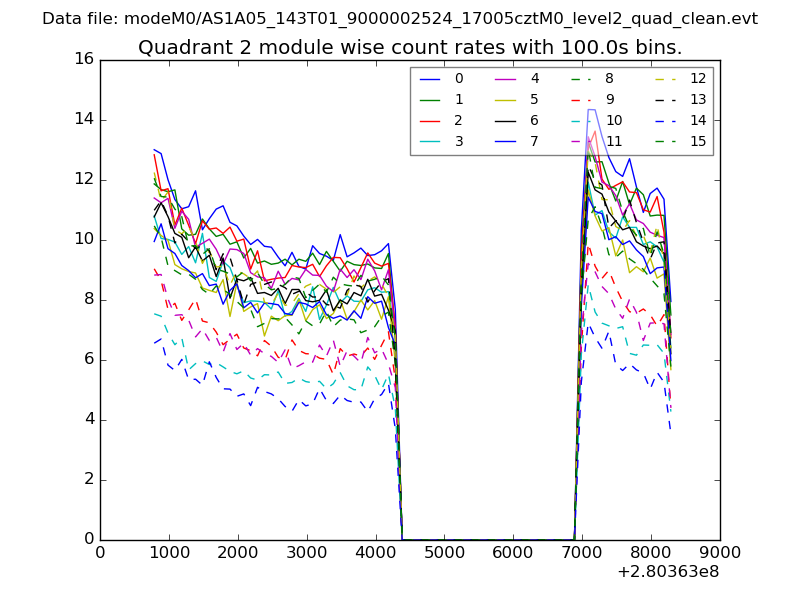
| Module-wise count rates for Quadrant B Data is divided into 100 sec bins |
 |
 |
| Module-wise count rates for Quadrant C Data is divided into 100 sec bins |
 |
 |
| Module-wise count rates for Quadrant D Data is divided into 100 sec bins |
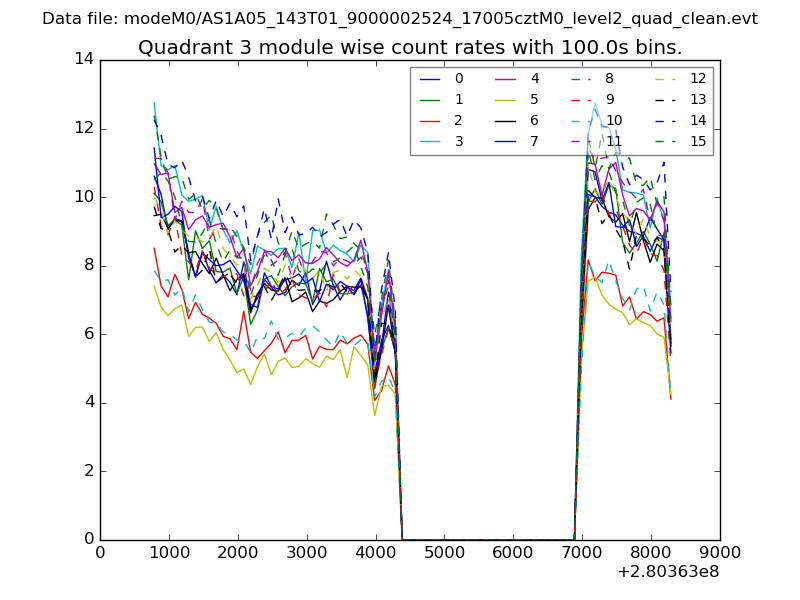 |
 |
| Parameter | Plot |
|---|---|
| CZT HV Monitor | 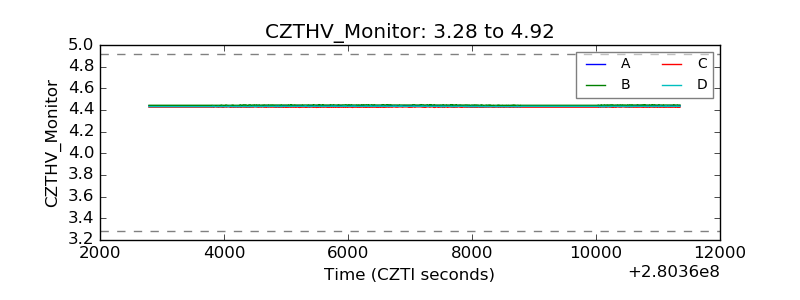 |
| D_VDD | 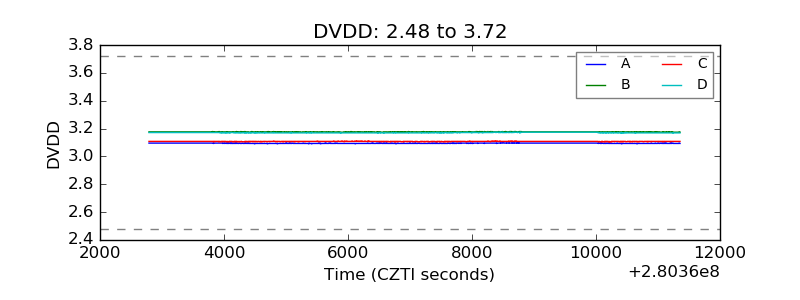 |
| Temperature 1 | 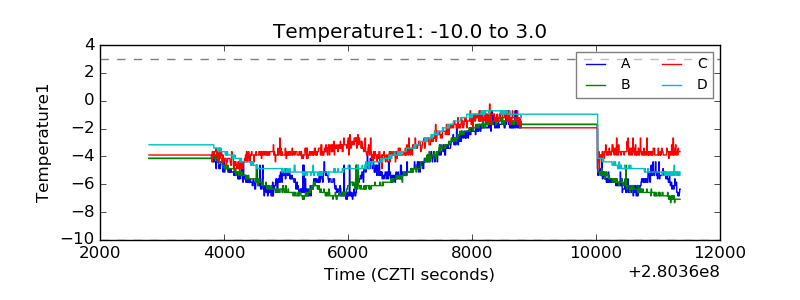 |
| Veto HV Monitor | 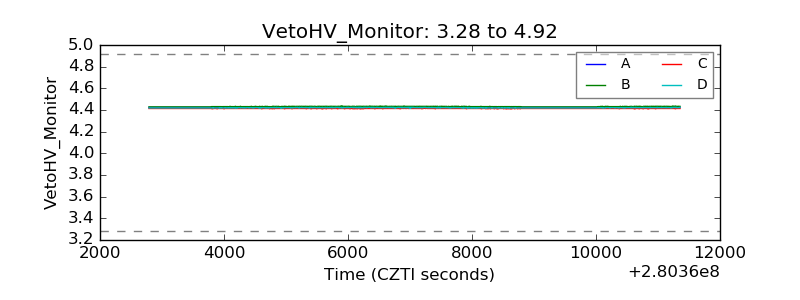 |
| Veto LLD | 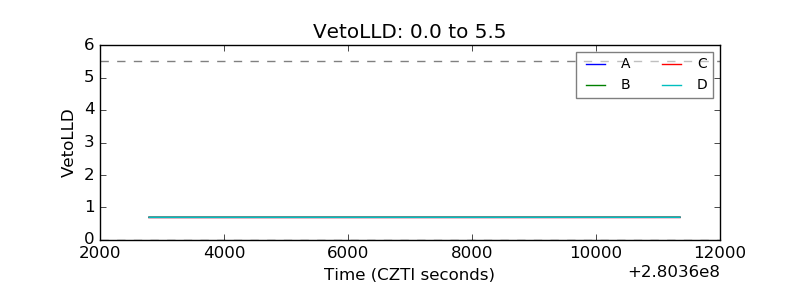 |
| Alpha Counter | 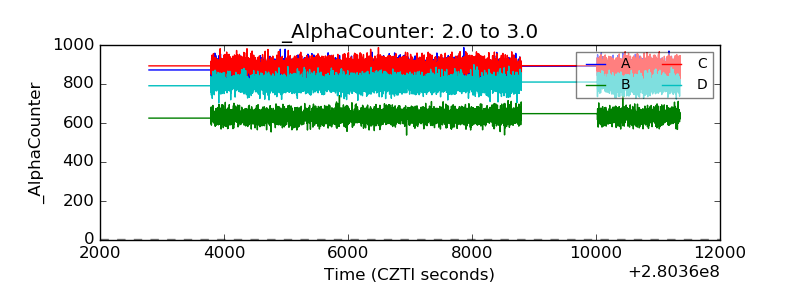 |
| _CPM_Rate | 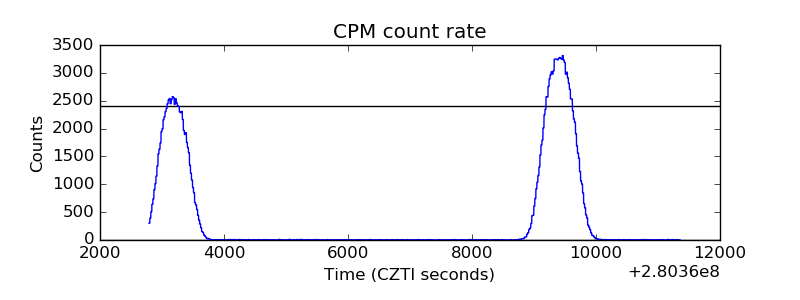 |
| CZT Counter | 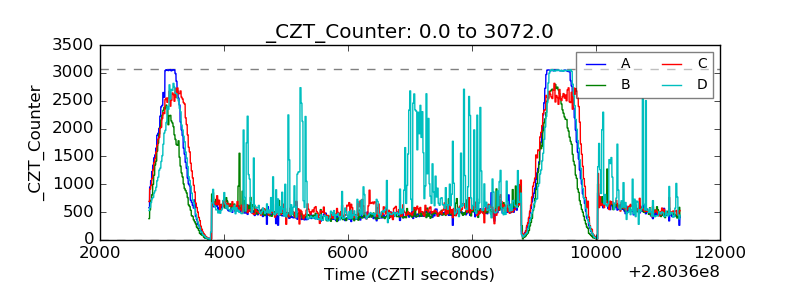 |
| +2.5 Volts monitor |  |
| +5 Volts monitor | 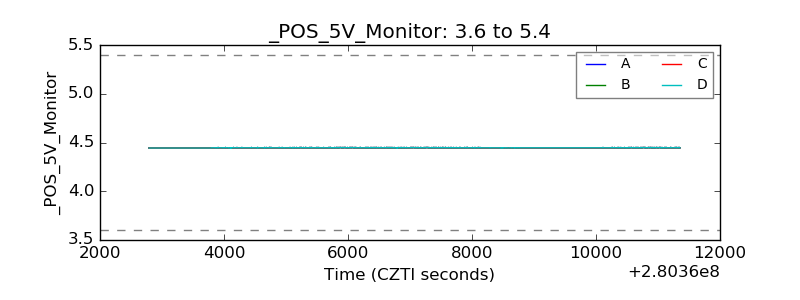 |
| _ROLL_ROT | 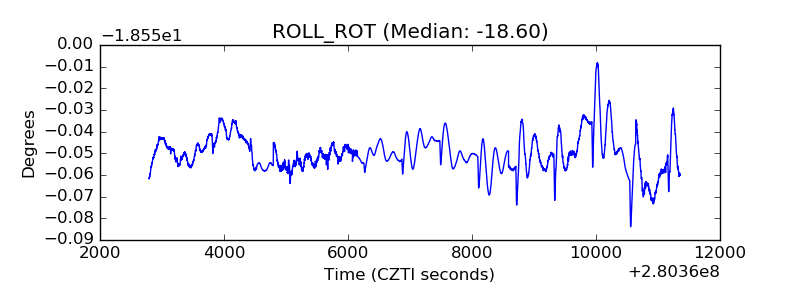 |
| _Roll_DEC | 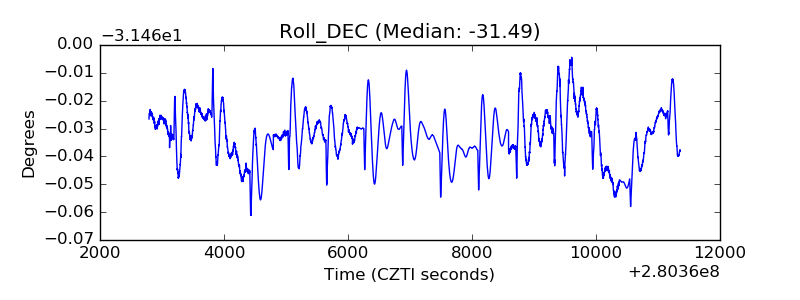 |
| _Roll_RA |  |
| Veto Counter | 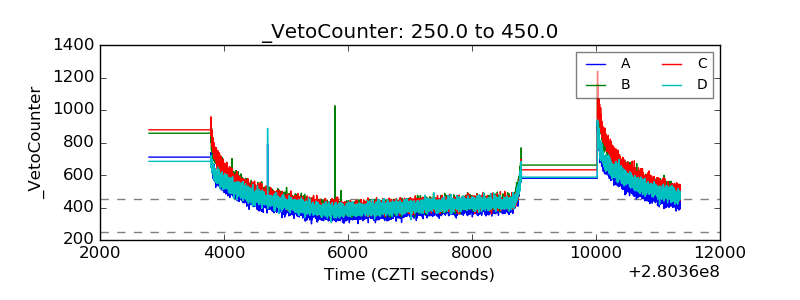 |