| Param | Original file | Final file |
|---|---|---|
| Filename | modeM0/AS1A05_143T01_9000002524_17007cztM0_level2.evt | modeM0/AS1A05_143T01_9000002524_17007cztM0_level2_quad_clean.evt |
| Size (bytes) | 43,064,640 | 12,061,440 |
| Size | 41.1 MB | 11.5 MB |
| Events in quadrant A | 270,610 | 81,922 |
| Events in quadrant B | 292,735 | 86,134 |
| Events in quadrant C | 296,299 | 81,623 |
| Events in quadrant D | 410,393 | 75,526 |
| Mode M9 | |||
|---|---|---|---|
| Quadrant | BADHDUFLAG | Total packets | Discarded packets |
| A | 0 | 5 | 0 |
| B | 0 | 6 | 0 |
| C | 0 | 6 | 0 |
| D | 0 | 6 | 0 |
| Mode SS | |||
|---|---|---|---|
| Quadrant | BADHDUFLAG | Total packets | Discarded packets |
| A | 0 | 10 | 0 |
| B | 0 | 10 | 0 |
| C | 0 | 10 | 0 |
| D | 0 | 10 | 0 |
| Mode M0 | |||
|---|---|---|---|
| Quadrant | BADHDUFLAG | Total packets | Discarded packets |
| A | 0 | 1099 | 1 |
| B | 0 | 1226 | 1 |
| C | 0 | 1260 | 1 |
| D | 0 | 1539 | 1 |
| Quadrant | Total seconds | Saturated seconds | Saturation percentage |
|---|---|---|---|
| A | 448 | 2 | 0.446429% |
| B | 448 | 4 | 0.892857% |
| C | 448 | 11 | 2.455357% |
| D | 448 | 38 | 8.482143% |
Noise dominated data is calculated using 1-second bins in cleaned event files. If a bin has >2000 counts, and if more than 50% of those come from <1% of pixels, then it is considered to be noise-dominated and hence unusable.
| Quadrant | # 1 sec bins | Bins with >0 counts | Bins with >2000 counts | High rate bins dominated by noise | Noise dominated (total time) | Noise dominated (detector-on time) | Marked lightcurve |
|---|---|---|---|---|---|---|---|
| A | 449 | 449 | 0 | 0 | 0.00% | 0.00% | 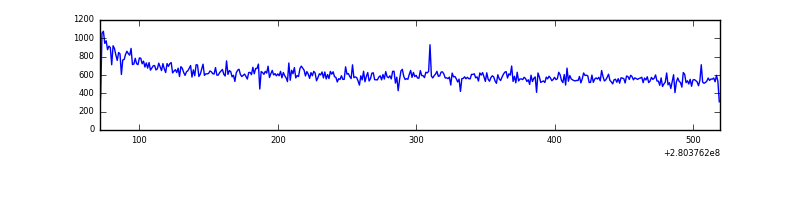 |
| B | 449 | 449 | 1 | 1 | 0.22% | 0.22% | 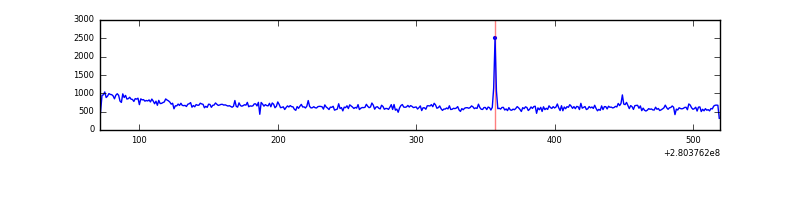 |
| C | 449 | 449 | 0 | 0 | 0.00% | 0.00% | 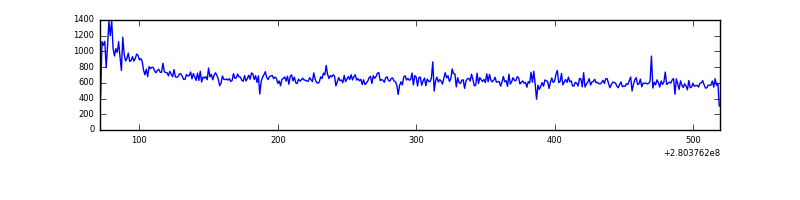 |
| D | 449 | 449 | 30 | 30 | 6.68% | 6.68% | 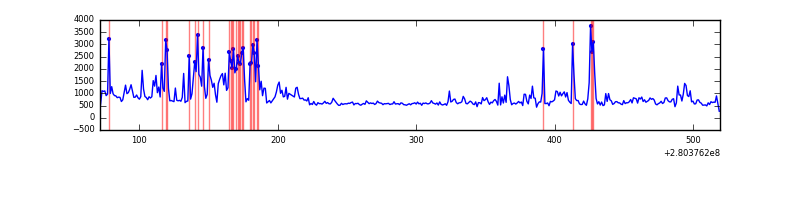 |
Top three noisy pixels from each quadrant. If the there are fewer than three noisy pixels in the level2.evt file, extra rows are filled as -1
| Pixel properties | Quadrant properties | ||||||
|---|---|---|---|---|---|---|---|
| Quadrant | DetID | PixID | Counts | Sigma | Mean | Median | Sigma |
| A | 0 | 226 | 583 | 31.58 | 70 | 68 | 16.3 |
| A | 12 | 194 | 493 | 26.06 | 70 | 68 | 16.3 |
| A | 3 | 137 | 435 | 22.5 | 70 | 68 | 16.3 |
| B | 4 | 48 | 3506 | 220.6 | 72 | 70 | 15.6 |
| B | 0 | 230 | 2686 | 167.96 | 72 | 70 | 15.6 |
| B | 14 | 1 | 1737 | 107.03 | 72 | 70 | 15.6 |
| C | 3 | 233 | 10999 | 590.13 | 70 | 70 | 18.5 |
| C | 14 | 238 | 10520 | 564.27 | 70 | 70 | 18.5 |
| C | 9 | 54 | 868 | 43.09 | 70 | 70 | 18.5 |
| D | 1 | 52 | 152816 | 8440.35 | 66 | 64 | 18.1 |
| D | 4 | 239 | 3122 | 168.97 | 66 | 64 | 18.1 |
| D | 3 | 238 | 1517 | 80.29 | 66 | 64 | 18.1 |
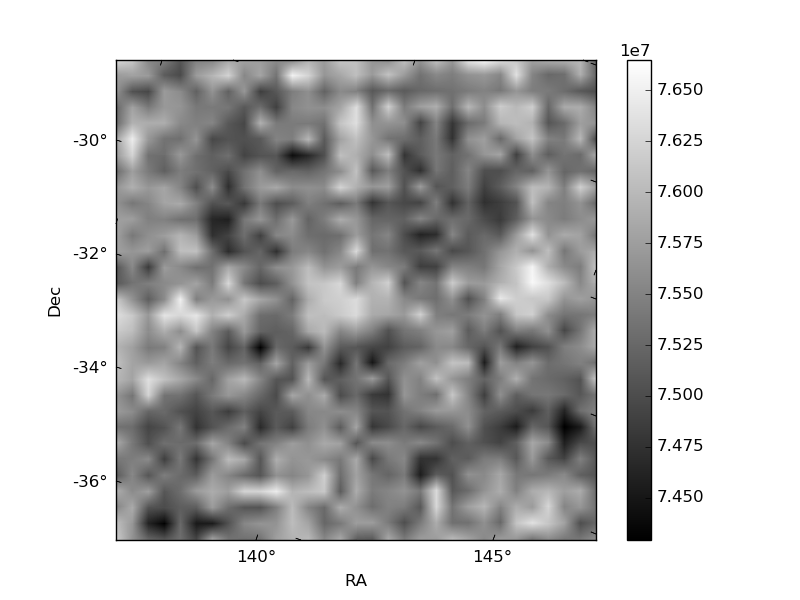
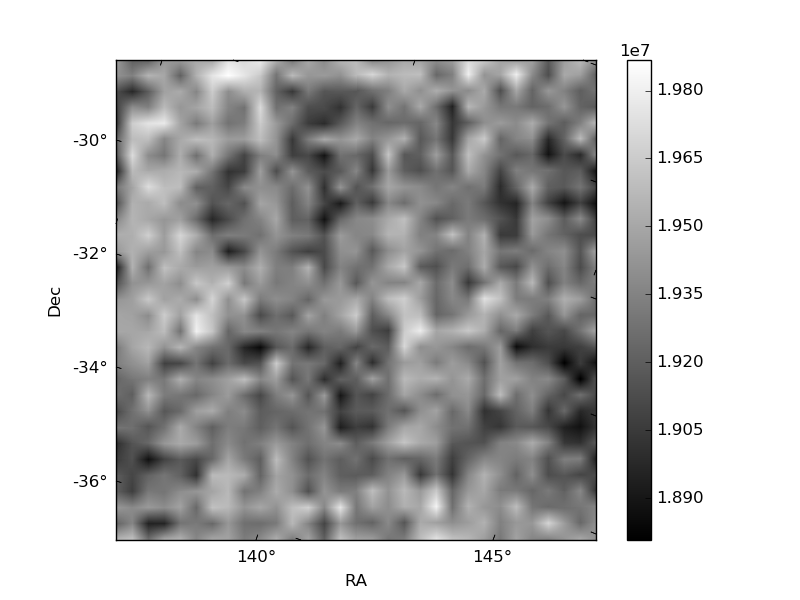
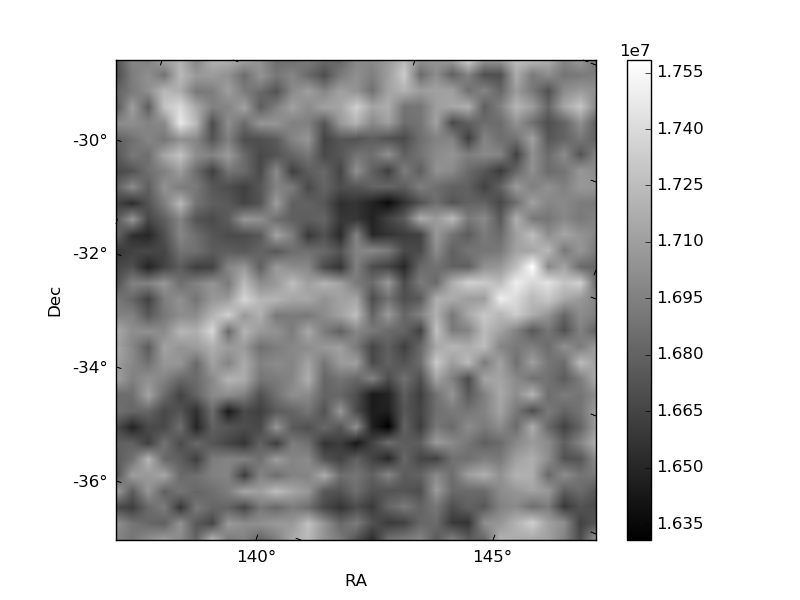
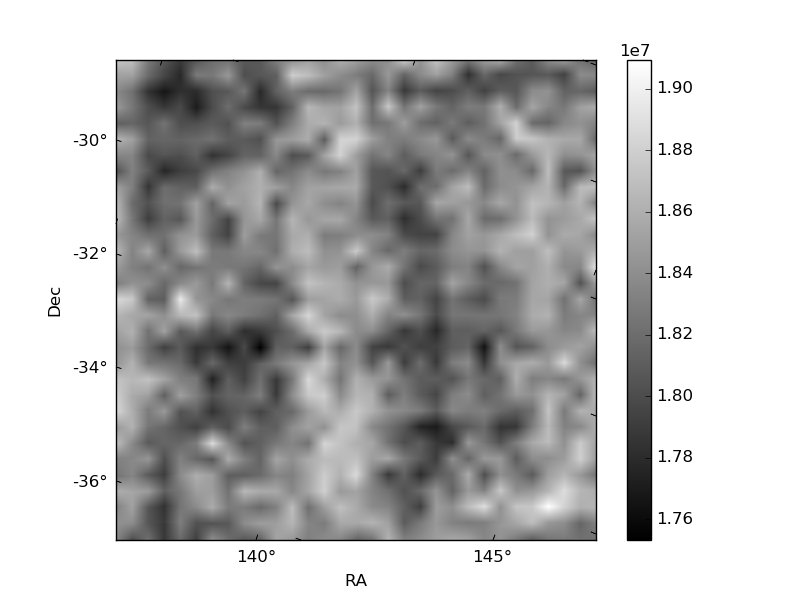
Histogram calculated using DETX and DETY for each event in the final _common_clean file
| Quadrant A | 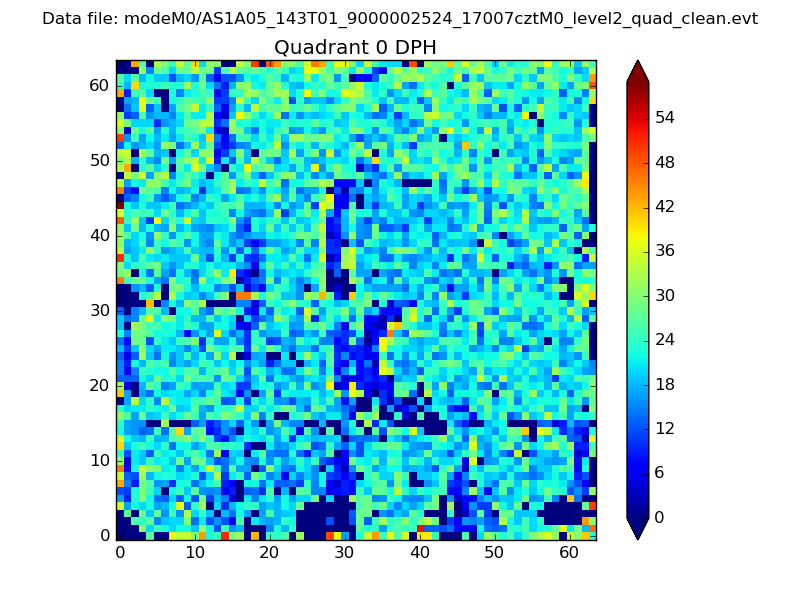 |
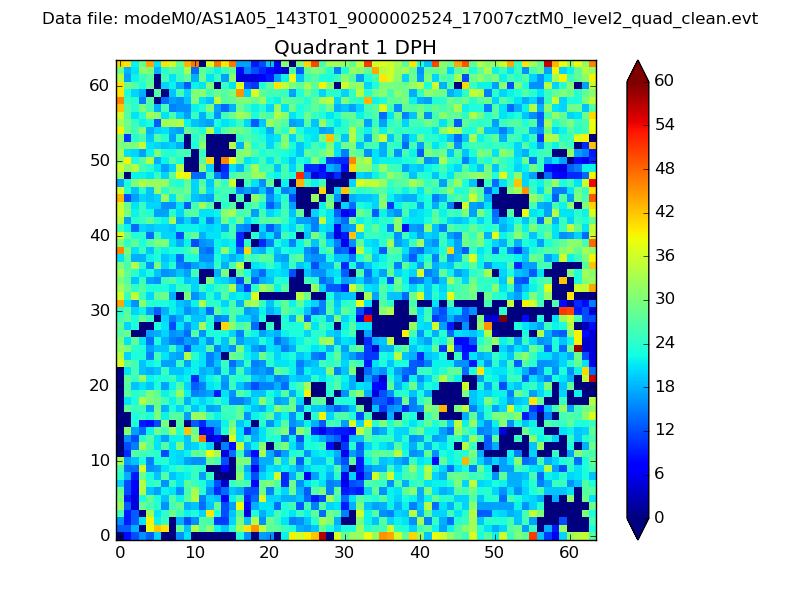 |
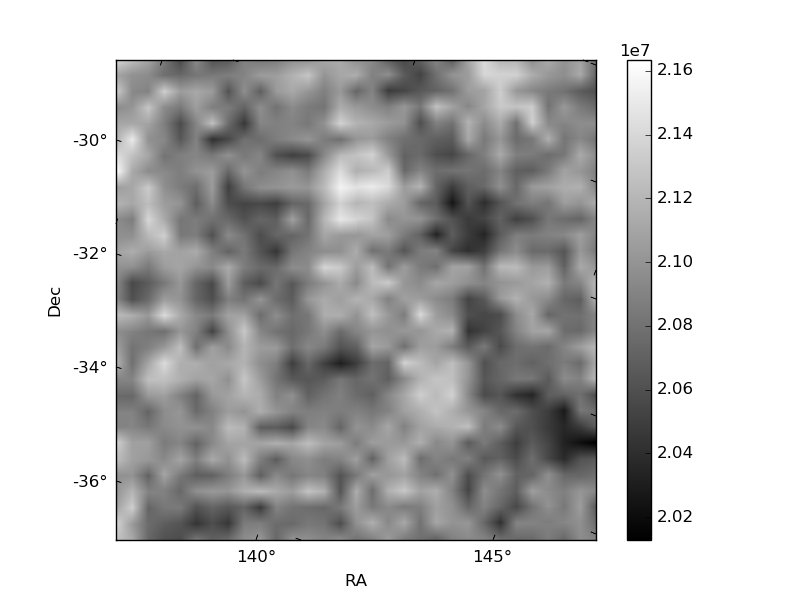
Quadrant B |
|---|---|---|---|
| Quadrant D | 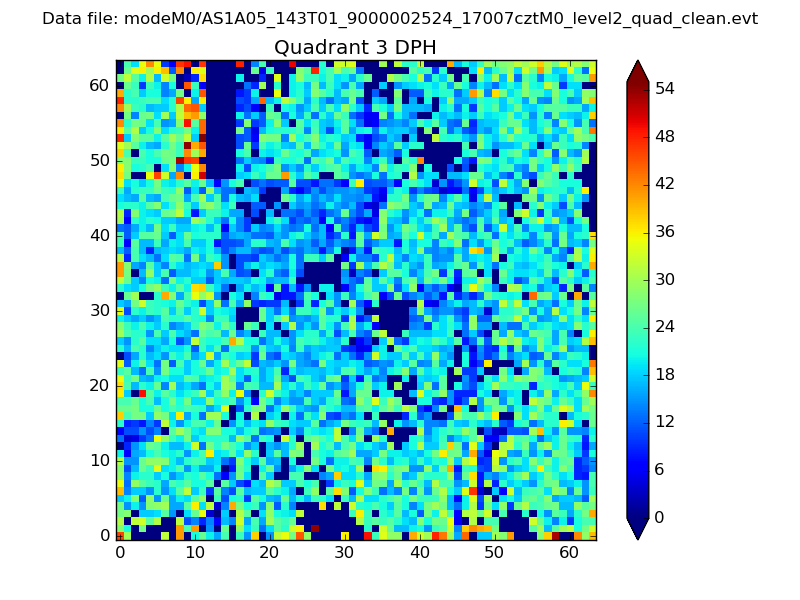 |
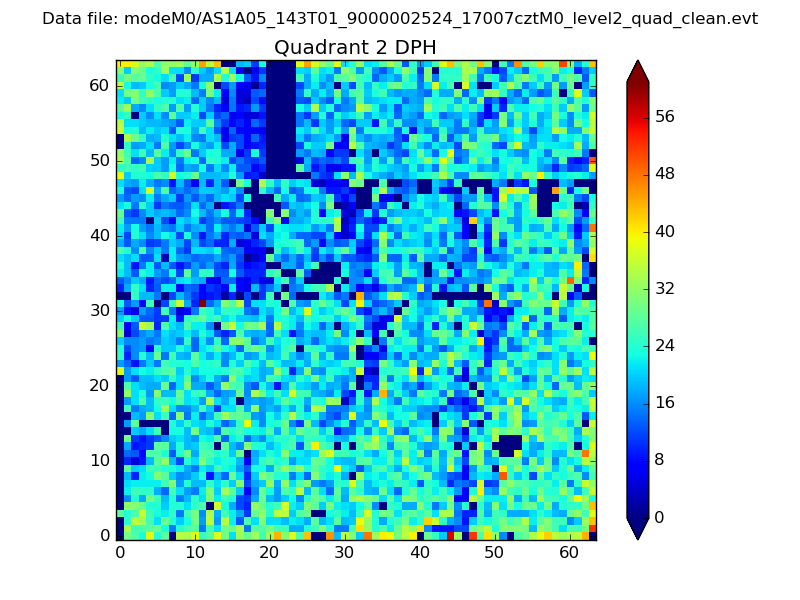 |
Quadrant C |
| Plot type | Count rate plots | Images |
|---|---|---|
| Comparison with Poisson distribution Blue bars denote a histogram of data divided into 1 sec bins. Red curve is a Poisson curve with rate = median count rate of data. |
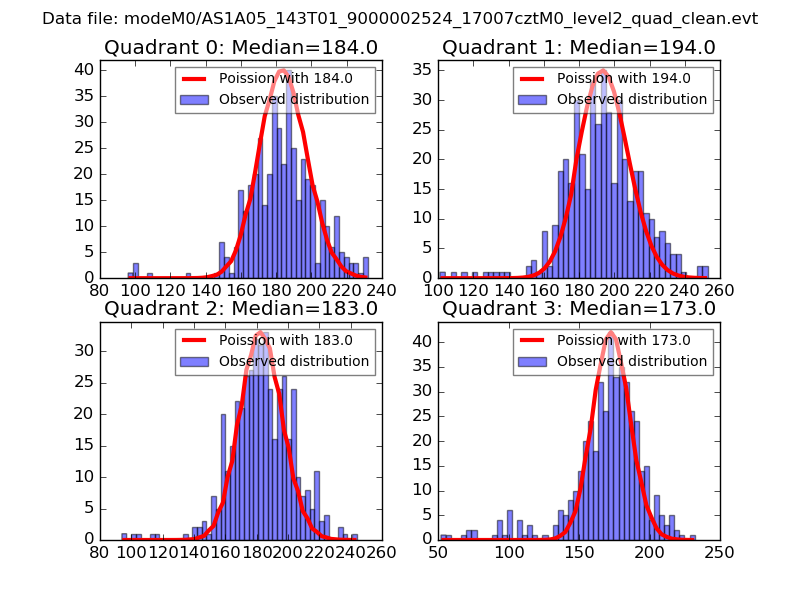 |
 |
| Quadrant-wise count rates Data is divided into 100 sec bins |
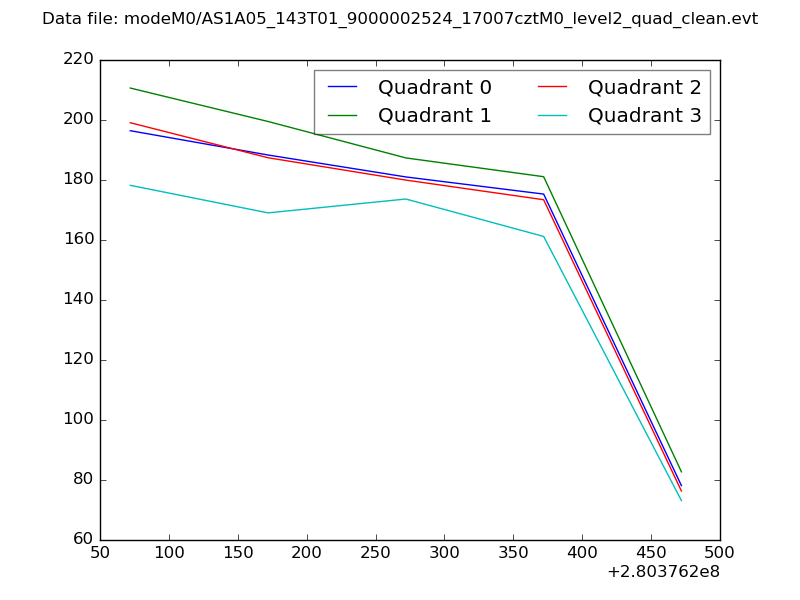 |
|
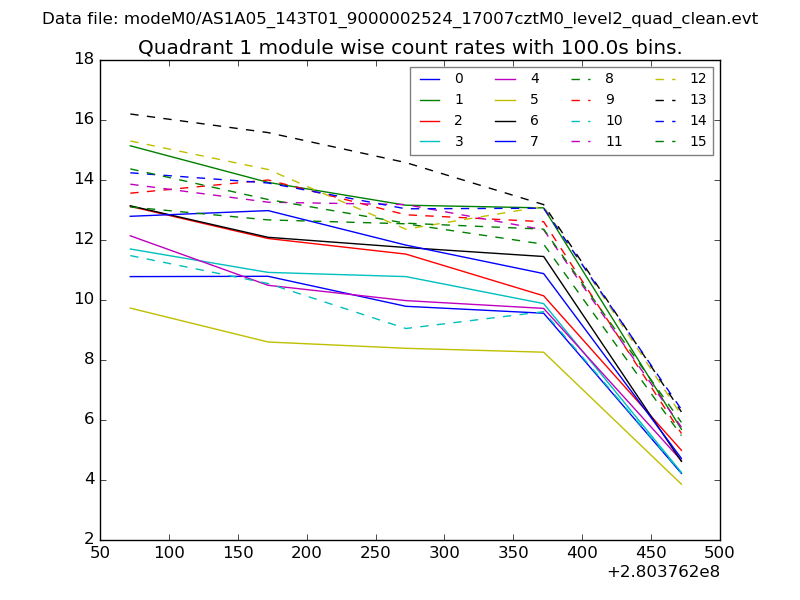
| Module-wise count rates for Quadrant A Data is divided into 100 sec bins |
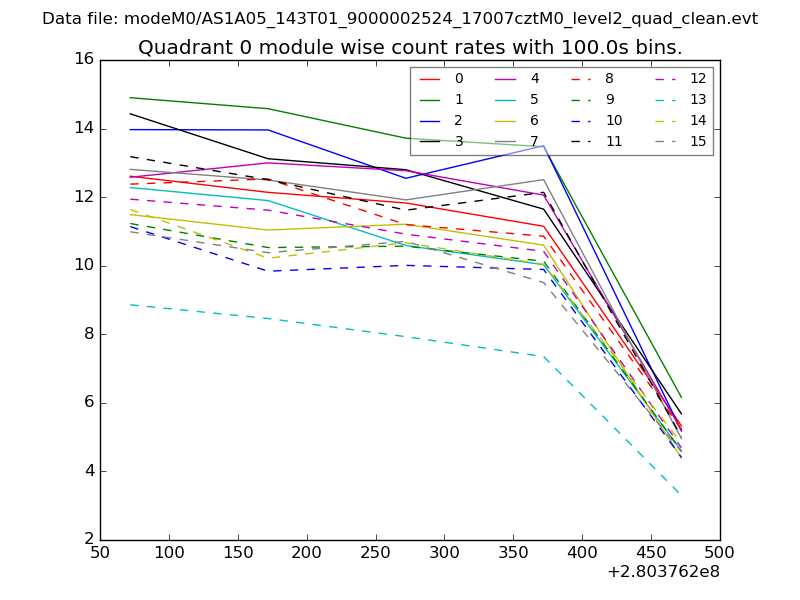 |
 |
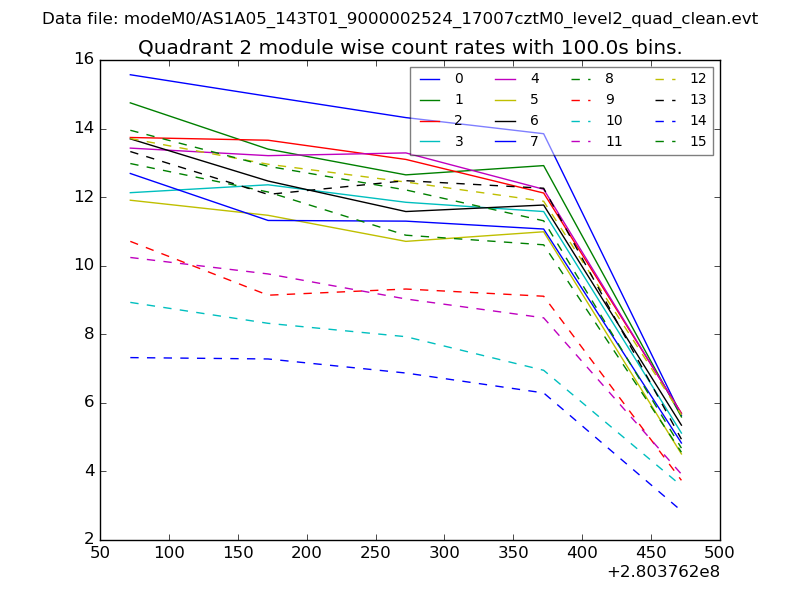
| Module-wise count rates for Quadrant B Data is divided into 100 sec bins |
 |
 |
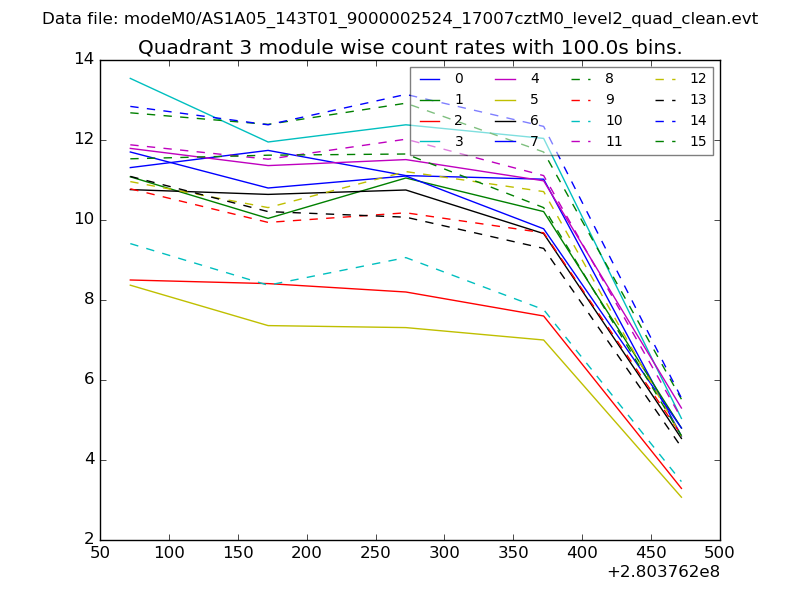
| Module-wise count rates for Quadrant C Data is divided into 100 sec bins |
 |
 |
| Module-wise count rates for Quadrant D Data is divided into 100 sec bins |
 |
 |
| Parameter | Plot |
|---|---|
| CZT HV Monitor | 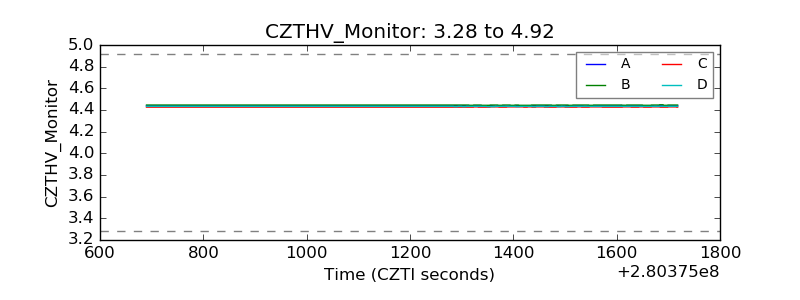 |
| D_VDD | 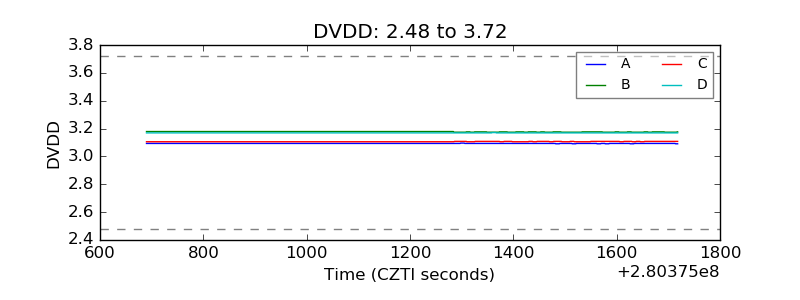 |
| Temperature 1 | 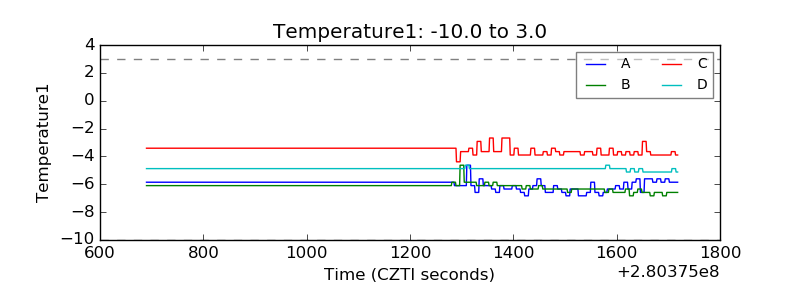 |
| Veto HV Monitor | 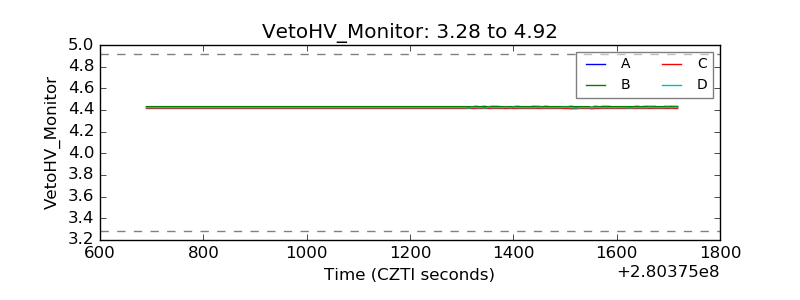 |
| Veto LLD | 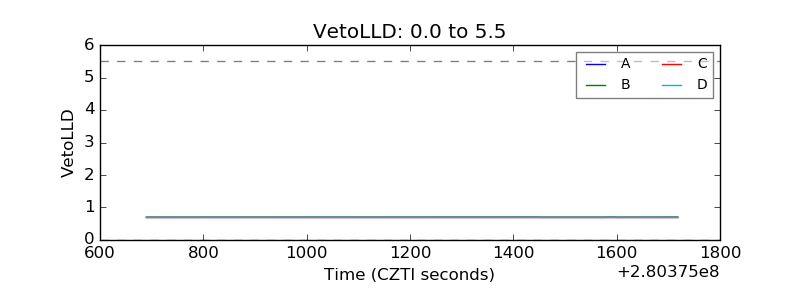 |
| Alpha Counter | 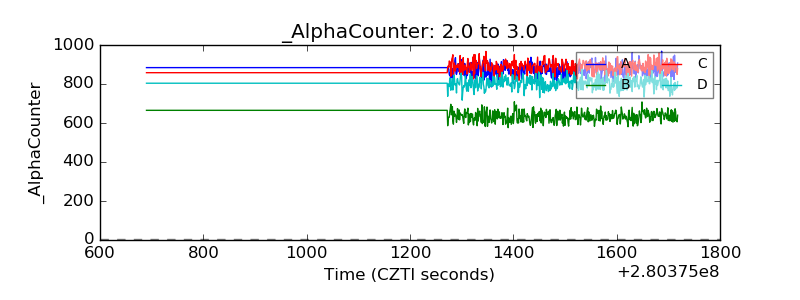 |
| _CPM_Rate | 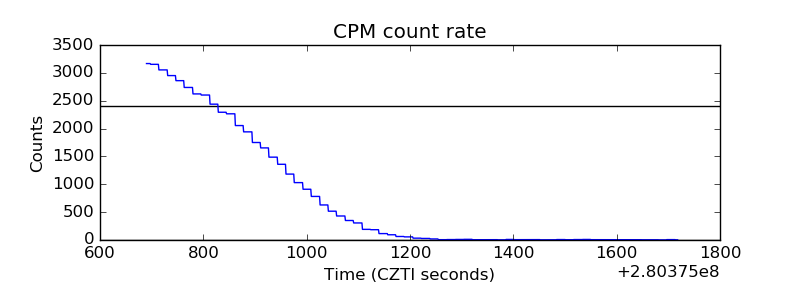 |
| CZT Counter | 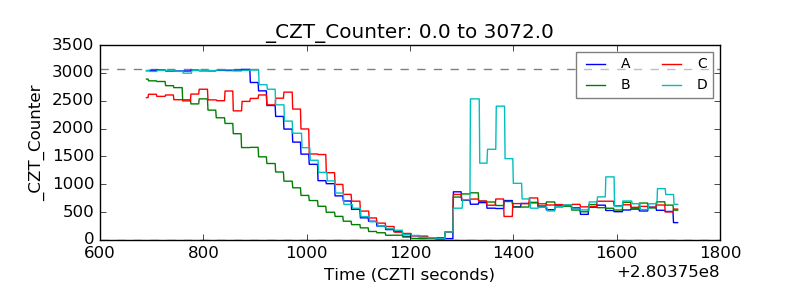 |
| +2.5 Volts monitor | 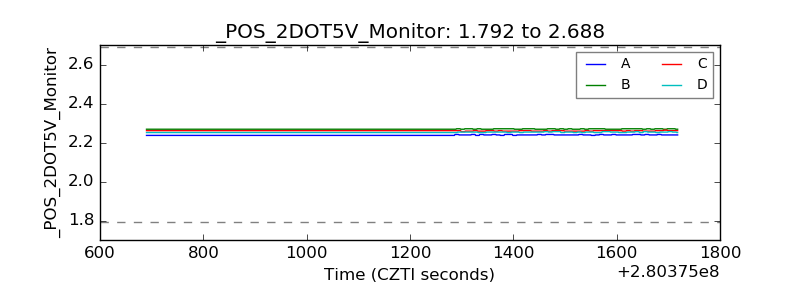 |
| +5 Volts monitor | 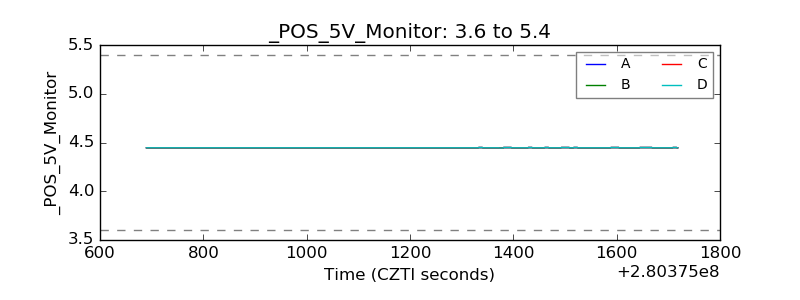 |
| _ROLL_ROT | 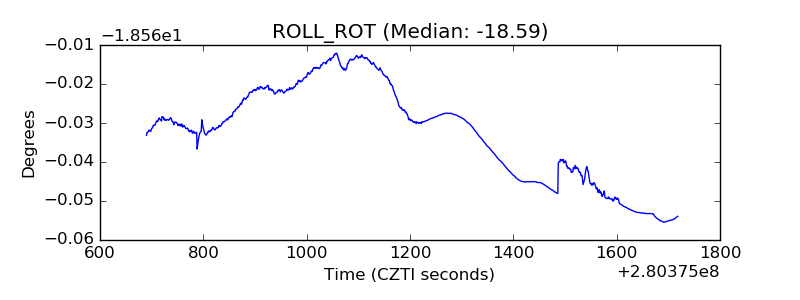 |
| _Roll_DEC | 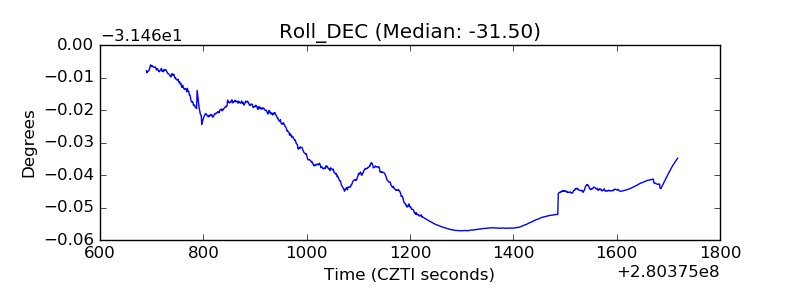 |
| _Roll_RA | 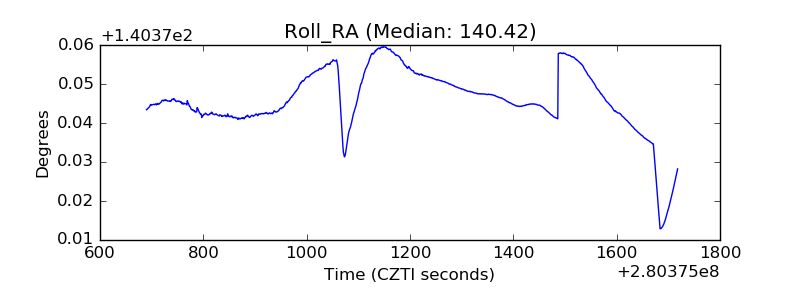 |
| Veto Counter | 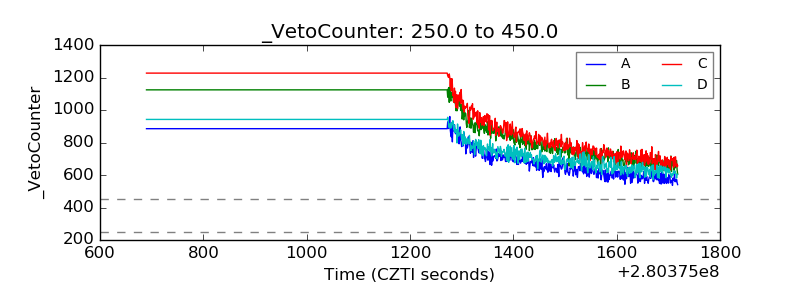 |