| Param | Original file | Final file |
|---|---|---|
| Filename | modeM0/AS1T03_058T01_9000002522cztM0_level2.fits | modeM0/AS1T03_058T01_9000002522cztM0_level2_quad_clean.evt |
| Size (bytes) | 508,060,800 | 537,220,800 |
| Size | 484.5 MB | 512.3 MB |
| Events in quadrant A | 3,145,436 | 3,356,568 |
| Events in quadrant B | 2,995,170 | 3,338,216 |
| Events in quadrant C | 3,075,316 | 3,201,468 |
| Events in quadrant D | 2,607,332 | 2,812,711 |
| Mode M9 | |||
|---|---|---|---|
| Quadrant | BADHDUFLAG | Total packets | Discarded packets |
| A | 0 | 81 | 0 |
| B | 0 | 81 | 0 |
| C | 0 | 81 | 0 |
| D | 0 | 81 | 0 |
| Mode M0 | |||
|---|---|---|---|
| Quadrant | BADHDUFLAG | Total packets | Discarded packets |
| A | 0 | 110995 | 0 |
| B | 0 | 117770 | 0 |
| C | 0 | 136792 | 0 |
| D | 0 | 149611 | 0 |
| Mode SS | |||
|---|---|---|---|
| Quadrant | BADHDUFLAG | Total packets | Discarded packets |
| A | 0 | 1060 | 0 |
| B | 0 | 1060 | 0 |
| C | 0 | 1060 | 0 |
| D | 0 | 1060 | 0 |
| Quadrant | Total seconds | Saturated seconds | Saturation percentage |
|---|---|---|---|
| A | 51893 | 938 | 1.807566% |
| B | 51893 | 1315 | 2.534060% |
| C | 51893 | 1579 | 3.042800% |
| D | 51893 | 4295 | 8.276646% |
Noise dominated data is calculated using 1-second bins in cleaned event files. If a bin has >2000 counts, and if more than 50% of those come from <1% of pixels, then it is considered to be noise-dominated and hence unusable.
| Quadrant | # 1 sec bins | Bins with >0 counts | Bins with >2000 counts | High rate bins dominated by noise | Noise dominated (total time) | Noise dominated (detector-on time) | Marked lightcurve |
|---|---|---|---|---|---|---|---|
| A | 60109 | 51893 | 0 | 0 | 0.00% | 0.00% |  |
| B | 60109 | 51888 | 0 | 0 | 0.00% | 0.00% |  |
| C | 60109 | 51891 | 0 | 0 | 0.00% | 0.00% | 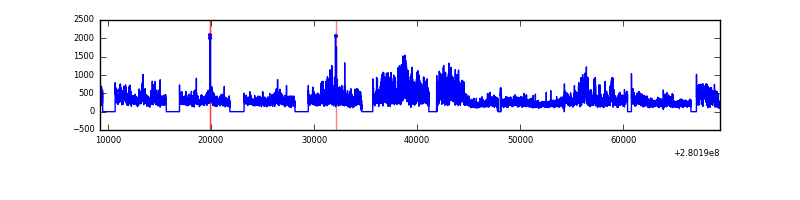 |
| D | 60109 | 51761 | 0 | 0 | 0.00% | 0.00% |  |
Top three noisy pixels from each quadrant. If the there are fewer than three noisy pixels in the level2.evt file, extra rows are filled as -1
| Pixel properties | Quadrant properties | ||||||
|---|---|---|---|---|---|---|---|
| Quadrant | DetID | PixID | Counts | Sigma | Mean | Median | Sigma |
| A | 0 | 29 | 2956 | 10.84 | 818 | 770 | 201.6 |
| A | 7 | 110 | 2534 | 8.75 | 818 | 770 | 201.6 |
| A | 0 | 30 | 2342 | 7.8 | 818 | 770 | 201.6 |
| B | 2 | 9 | 2299 | 10.17 | 795 | 766 | 150.7 |
| B | 5 | 128 | 2025 | 8.35 | 795 | 766 | 150.7 |
| B | 2 | 8 | 2005 | 8.22 | 795 | 766 | 150.7 |
| C | 1 | 80 | 2408 | 8.04 | 811 | 765 | 204.4 |
| C | 1 | 81 | 2316 | 7.59 | 811 | 765 | 204.4 |
| C | 12 | 241 | 2182 | 6.93 | 811 | 765 | 204.4 |
| D | 6 | 231 | 1887 | 6.18 | 743 | 680 | 195.2 |
| D | 3 | 14 | 1881 | 6.15 | 743 | 680 | 195.2 |
| D | 7 | 3 | 1838 | 5.93 | 743 | 680 | 195.2 |
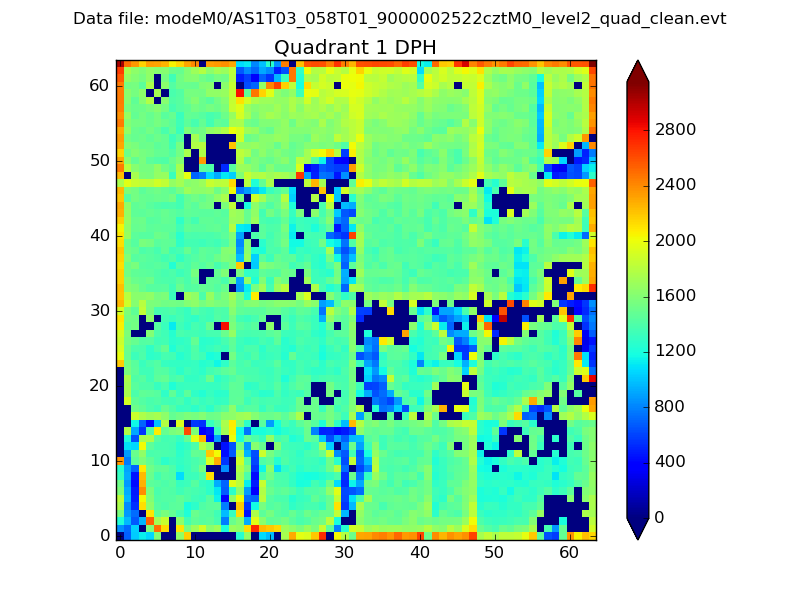
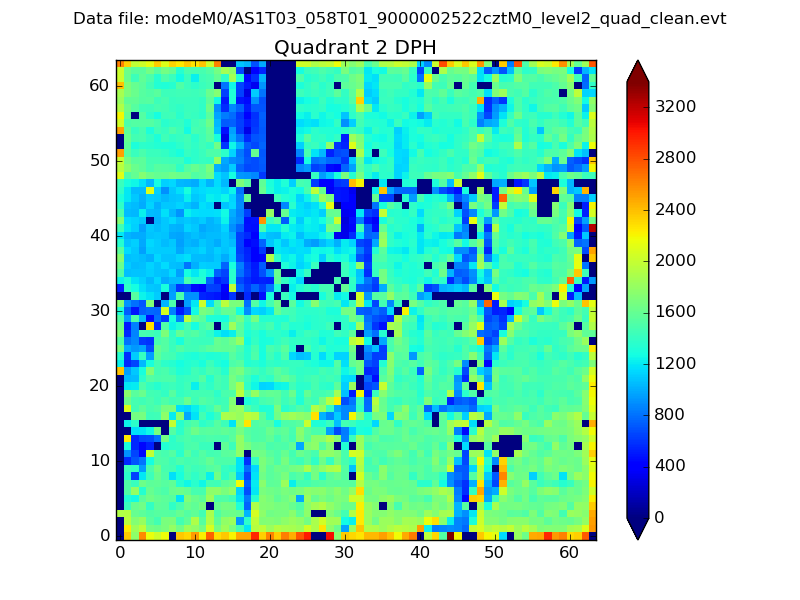
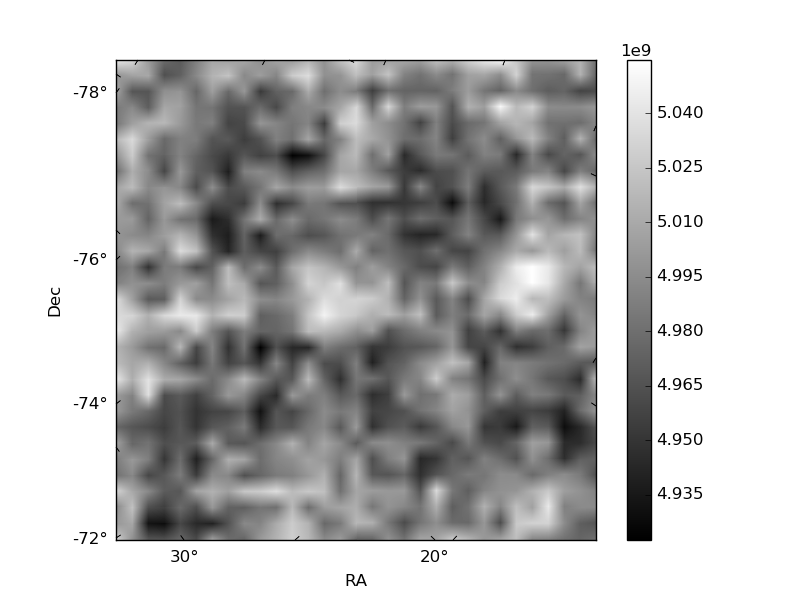
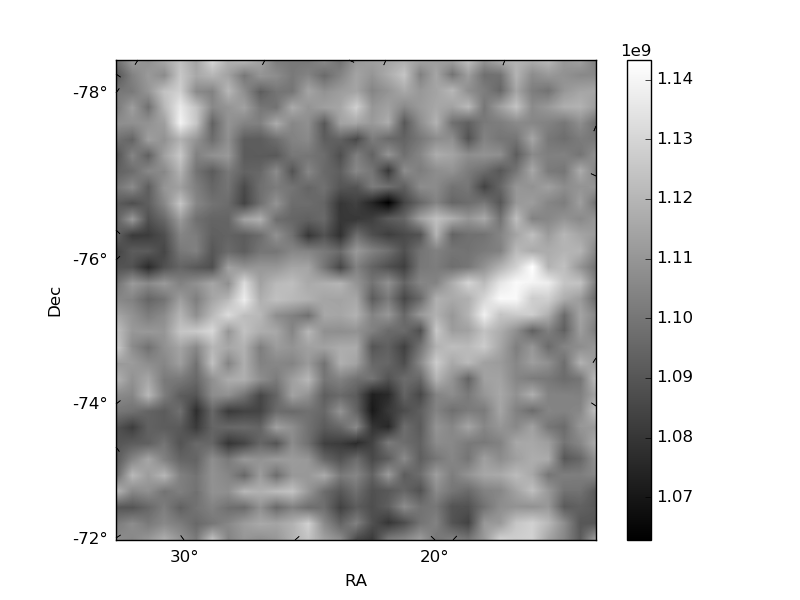
Histogram calculated using DETX and DETY for each event in the final _common_clean file
| Quadrant A |  |
 |
Quadrant B |
|---|---|---|---|
| Quadrant D | 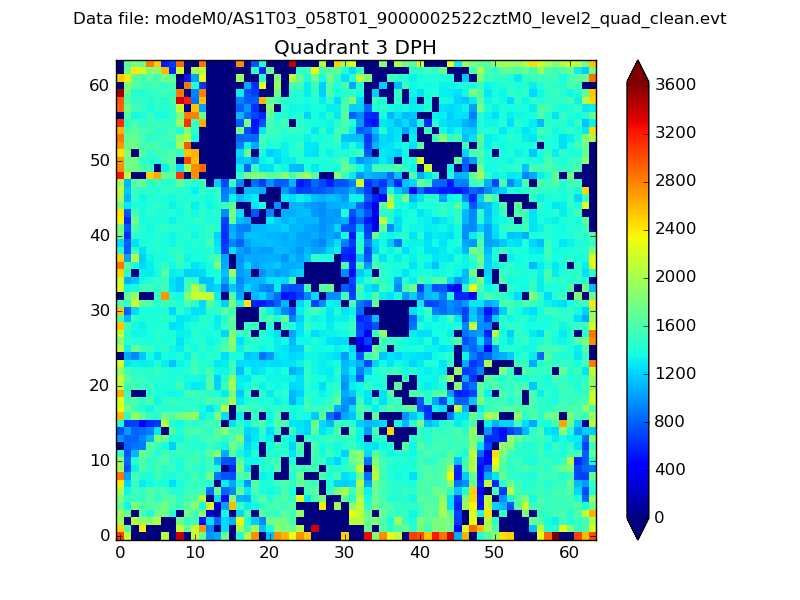 |
 |
Quadrant C |
| Plot type | Count rate plots | Images |
|---|---|---|
| Comparison with Poisson distribution Blue bars denote a histogram of data divided into 1 sec bins. Red curve is a Poisson curve with rate = median count rate of data. |
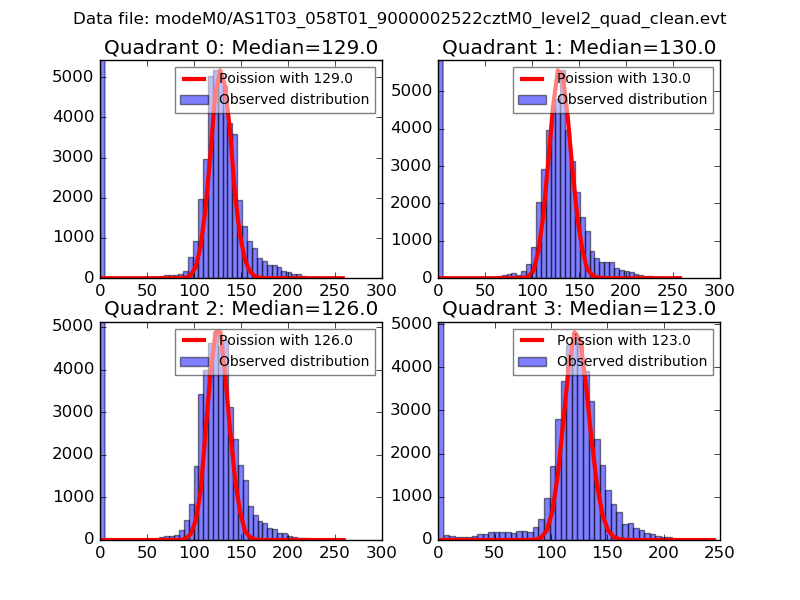 |
 |
| Quadrant-wise count rates Data is divided into 100 sec bins |
 |
|
| Module-wise count rates for Quadrant A Data is divided into 100 sec bins |
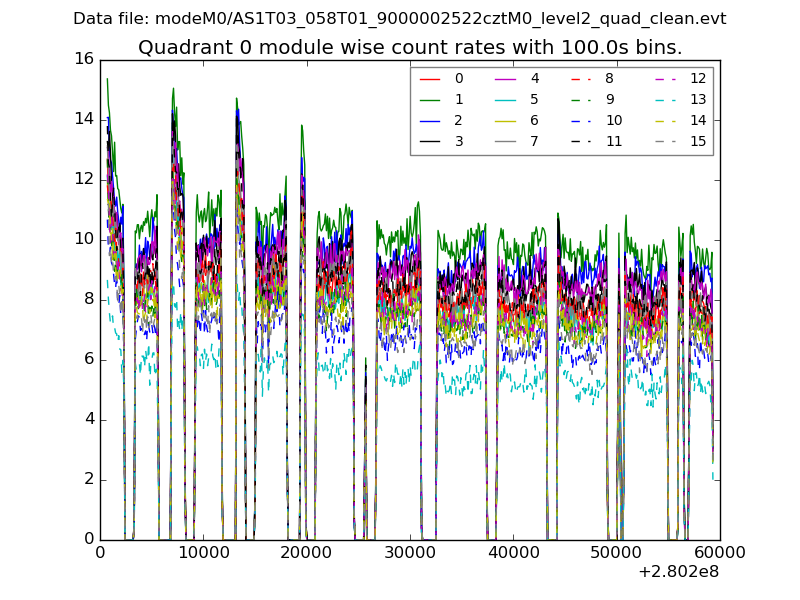 |
 |
| Module-wise count rates for Quadrant B Data is divided into 100 sec bins |
 |
 |
| Module-wise count rates for Quadrant C Data is divided into 100 sec bins |
 |
 |
| Module-wise count rates for Quadrant D Data is divided into 100 sec bins |
 |
 |
| Parameter | Plot |
|---|---|
| CZT HV Monitor |  |
| D_VDD | 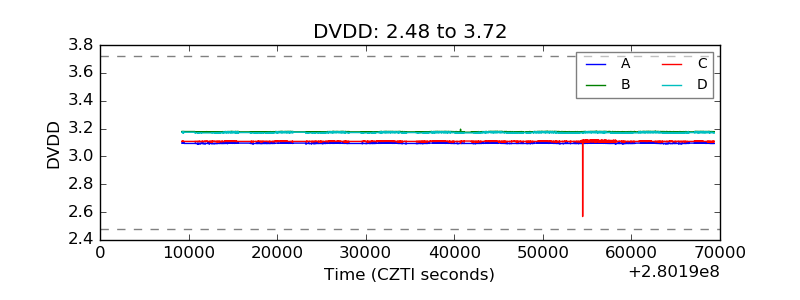 |
| Temperature 1 | 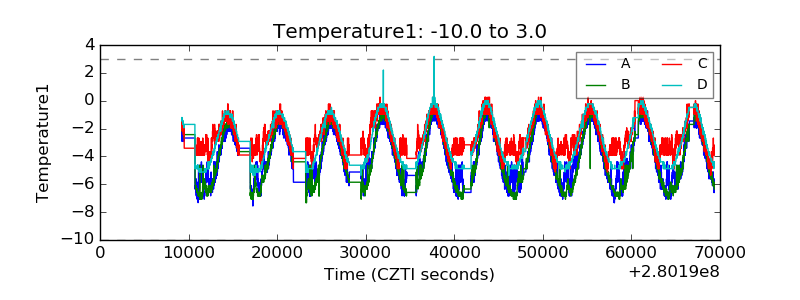 |
| Veto HV Monitor |  |
| Veto LLD | 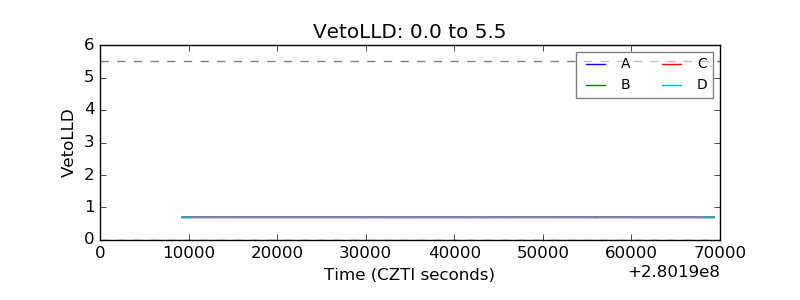 |
| Alpha Counter | 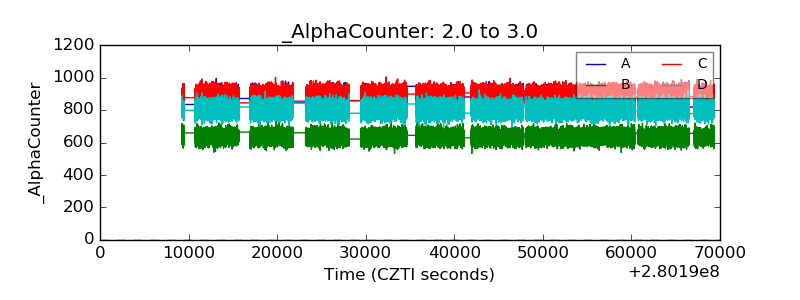 |
| _CPM_Rate |  |
| CZT Counter | 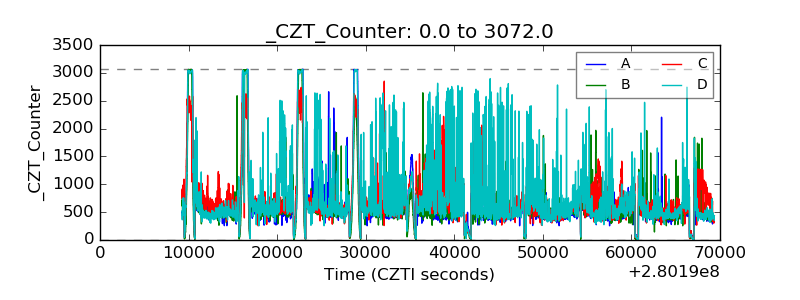 |
| +2.5 Volts monitor |  |
| +5 Volts monitor |  |
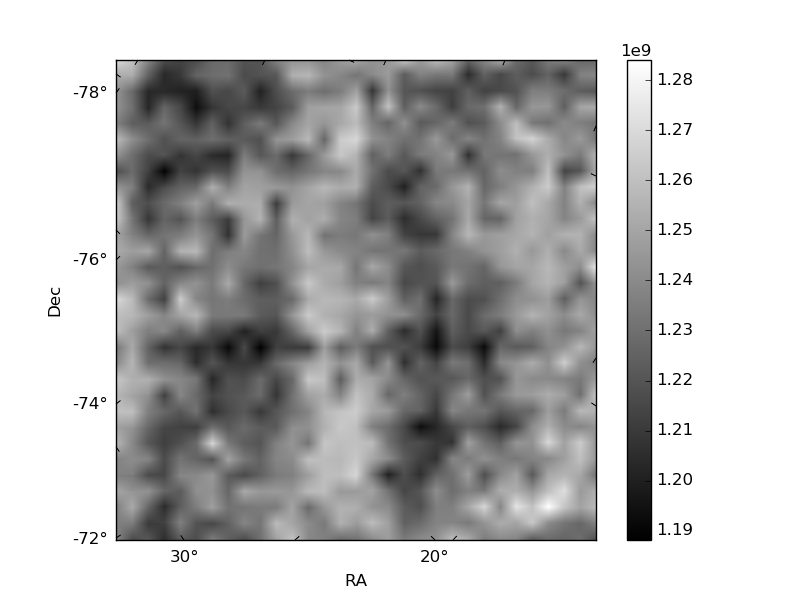
| _ROLL_ROT |  |
| _Roll_DEC |  |
| _Roll_RA | 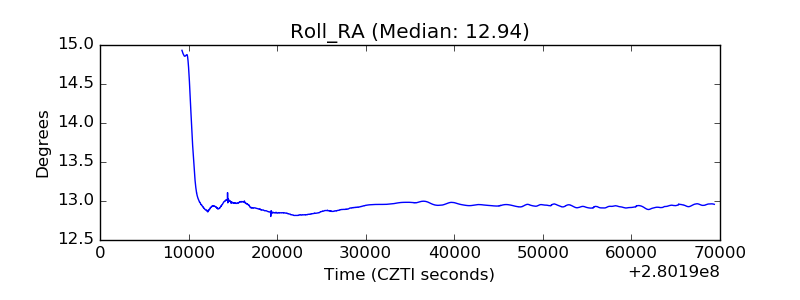 |
| Veto Counter |  |