| Param | Original file | Final file |
|---|---|---|
| Filename | modeM0/AS1T03_058T01_9000002522_16976cztM0_level2.evt | modeM0/AS1T03_058T01_9000002522_16976cztM0_level2_quad_clean.evt |
| Size (bytes) | 147,576,960 | 38,776,320 |
| Size | 140.7 MB | 37.0 MB |
| Events in quadrant A | 906,516 | 265,229 |
| Events in quadrant B | 1,010,815 | 273,916 |
| Events in quadrant C | 1,353,013 | 256,905 |
| Events in quadrant D | 1,078,467 | 250,405 |
| Mode M9 | |||
|---|---|---|---|
| Quadrant | BADHDUFLAG | Total packets | Discarded packets |
| A | 0 | 12 | 0 |
| B | 0 | 12 | 0 |
| C | 0 | 12 | 0 |
| D | 0 | 12 | 0 |
| Mode M0 | |||
|---|---|---|---|
| Quadrant | BADHDUFLAG | Total packets | Discarded packets |
| A | 0 | 3732 | 1 |
| B | 0 | 4111 | 1 |
| C | 0 | 5347 | 1 |
| D | 0 | 4308 | 1 |
| Mode SS | |||
|---|---|---|---|
| Quadrant | BADHDUFLAG | Total packets | Discarded packets |
| A | 0 | 38 | 0 |
| B | 0 | 38 | 0 |
| C | 0 | 38 | 0 |
| D | 0 | 38 | 0 |
| Quadrant | Total seconds | Saturated seconds | Saturation percentage |
|---|---|---|---|
| A | 1733 | 8 | 0.461627% |
| B | 1733 | 26 | 1.500289% |
| C | 1733 | 62 | 3.577611% |
| D | 1733 | 39 | 2.250433% |
Noise dominated data is calculated using 1-second bins in cleaned event files. If a bin has >2000 counts, and if more than 50% of those come from <1% of pixels, then it is considered to be noise-dominated and hence unusable.
| Quadrant | # 1 sec bins | Bins with >0 counts | Bins with >2000 counts | High rate bins dominated by noise | Noise dominated (total time) | Noise dominated (detector-on time) | Marked lightcurve |
|---|---|---|---|---|---|---|---|
| A | 2949 | 1735 | 0 | 0 | 0.00% | 0.00% | 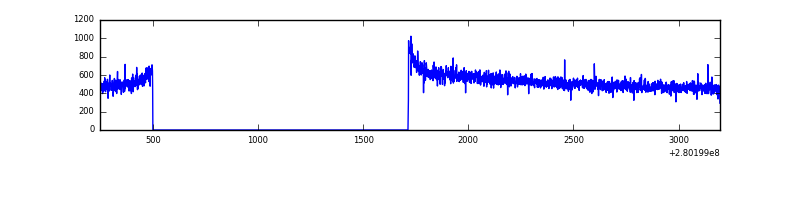 |
| B | 2949 | 1735 | 6 | 6 | 0.20% | 0.35% | 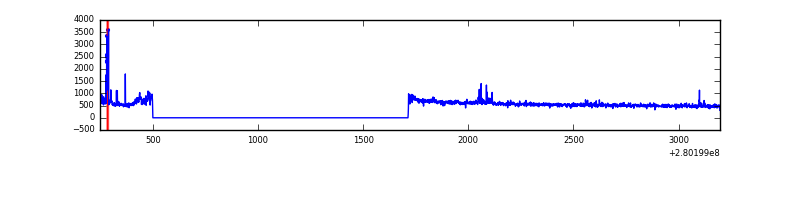 |
| C | 2949 | 1735 | 0 | 0 | 0.00% | 0.00% | 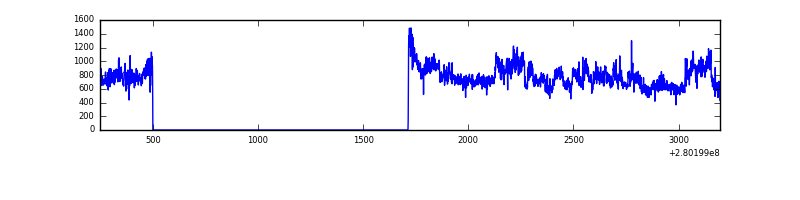 |
| D | 2949 | 1735 | 23 | 23 | 0.78% | 1.33% | 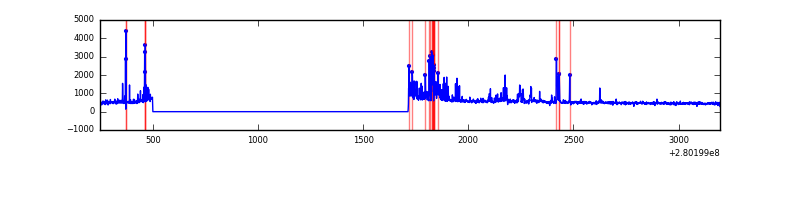 |
Top three noisy pixels from each quadrant. If the there are fewer than three noisy pixels in the level2.evt file, extra rows are filled as -1
| Pixel properties | Quadrant properties | ||||||
|---|---|---|---|---|---|---|---|
| Quadrant | DetID | PixID | Counts | Sigma | Mean | Median | Sigma |
| A | 0 | 226 | 2083 | 38.43 | 235 | 231 | 48.2 |
| A | 12 | 194 | 1731 | 31.13 | 235 | 231 | 48.2 |
| A | 3 | 137 | 1523 | 26.81 | 235 | 231 | 48.2 |
| B | 7 | 220 | 22641 | 491.35 | 239 | 233 | 45.6 |
| B | 4 | 216 | 13721 | 295.76 | 239 | 233 | 45.6 |
| B | 0 | 229 | 10189 | 218.31 | 239 | 233 | 45.6 |
| C | 3 | 233 | 402500 | 7382.42 | 232 | 234 | 54.5 |
| C | 14 | 238 | 37065 | 675.93 | 232 | 234 | 54.5 |
| C | 0 | 207 | 4986 | 87.21 | 232 | 234 | 54.5 |
| D | 1 | 52 | 194816 | 3430.39 | 229 | 222 | 56.7 |
| D | 2 | 152 | 10738 | 185.38 | 229 | 222 | 56.7 |
| D | 2 | 234 | 6881 | 117.39 | 229 | 222 | 56.7 |
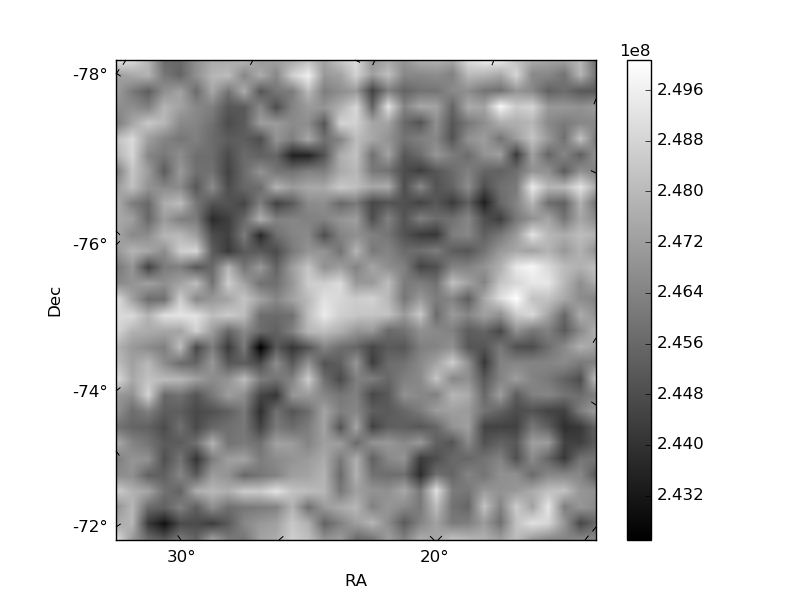
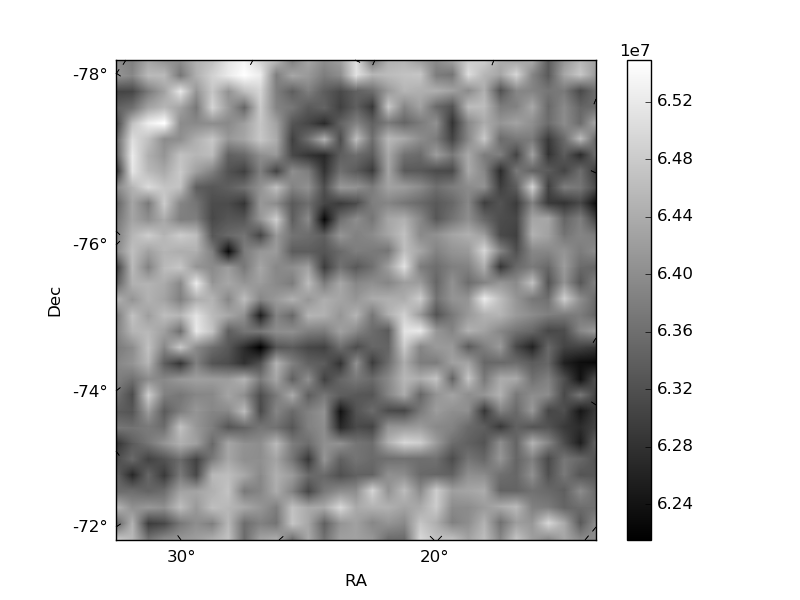
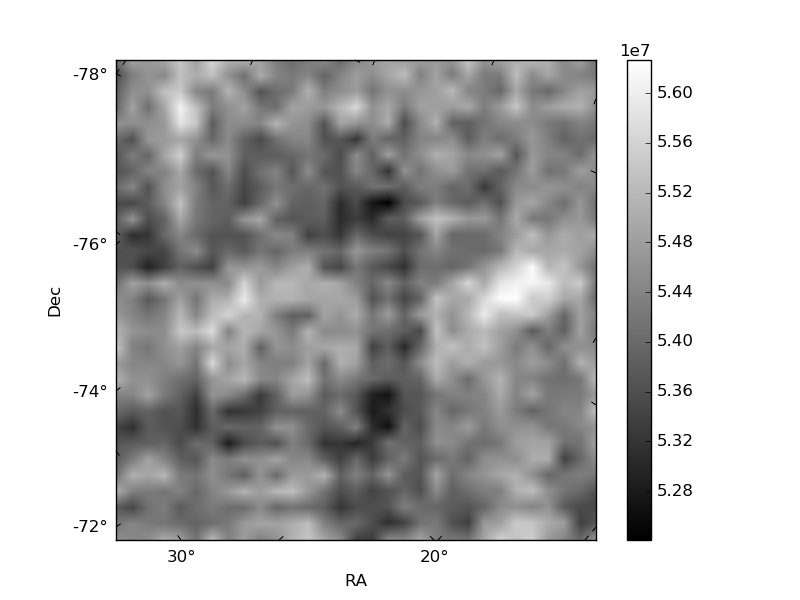
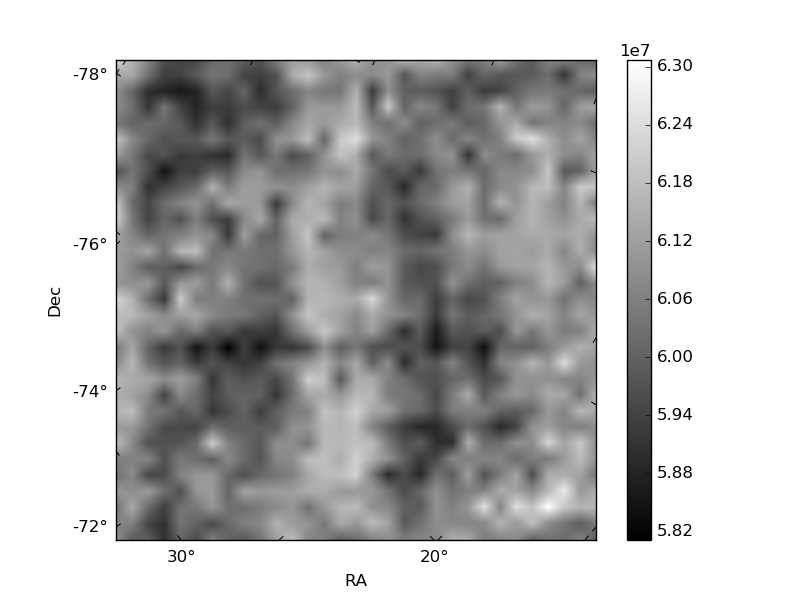
Histogram calculated using DETX and DETY for each event in the final _common_clean file
| Quadrant A | 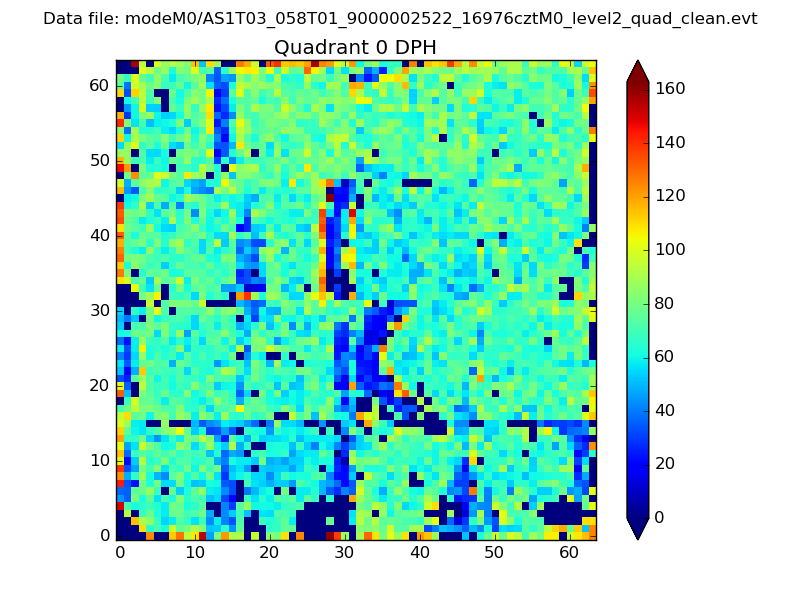 |
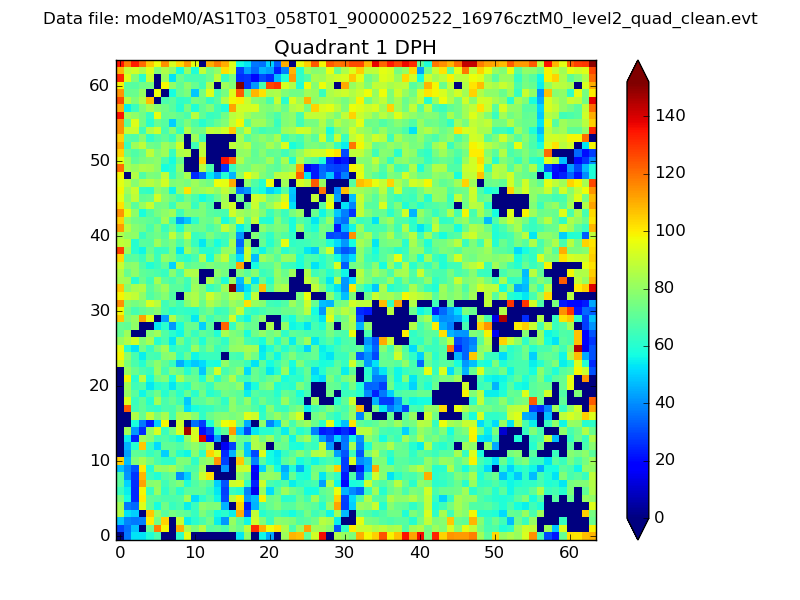 |
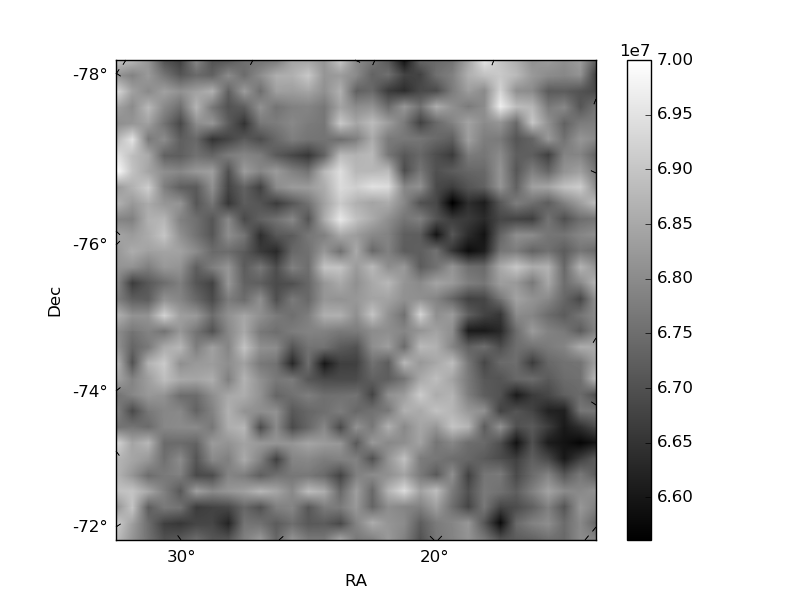
Quadrant B |
|---|---|---|---|
| Quadrant D | 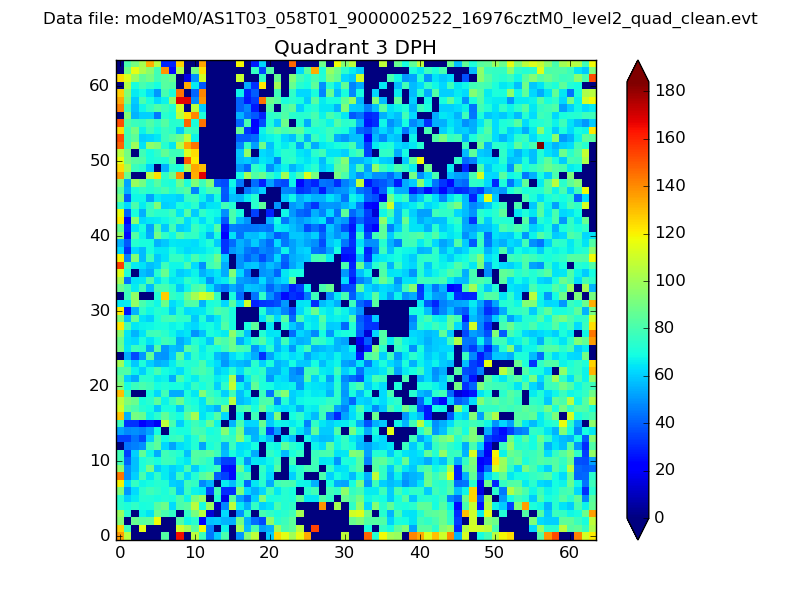 |
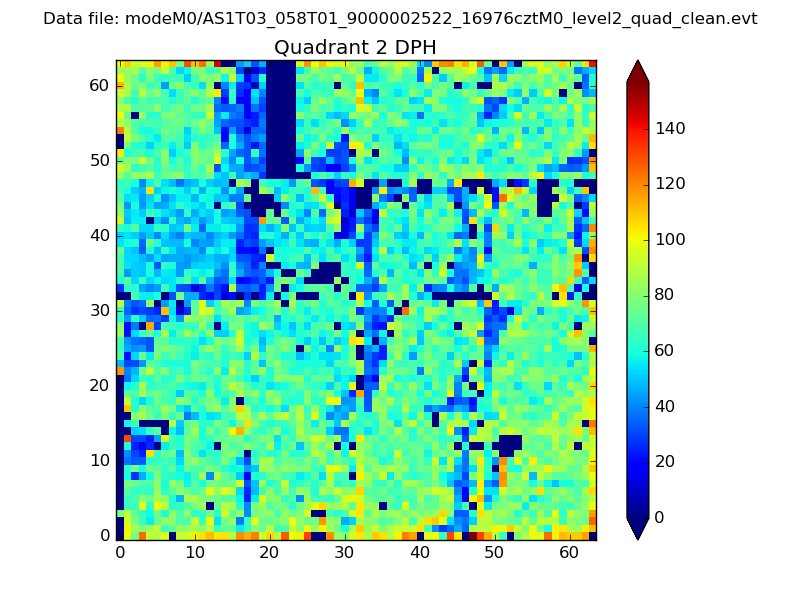 |
Quadrant C |
| Plot type | Count rate plots | Images |
|---|---|---|
| Comparison with Poisson distribution Blue bars denote a histogram of data divided into 1 sec bins. Red curve is a Poisson curve with rate = median count rate of data. |
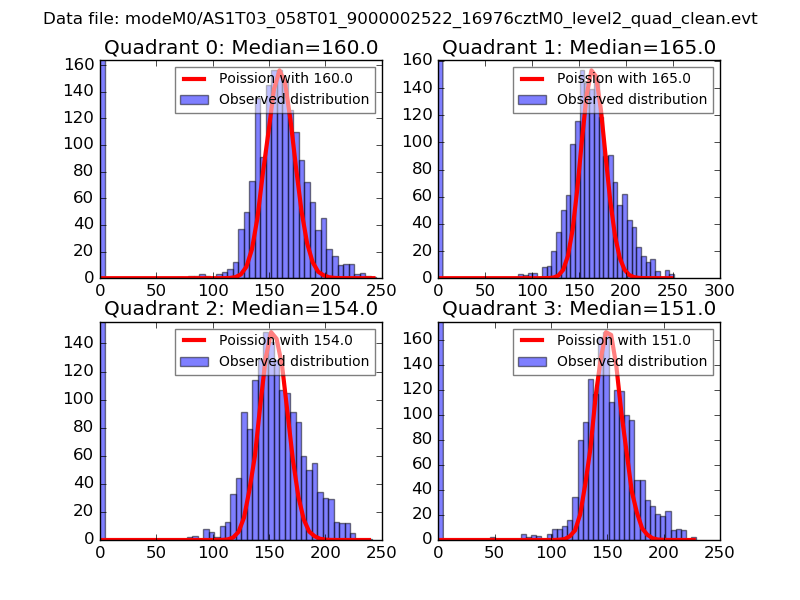 |
 |
| Quadrant-wise count rates Data is divided into 100 sec bins |
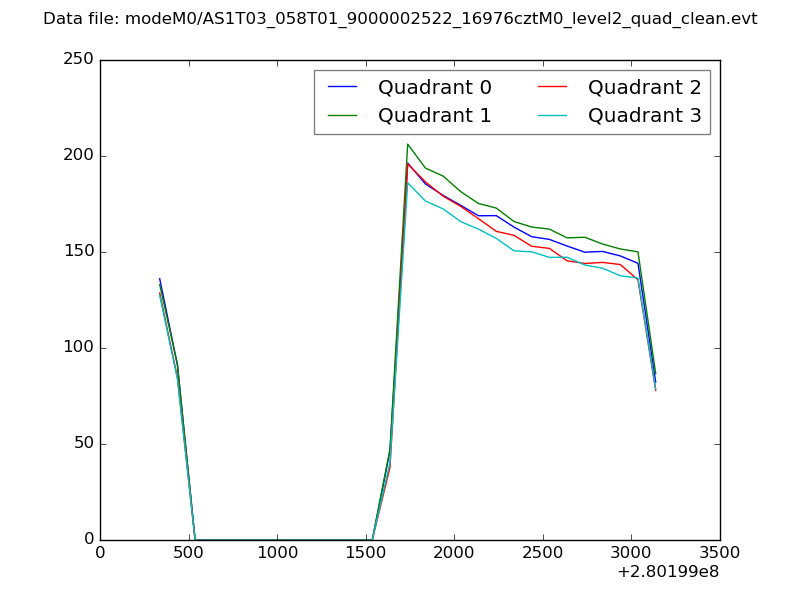 |
|
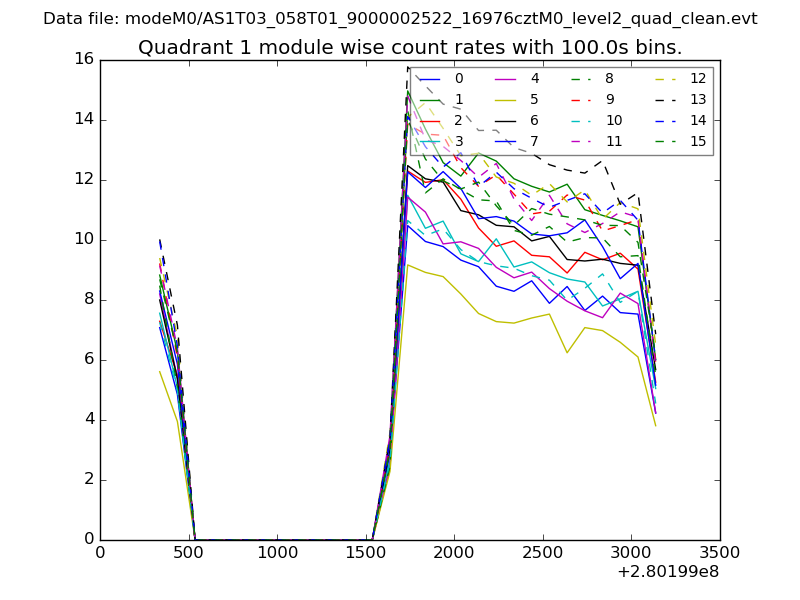
| Module-wise count rates for Quadrant A Data is divided into 100 sec bins |
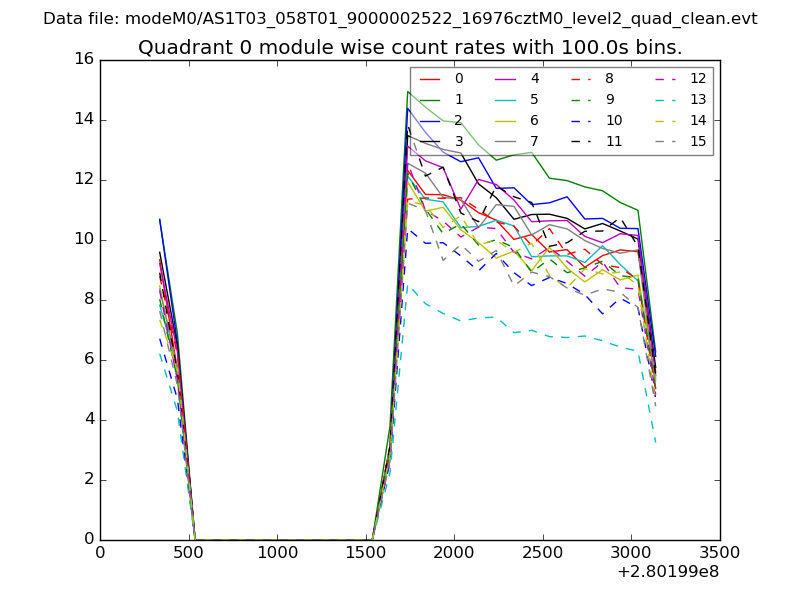 |
 |
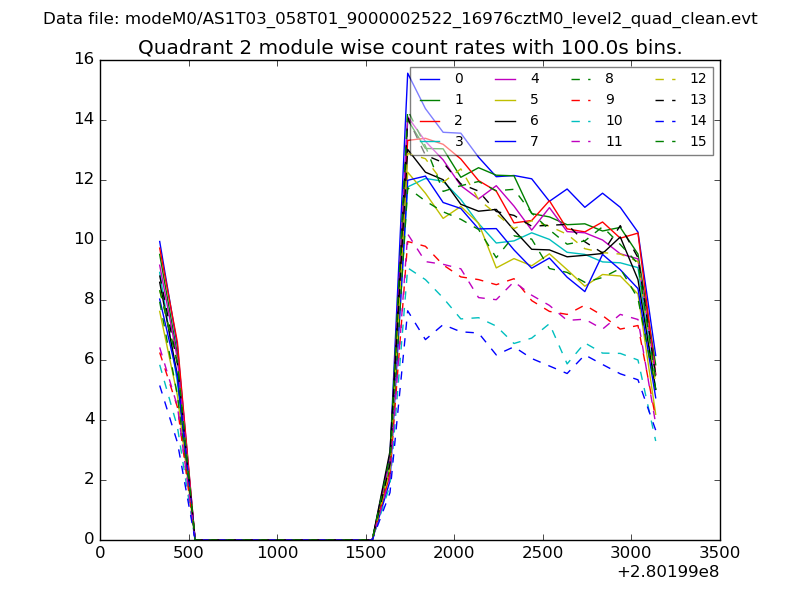
| Module-wise count rates for Quadrant B Data is divided into 100 sec bins |
 |
 |
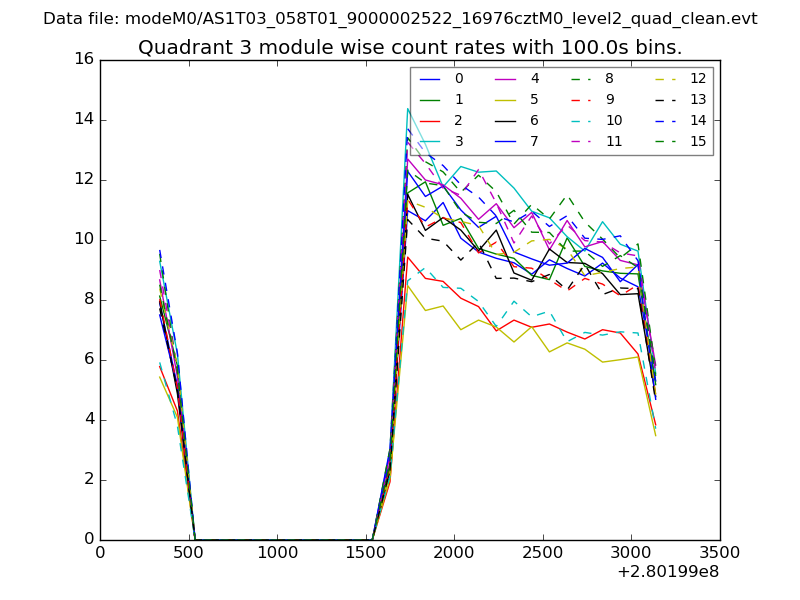
| Module-wise count rates for Quadrant C Data is divided into 100 sec bins |
 |
 |
| Module-wise count rates for Quadrant D Data is divided into 100 sec bins |
 |
 |
| Parameter | Plot |
|---|---|
| CZT HV Monitor | 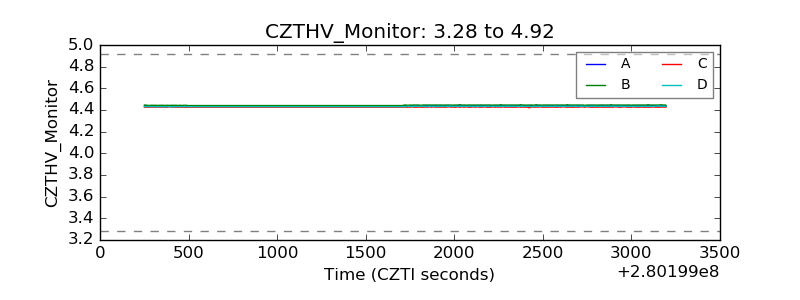 |
| D_VDD | 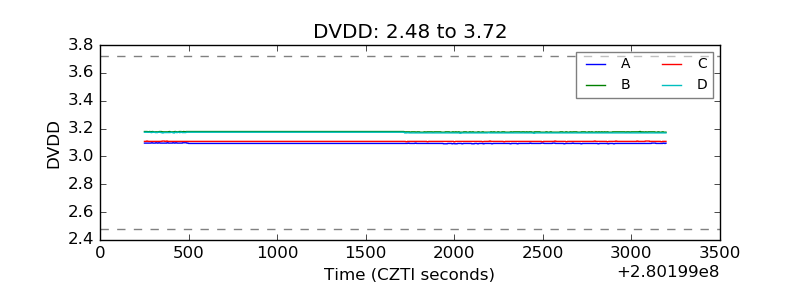 |
| Temperature 1 | 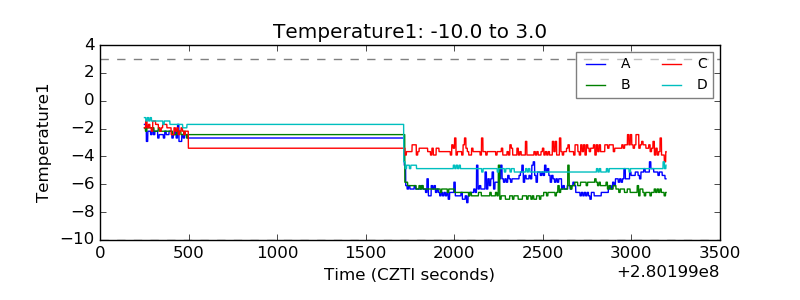 |
| Veto HV Monitor | 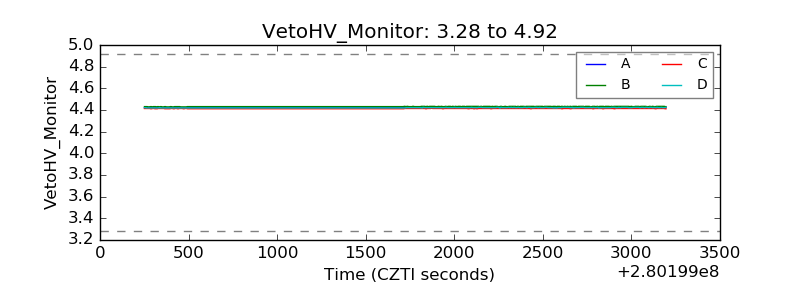 |
| Veto LLD | 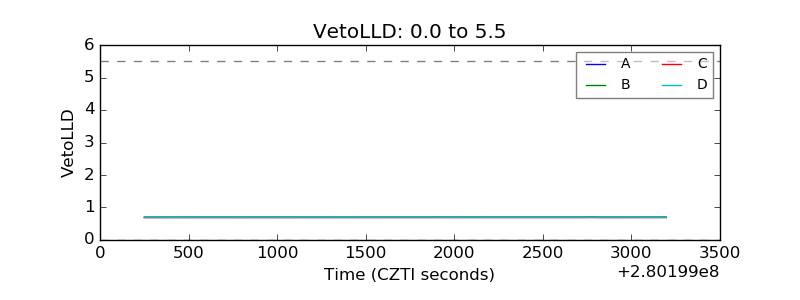 |
| Alpha Counter | 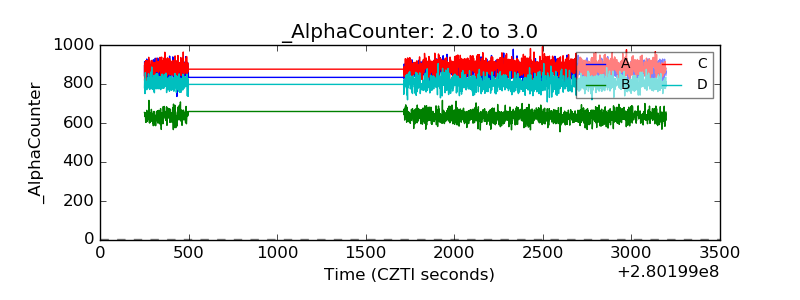 |
| _CPM_Rate | 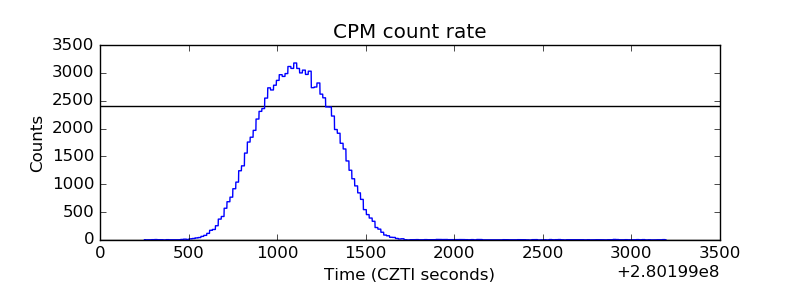 |
| CZT Counter | 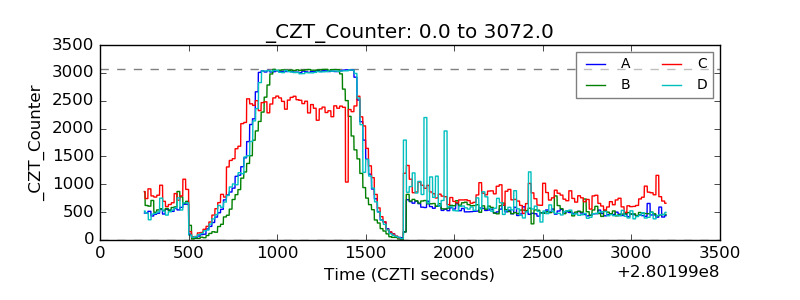 |
| +2.5 Volts monitor |  |
| +5 Volts monitor | 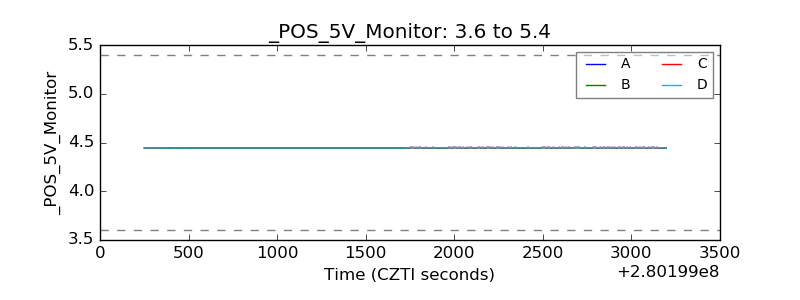 |
| _ROLL_ROT | 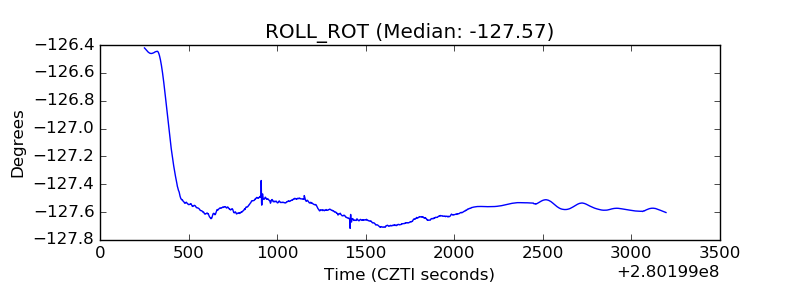 |
| _Roll_DEC | 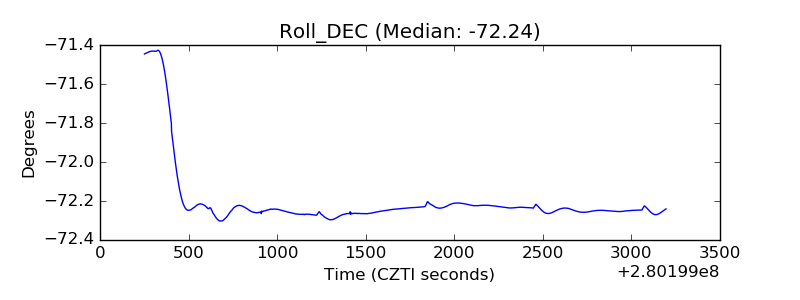 |
| _Roll_RA | 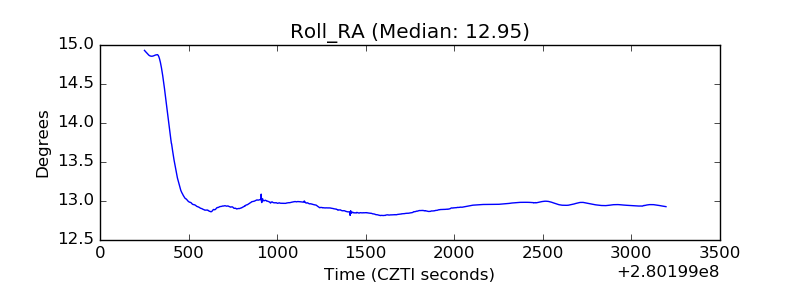 |
| Veto Counter | 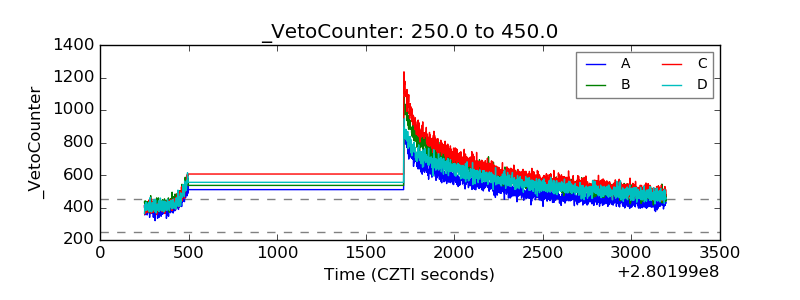 |