| Param | Original file | Final file |
|---|---|---|
| Filename | modeM0/AS1T03_058T01_9000002522_16978cztM0_level2.evt | modeM0/AS1T03_058T01_9000002522_16978cztM0_level2_quad_clean.evt |
| Size (bytes) | 487,264,320 | 97,024,320 |
| Size | 464.7 MB | 92.5 MB |
| Events in quadrant A | 3,043,975 | 645,651 |
| Events in quadrant B | 3,255,847 | 658,004 |
| Events in quadrant C | 3,467,301 | 635,790 |
| Events in quadrant D | 4,606,017 | 603,072 |
| Mode M9 | |||
|---|---|---|---|
| Quadrant | BADHDUFLAG | Total packets | Discarded packets |
| A | 0 | 14 | 0 |
| B | 0 | 14 | 0 |
| C | 0 | 14 | 0 |
| D | 0 | 14 | 0 |
| Mode M0 | |||
|---|---|---|---|
| Quadrant | BADHDUFLAG | Total packets | Discarded packets |
| A | 0 | 12515 | 1 |
| B | 0 | 13007 | 1 |
| C | 0 | 14215 | 1 |
| D | 0 | 17290 | 1 |
| Mode SS | |||
|---|---|---|---|
| Quadrant | BADHDUFLAG | Total packets | Discarded packets |
| A | 0 | 114 | 0 |
| B | 0 | 114 | 0 |
| C | 0 | 114 | 0 |
| D | 0 | 114 | 0 |
| Quadrant | Total seconds | Saturated seconds | Saturation percentage |
|---|---|---|---|
| A | 5662 | 5 | 0.088308% |
| B | 5663 | 61 | 1.077168% |
| C | 5663 | 67 | 1.183118% |
| D | 5663 | 403 | 7.116369% |
Noise dominated data is calculated using 1-second bins in cleaned event files. If a bin has >2000 counts, and if more than 50% of those come from <1% of pixels, then it is considered to be noise-dominated and hence unusable.
| Quadrant | # 1 sec bins | Bins with >0 counts | Bins with >2000 counts | High rate bins dominated by noise | Noise dominated (total time) | Noise dominated (detector-on time) | Marked lightcurve |
|---|---|---|---|---|---|---|---|
| A | 7048 | 5664 | 0 | 0 | 0.00% | 0.00% | 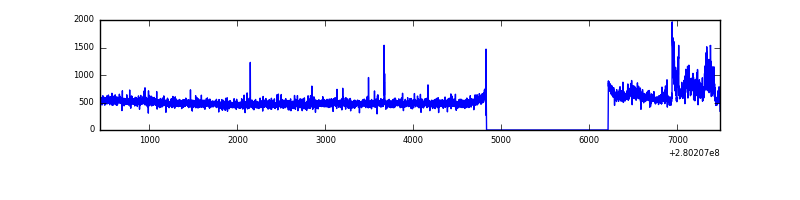 |
| B | 7049 | 5665 | 11 | 11 | 0.16% | 0.19% | 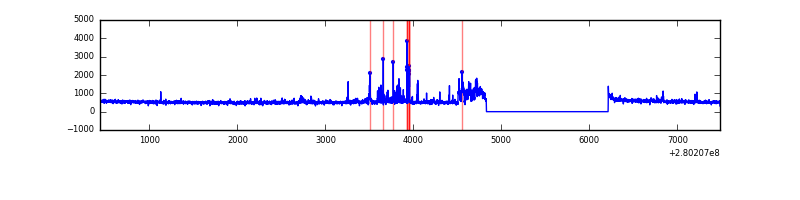 |
| C | 7049 | 5665 | 2 | 2 | 0.03% | 0.04% | 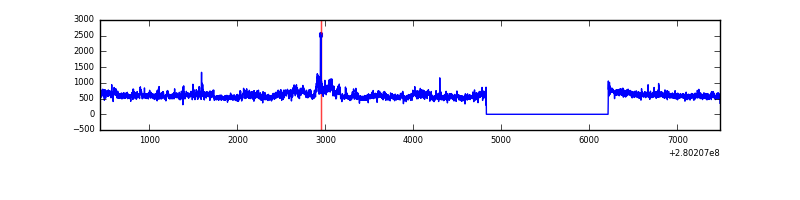 |
| D | 7049 | 5665 | 289 | 289 | 4.10% | 5.10% | 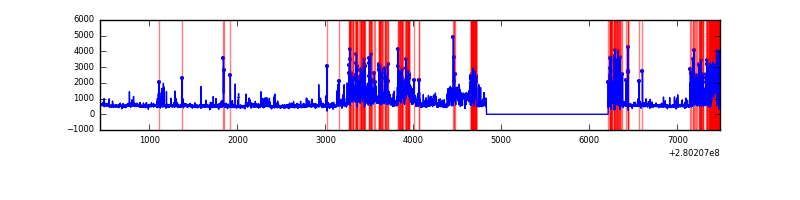 |
Top three noisy pixels from each quadrant. If the there are fewer than three noisy pixels in the level2.evt file, extra rows are filled as -1
| Pixel properties | Quadrant properties | ||||||
|---|---|---|---|---|---|---|---|
| Quadrant | DetID | PixID | Counts | Sigma | Mean | Median | Sigma |
| A | 15 | 174 | 204612 | 1398.19 | 738 | 724 | 145.8 |
| A | 0 | 226 | 6516 | 39.72 | 738 | 724 | 145.8 |
| A | 12 | 194 | 5511 | 32.83 | 738 | 724 | 145.8 |
| B | 3 | 64 | 177552 | 1315.17 | 741 | 726 | 134.5 |
| B | 7 | 220 | 79668 | 587.15 | 741 | 726 | 134.5 |
| B | 0 | 189 | 33667 | 245.0 | 741 | 726 | 134.5 |
| C | 3 | 233 | 507141 | 3066.78 | 723 | 729 | 165.1 |
| C | 14 | 238 | 114838 | 691.03 | 723 | 729 | 165.1 |
| C | 0 | 207 | 12907 | 73.75 | 723 | 729 | 165.1 |
| D | 1 | 52 | 1662004 | 9840.88 | 708 | 689 | 168.8 |
| D | 7 | 38 | 247818 | 1463.88 | 708 | 689 | 168.8 |
| D | 2 | 234 | 22076 | 126.69 | 708 | 689 | 168.8 |
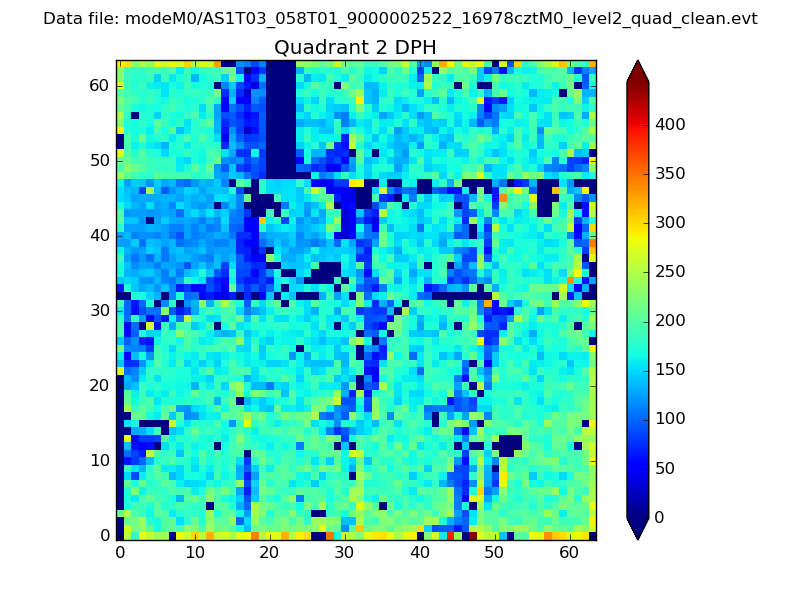
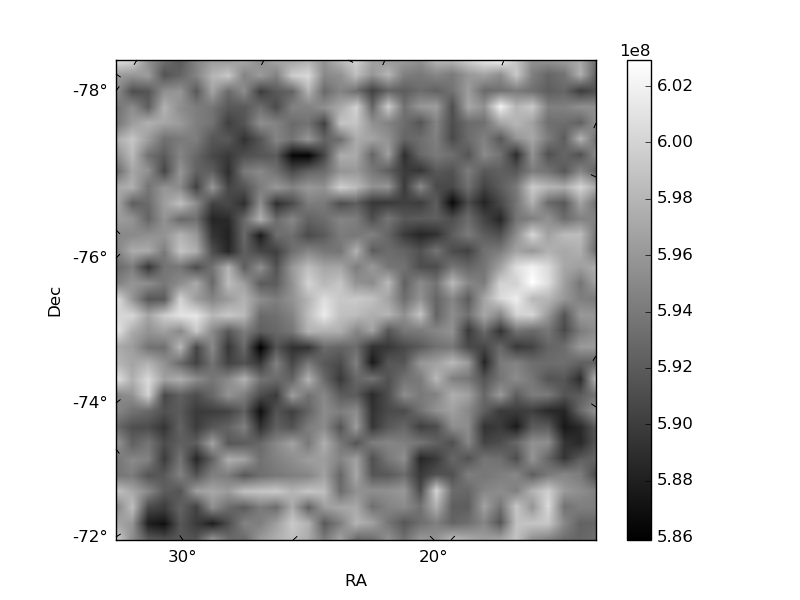
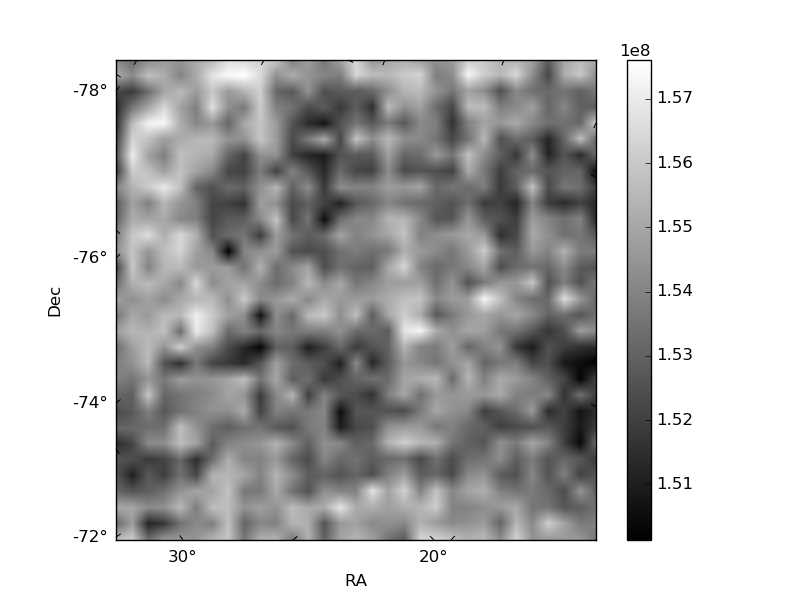
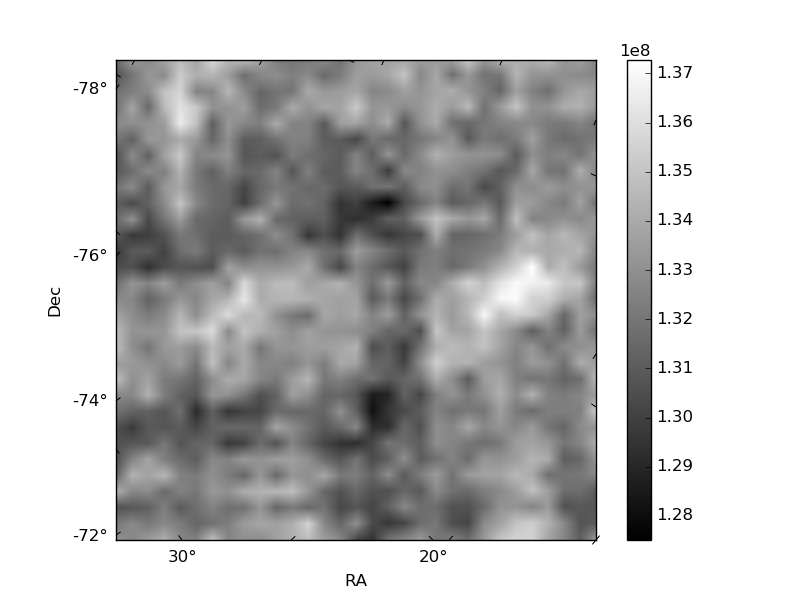
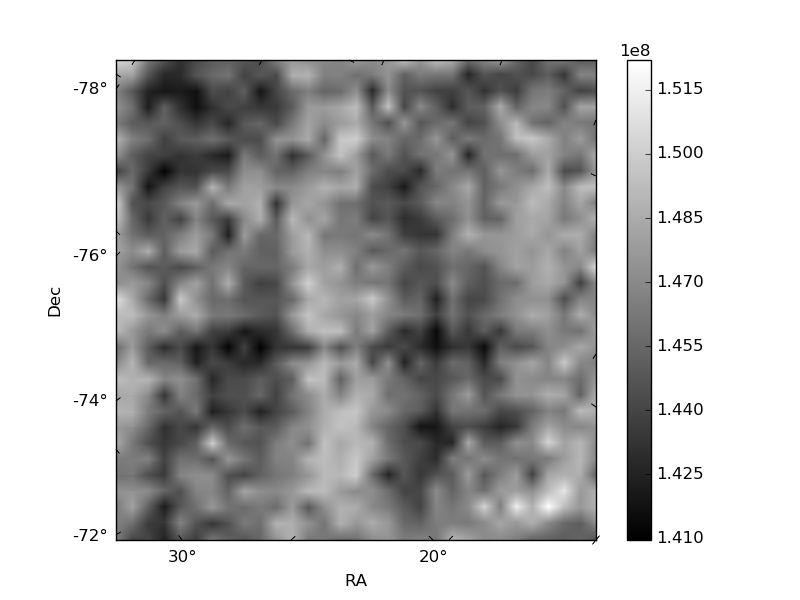
Histogram calculated using DETX and DETY for each event in the final _common_clean file
| Quadrant A | 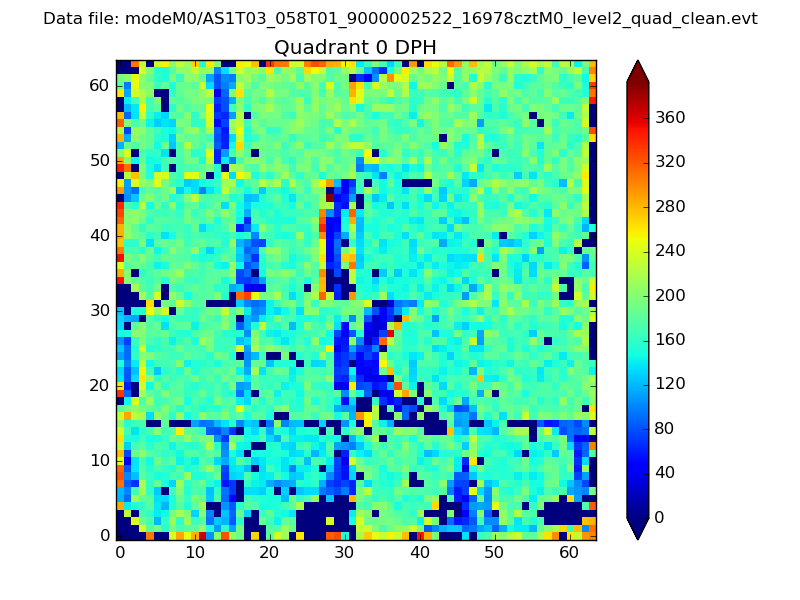 |
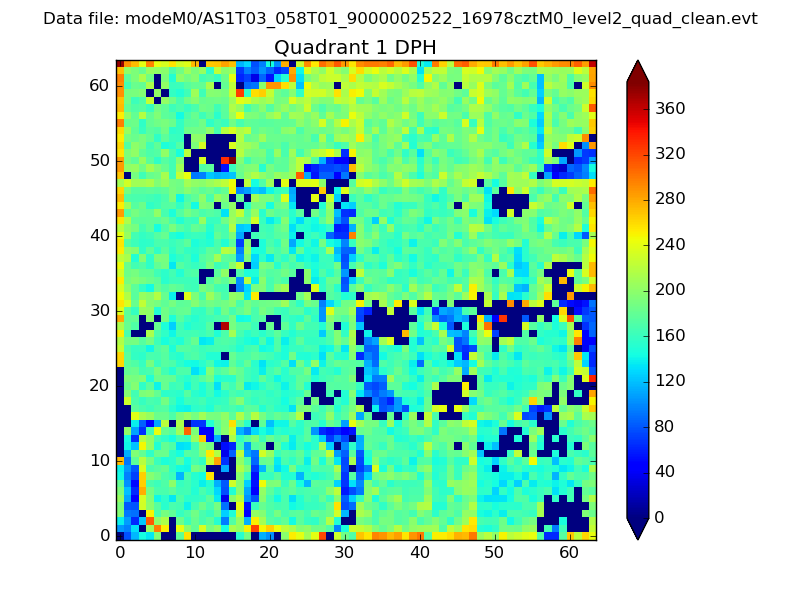 |
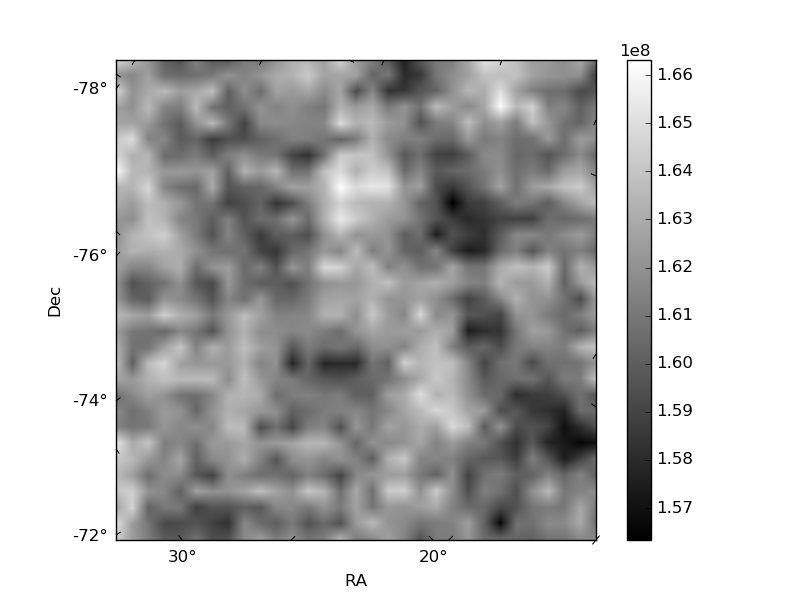
Quadrant B |
|---|---|---|---|
| Quadrant D | 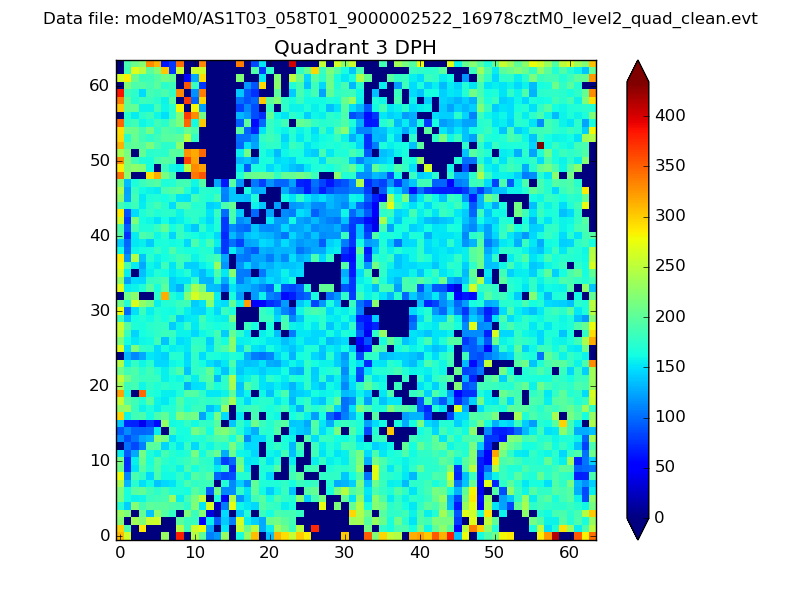 |
 |
Quadrant C |
| Plot type | Count rate plots | Images |
|---|---|---|
| Comparison with Poisson distribution Blue bars denote a histogram of data divided into 1 sec bins. Red curve is a Poisson curve with rate = median count rate of data. |
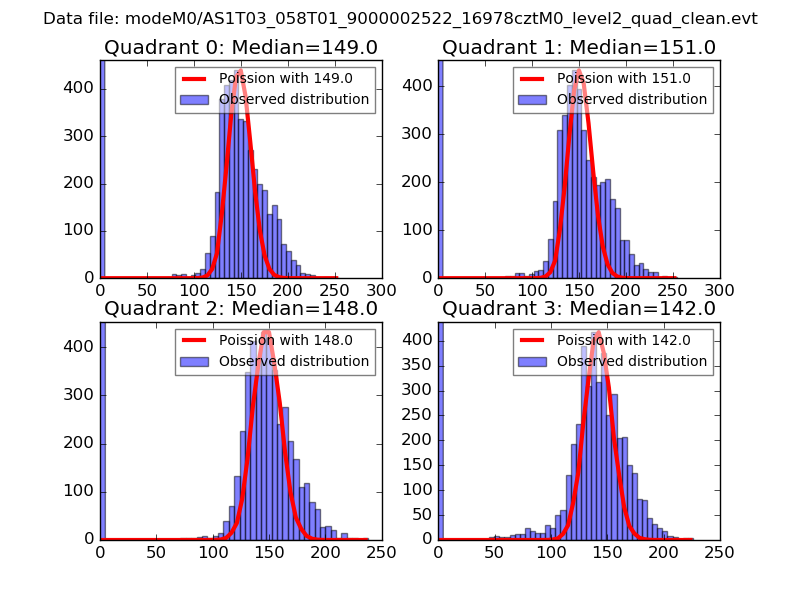 |
 |
| Quadrant-wise count rates Data is divided into 100 sec bins |
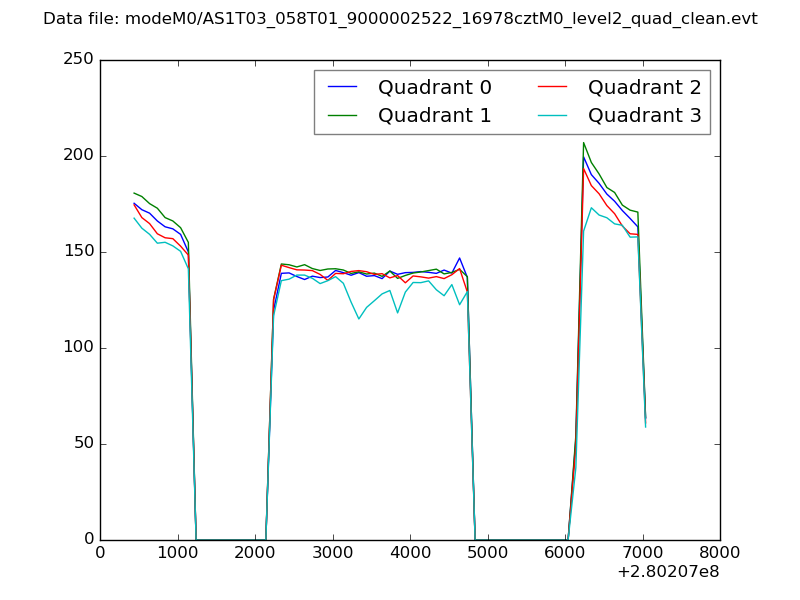 |
|
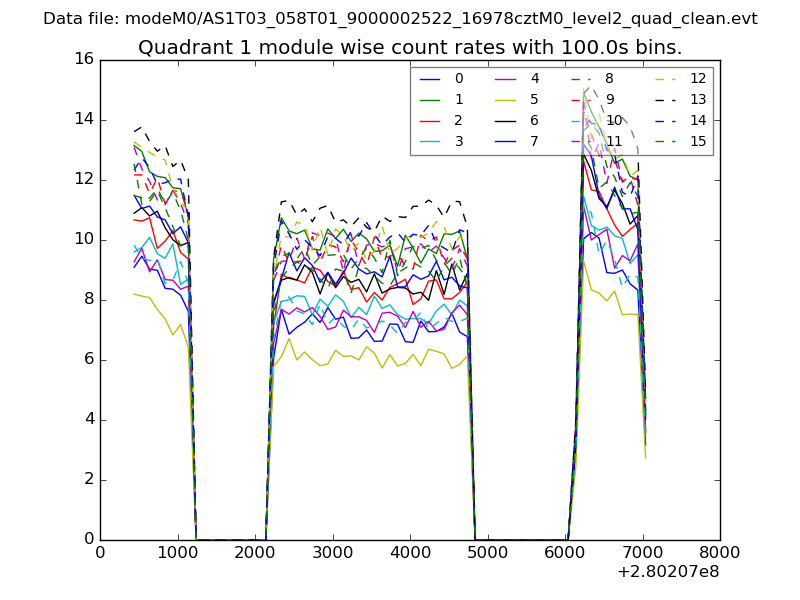
| Module-wise count rates for Quadrant A Data is divided into 100 sec bins |
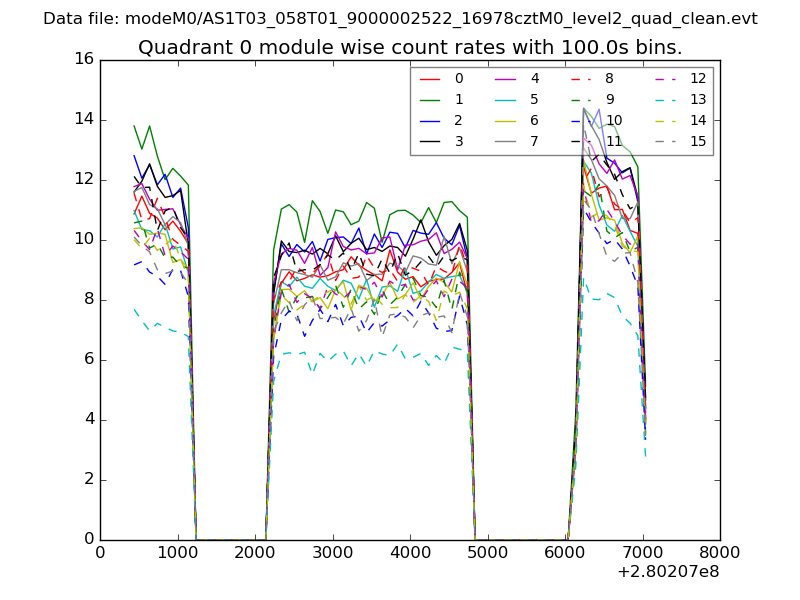 |
 |
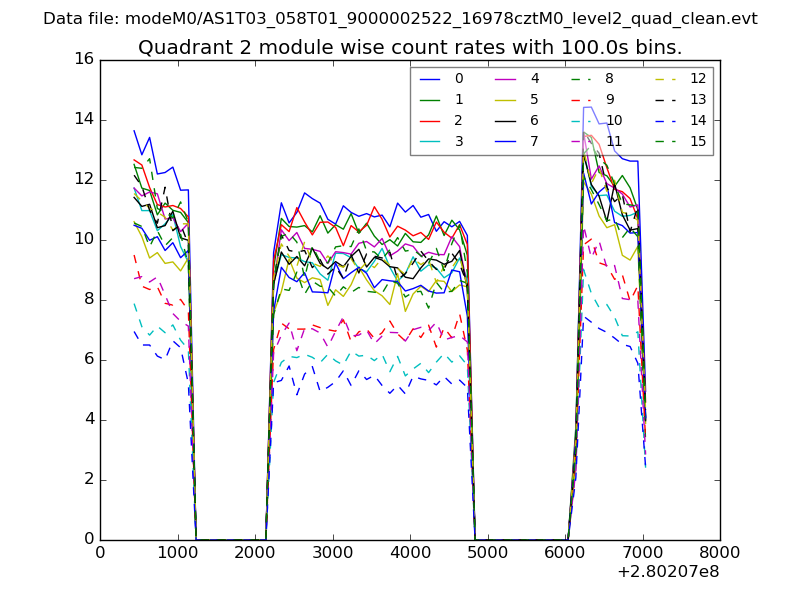
| Module-wise count rates for Quadrant B Data is divided into 100 sec bins |
 |
 |
| Module-wise count rates for Quadrant C Data is divided into 100 sec bins |
 |
 |
| Module-wise count rates for Quadrant D Data is divided into 100 sec bins |
 |
 |
| Parameter | Plot |
|---|---|
| CZT HV Monitor | 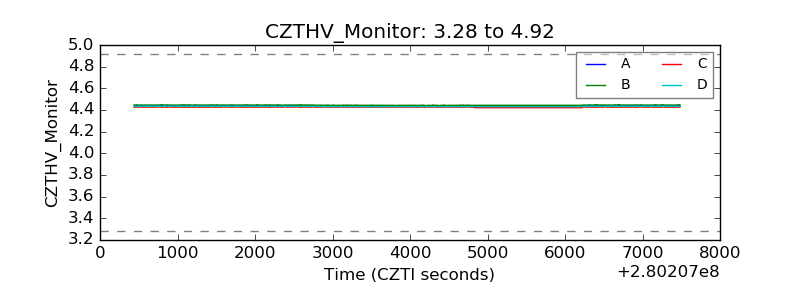 |
| D_VDD | 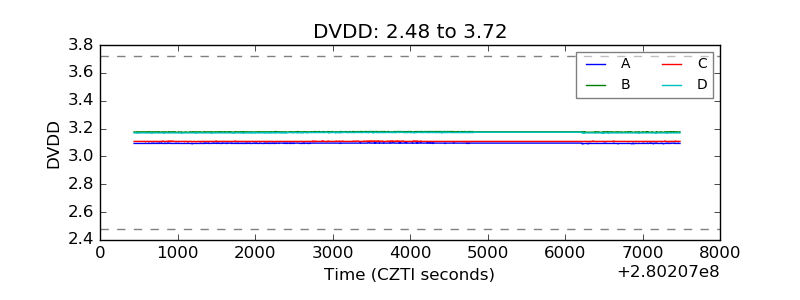 |
| Temperature 1 | 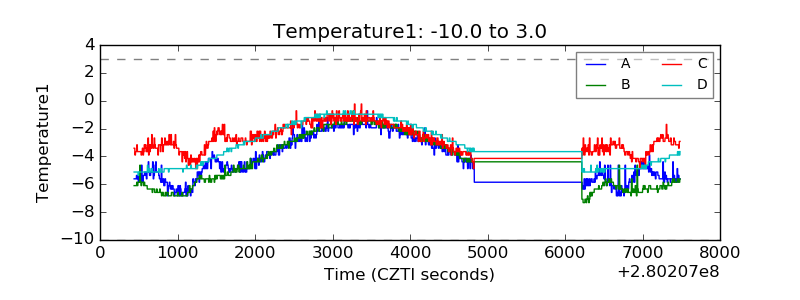 |
| Veto HV Monitor | 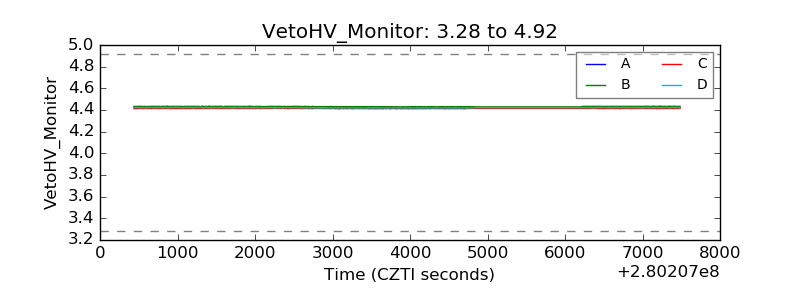 |
| Veto LLD | 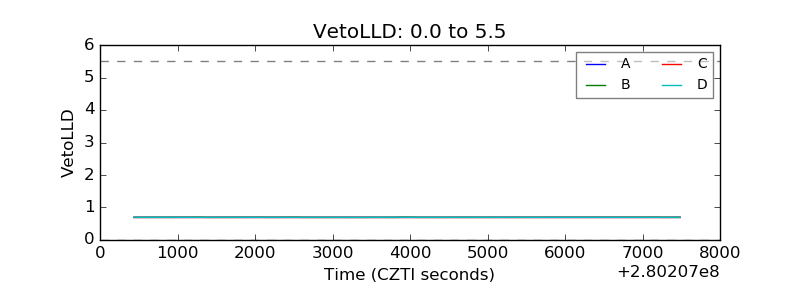 |
| Alpha Counter | 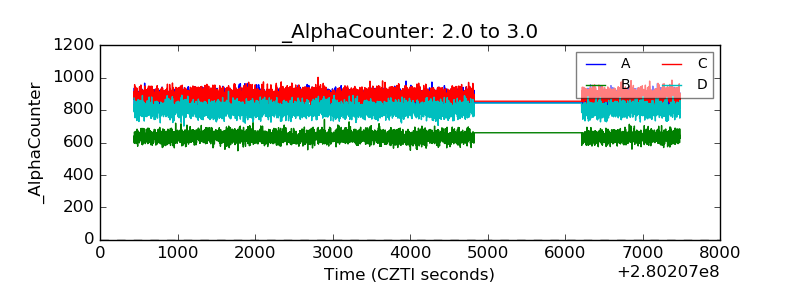 |
| _CPM_Rate | 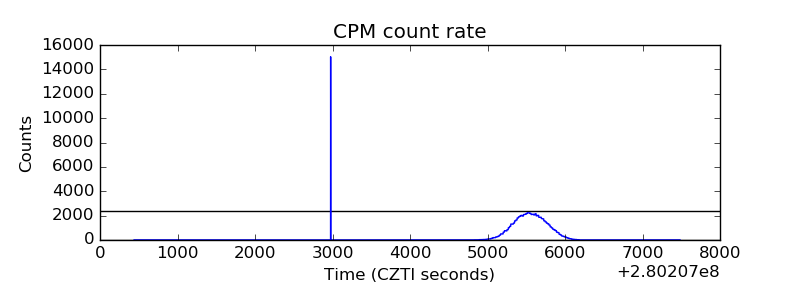 |
| CZT Counter | 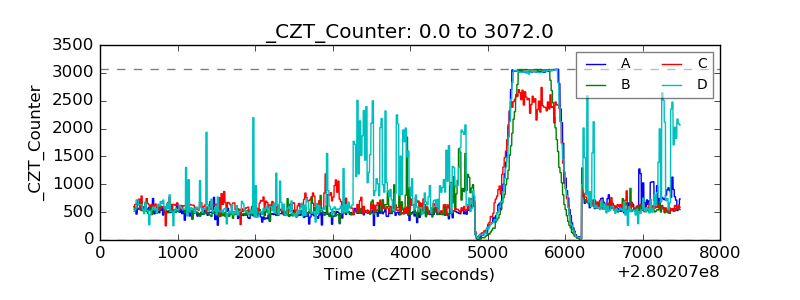 |
| +2.5 Volts monitor | 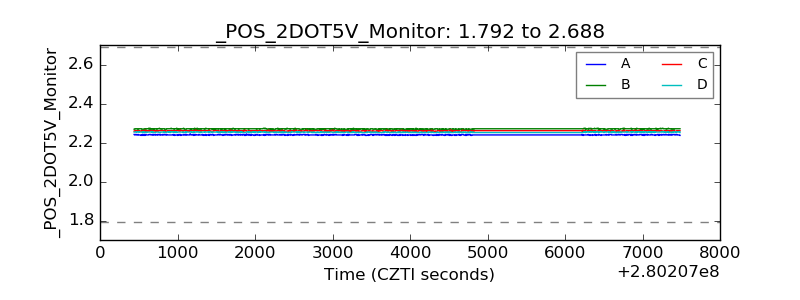 |
| +5 Volts monitor |  |
| _ROLL_ROT | 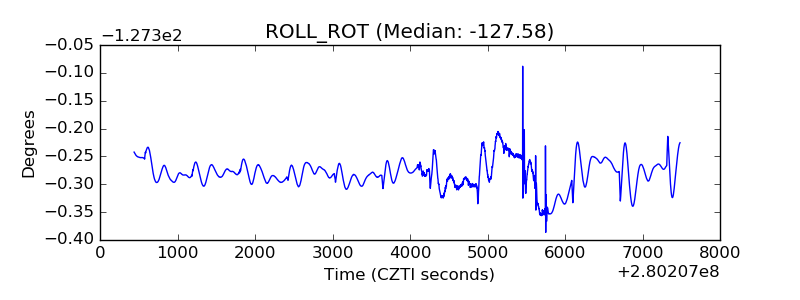 |
| _Roll_DEC | 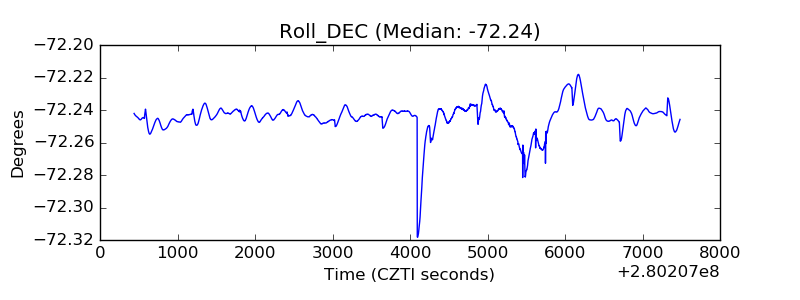 |
| _Roll_RA | 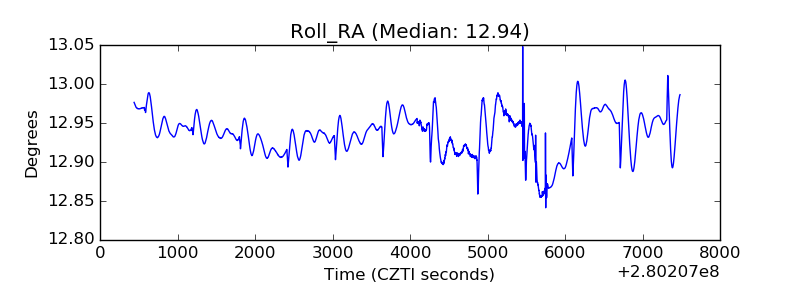 |
| Veto Counter | 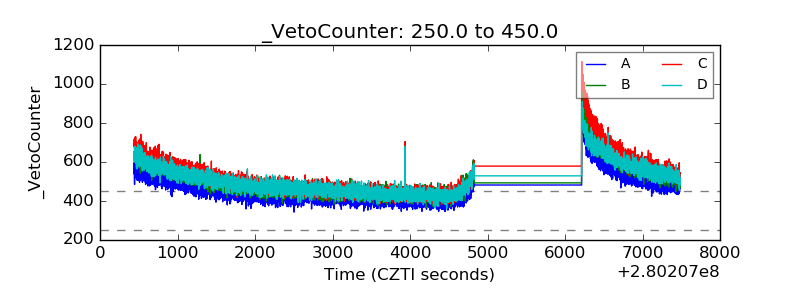 |