| Param | Original file | Final file |
|---|---|---|
| Filename | modeM0/AS1T03_058T01_9000002522_16979cztM0_level2.evt | modeM0/AS1T03_058T01_9000002522_16979cztM0_level2_quad_clean.evt |
| Size (bytes) | 550,362,240 | 100,379,520 |
| Size | 524.9 MB | 95.7 MB |
| Events in quadrant A | 4,003,257 | 654,790 |
| Events in quadrant B | 3,387,265 | 674,569 |
| Events in quadrant C | 3,846,131 | 648,544 |
| Events in quadrant D | 5,007,455 | 625,750 |
| Mode M9 | |||
|---|---|---|---|
| Quadrant | BADHDUFLAG | Total packets | Discarded packets |
| A | 0 | 14 | 0 |
| B | 0 | 15 | 0 |
| C | 0 | 15 | 0 |
| D | 0 | 15 | 0 |
| Mode M0 | |||
|---|---|---|---|
| Quadrant | BADHDUFLAG | Total packets | Discarded packets |
| A | 0 | 15911 | 2 |
| B | 0 | 13738 | 2 |
| C | 0 | 15792 | 2 |
| D | 0 | 18873 | 2 |
| Mode SS | |||
|---|---|---|---|
| Quadrant | BADHDUFLAG | Total packets | Discarded packets |
| A | 0 | 126 | 0 |
| B | 0 | 126 | 0 |
| C | 0 | 126 | 0 |
| D | 0 | 126 | 0 |
| Quadrant | Total seconds | Saturated seconds | Saturation percentage |
|---|---|---|---|
| A | 6254 | 179 | 2.862168% |
| B | 6254 | 99 | 1.582987% |
| C | 6254 | 152 | 2.430445% |
| D | 6254 | 694 | 11.096898% |
Noise dominated data is calculated using 1-second bins in cleaned event files. If a bin has >2000 counts, and if more than 50% of those come from <1% of pixels, then it is considered to be noise-dominated and hence unusable.
| Quadrant | # 1 sec bins | Bins with >0 counts | Bins with >2000 counts | High rate bins dominated by noise | Noise dominated (total time) | Noise dominated (detector-on time) | Marked lightcurve |
|---|---|---|---|---|---|---|---|
| A | 7551 | 6256 | 83 | 83 | 1.10% | 1.33% | 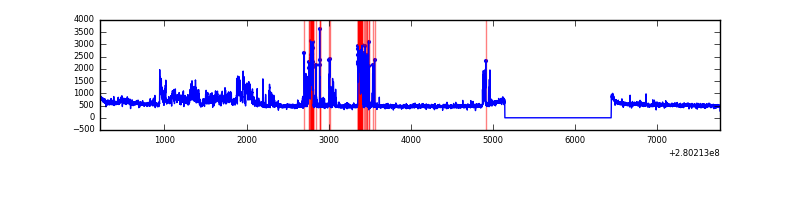 |
| B | 7551 | 6256 | 5 | 5 | 0.07% | 0.08% | 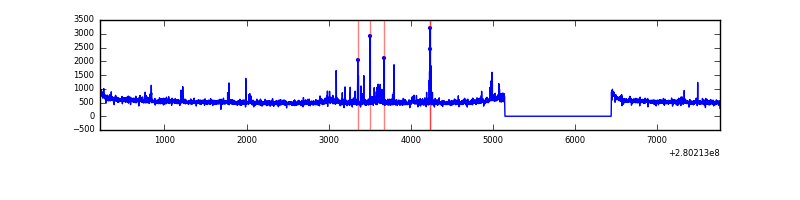 |
| C | 7551 | 6256 | 0 | 0 | 0.00% | 0.00% | 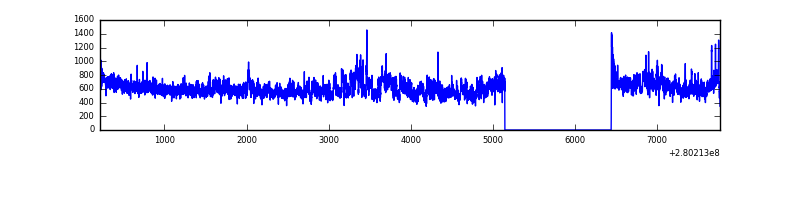 |
| D | 7551 | 6256 | 441 | 441 | 5.84% | 7.05% | 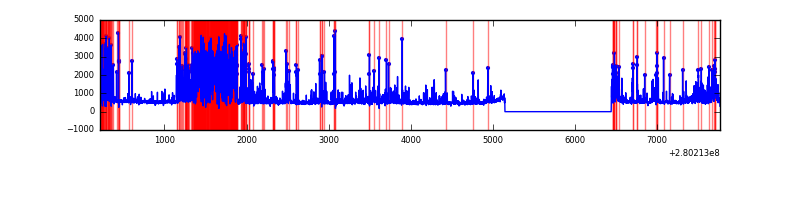 |
Top three noisy pixels from each quadrant. If the there are fewer than three noisy pixels in the level2.evt file, extra rows are filled as -1
| Pixel properties | Quadrant properties | ||||||
|---|---|---|---|---|---|---|---|
| Quadrant | DetID | PixID | Counts | Sigma | Mean | Median | Sigma |
| A | 15 | 174 | 848722 | 5287.66 | 818 | 805 | 160.4 |
| A | 0 | 226 | 7120 | 39.38 | 818 | 805 | 160.4 |
| A | 9 | 143 | 6593 | 36.09 | 818 | 805 | 160.4 |
| B | 7 | 220 | 54356 | 359.93 | 822 | 806 | 148.8 |
| B | 3 | 64 | 35801 | 235.22 | 822 | 806 | 148.8 |
| B | 0 | 197 | 26750 | 174.38 | 822 | 806 | 148.8 |
| C | 3 | 233 | 589487 | 3250.29 | 801 | 808 | 181.1 |
| C | 14 | 238 | 127287 | 698.33 | 801 | 808 | 181.1 |
| C | 13 | 61 | 5711 | 27.07 | 801 | 808 | 181.1 |
| D | 1 | 52 | 2032070 | 11155.8 | 772 | 752 | 182.1 |
| D | 12 | 110 | 29239 | 156.45 | 772 | 752 | 182.1 |
| D | 2 | 234 | 24358 | 129.64 | 772 | 752 | 182.1 |
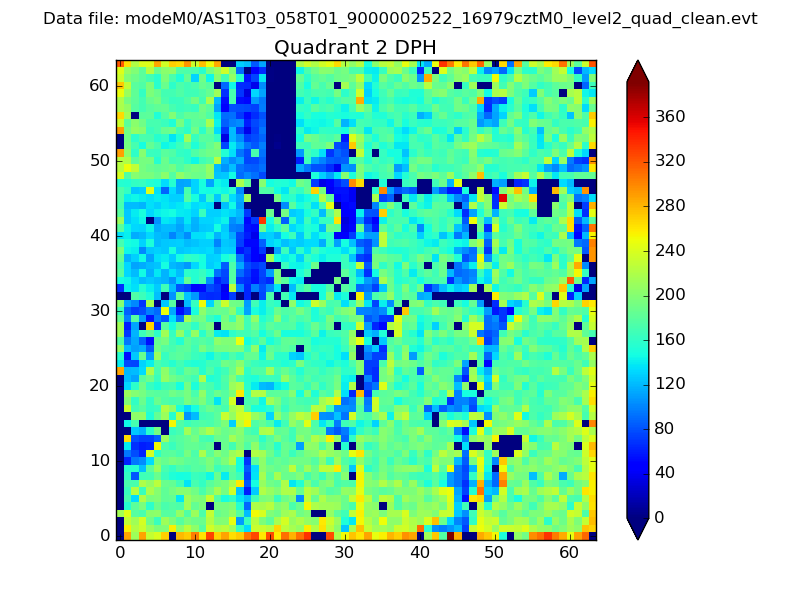
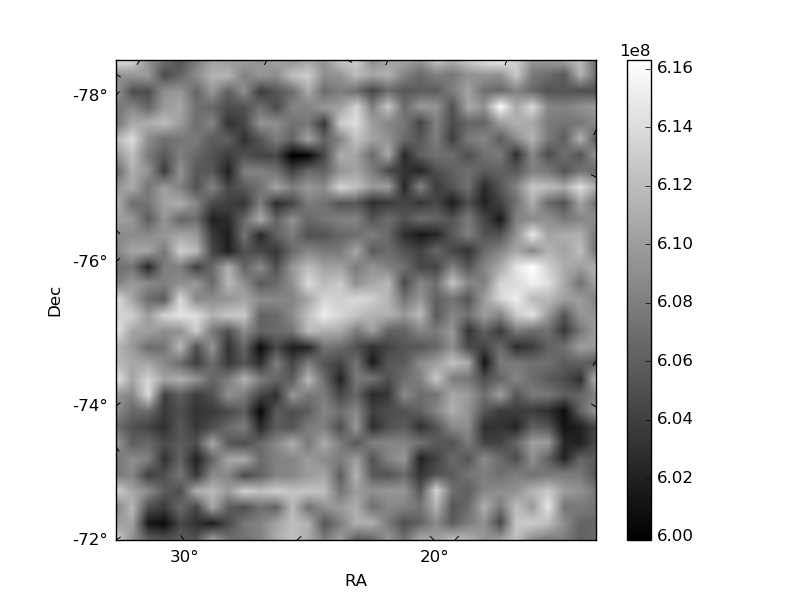
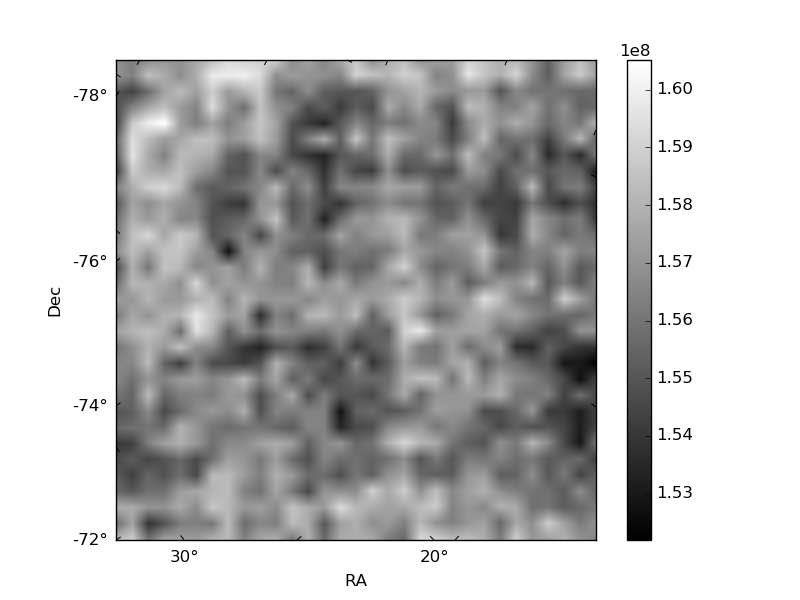
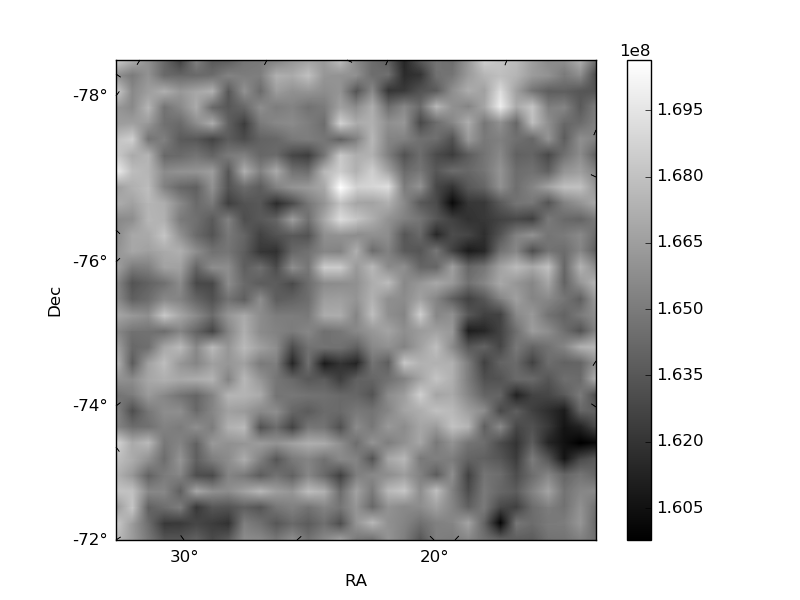
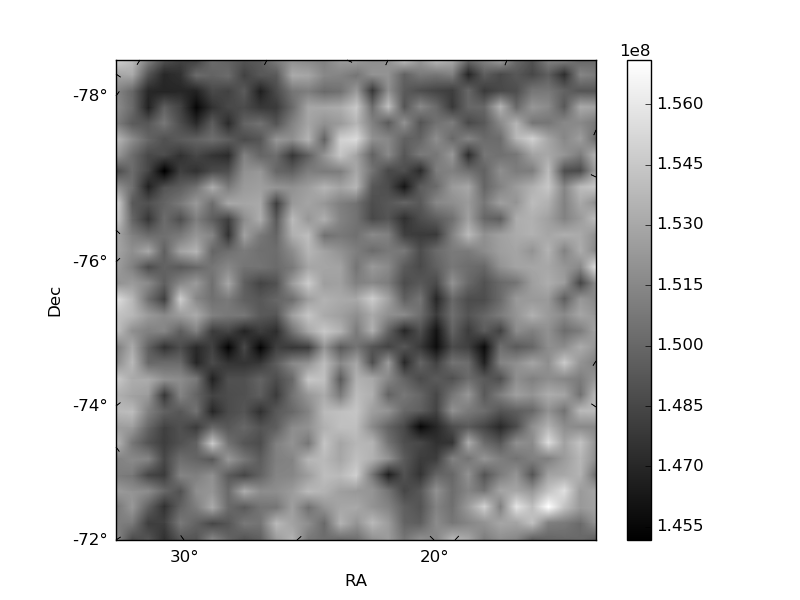
Histogram calculated using DETX and DETY for each event in the final _common_clean file
| Quadrant A | 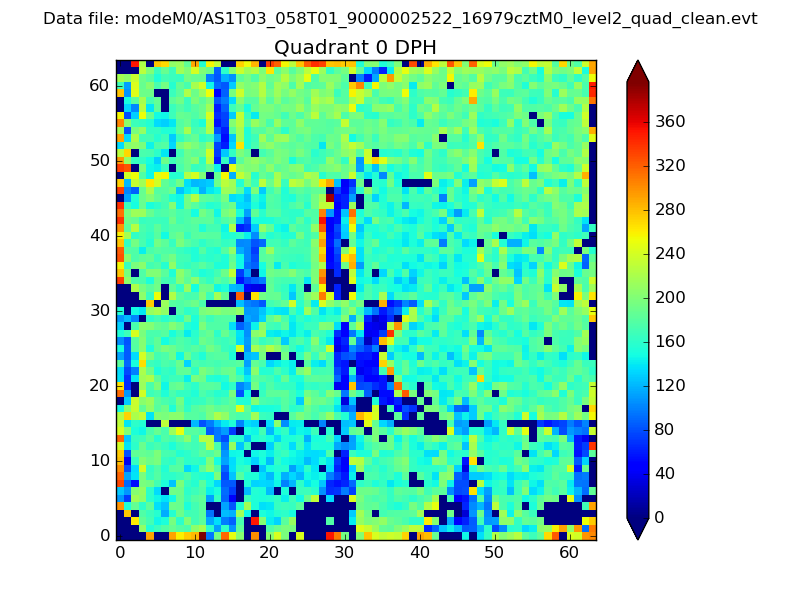 |
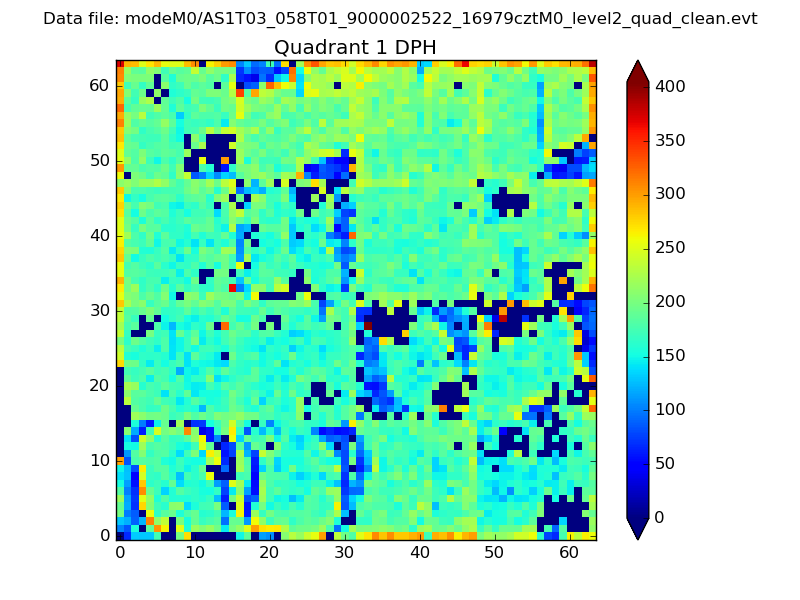 |
Quadrant B |
|---|---|---|---|
| Quadrant D | 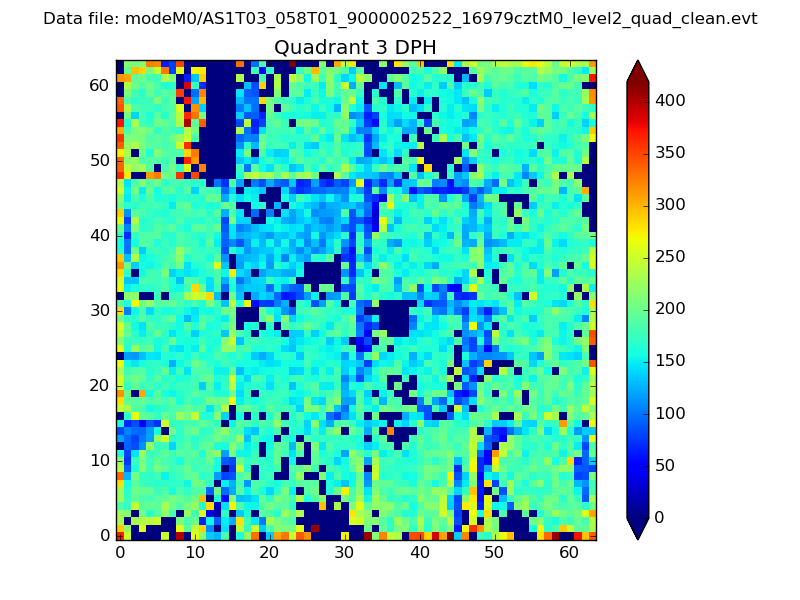 |
 |
Quadrant C |
| Plot type | Count rate plots | Images |
|---|---|---|
| Comparison with Poisson distribution Blue bars denote a histogram of data divided into 1 sec bins. Red curve is a Poisson curve with rate = median count rate of data. |
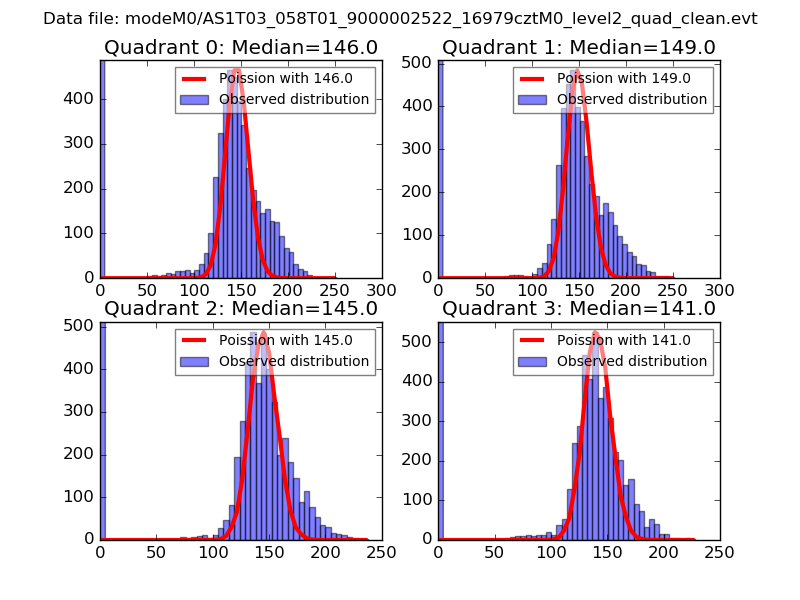 |
 |
| Quadrant-wise count rates Data is divided into 100 sec bins |
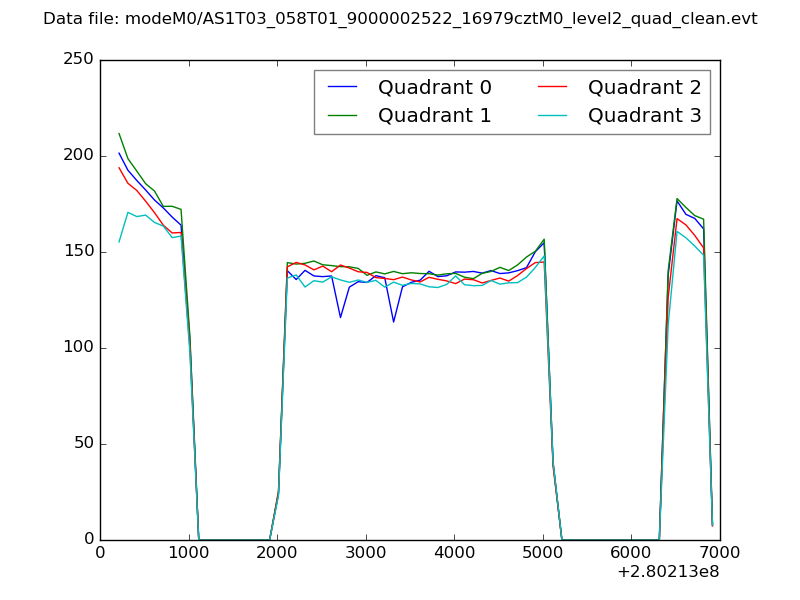 |
|
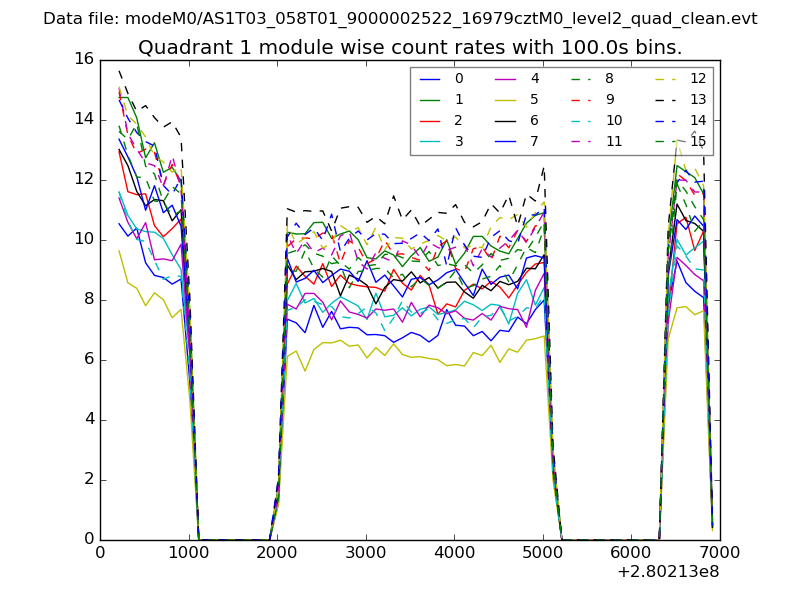
| Module-wise count rates for Quadrant A Data is divided into 100 sec bins |
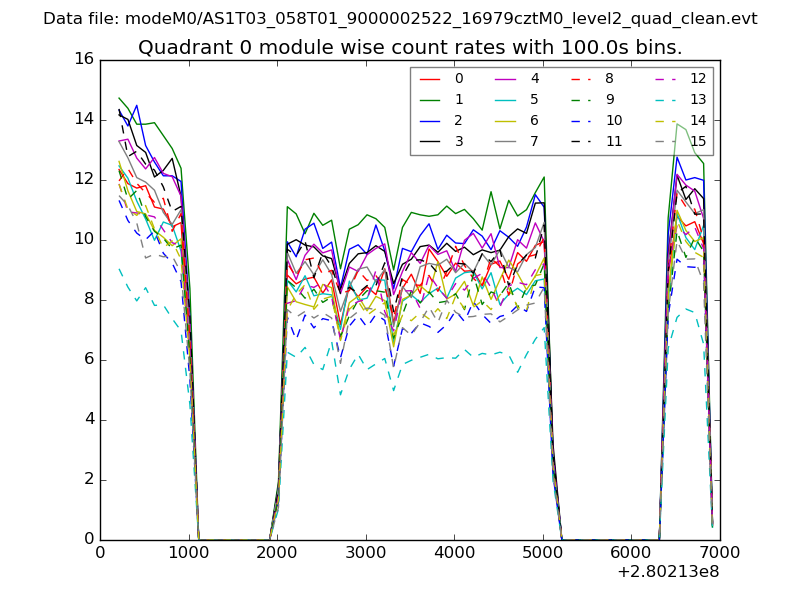 |
 |
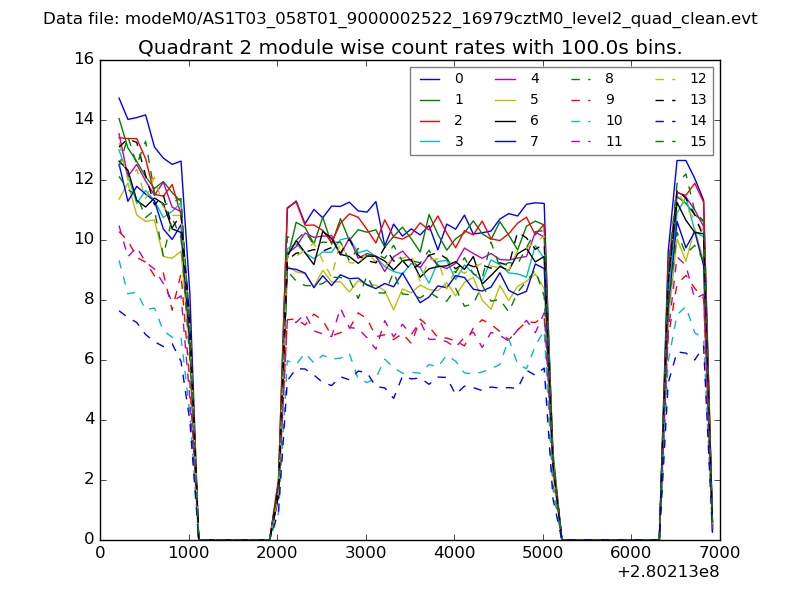
| Module-wise count rates for Quadrant B Data is divided into 100 sec bins |
 |
 |
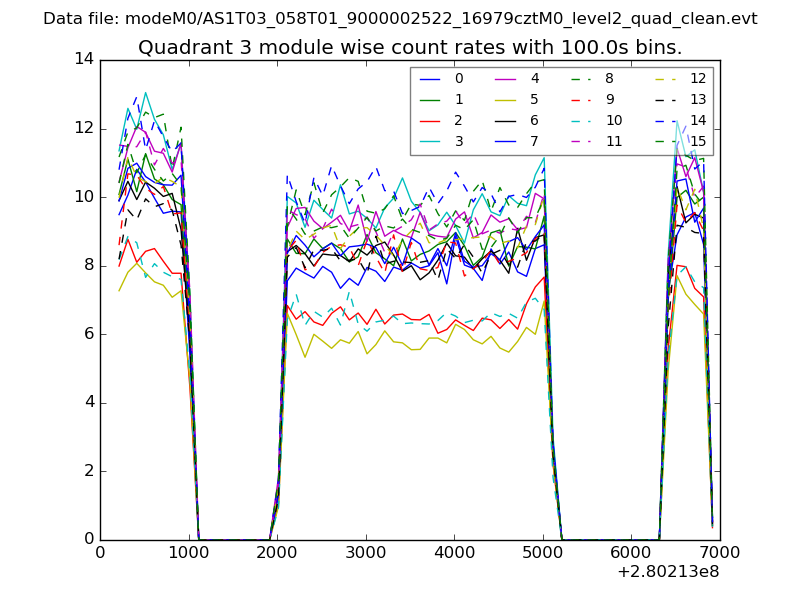
| Module-wise count rates for Quadrant C Data is divided into 100 sec bins |
 |
 |
| Module-wise count rates for Quadrant D Data is divided into 100 sec bins |
 |
 |
| Parameter | Plot |
|---|---|
| CZT HV Monitor | 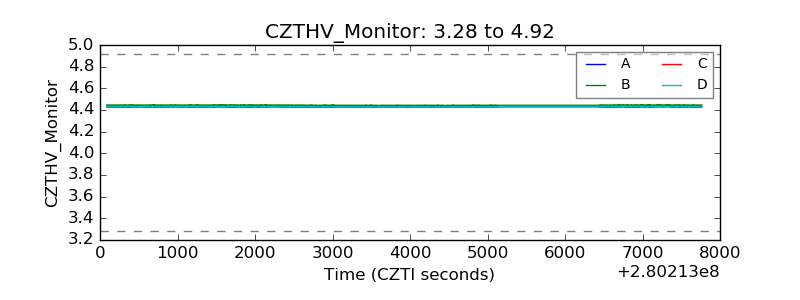 |
| D_VDD | 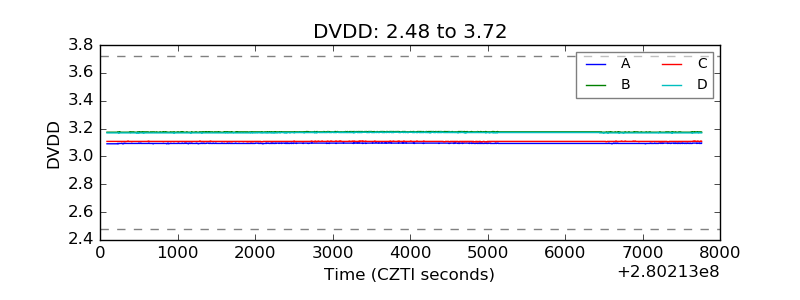 |
| Temperature 1 | 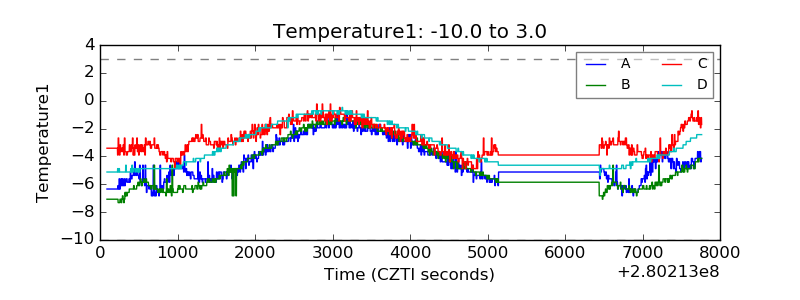 |
| Veto HV Monitor | 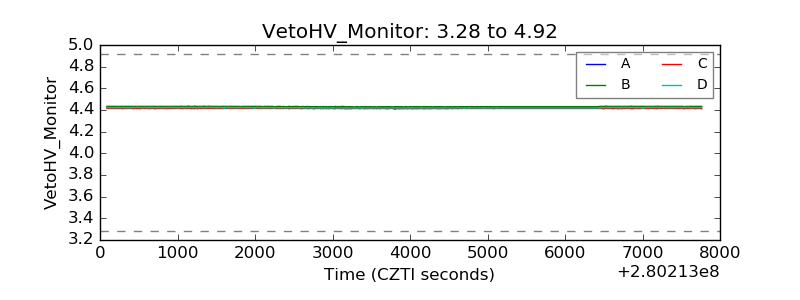 |
| Veto LLD | 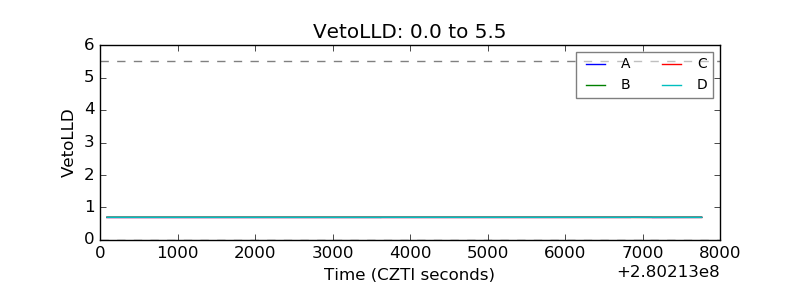 |
| Alpha Counter | 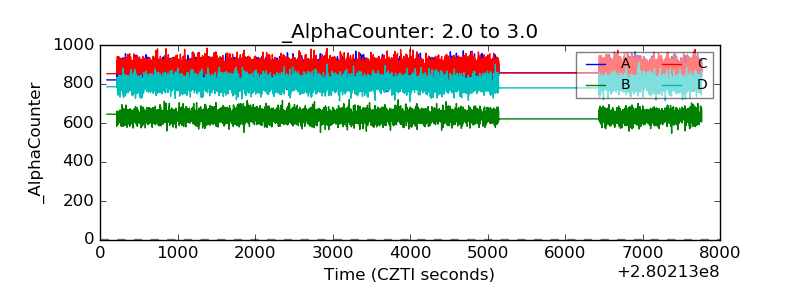 |
| _CPM_Rate | 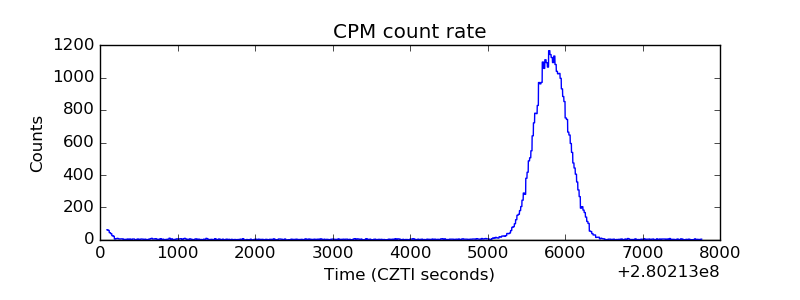 |
| CZT Counter | 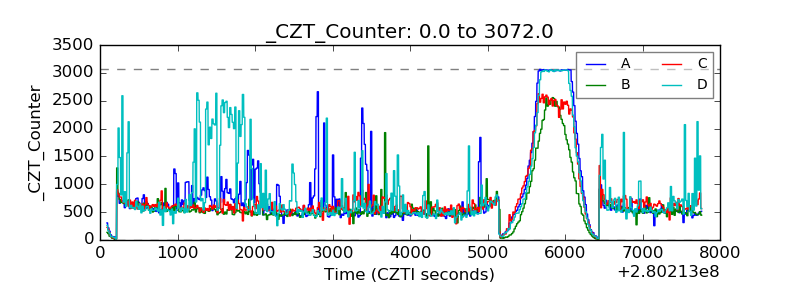 |
| +2.5 Volts monitor |  |
| +5 Volts monitor | 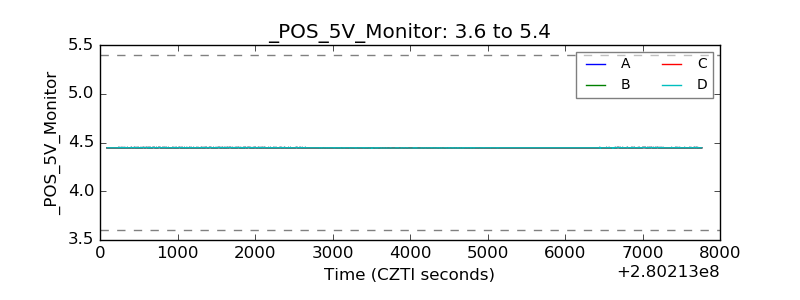 |
| _ROLL_ROT | 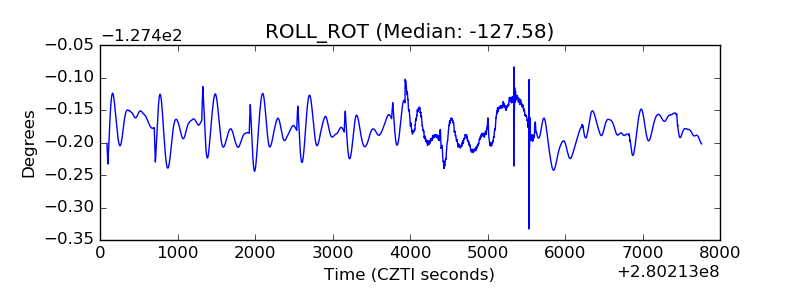 |
| _Roll_DEC | 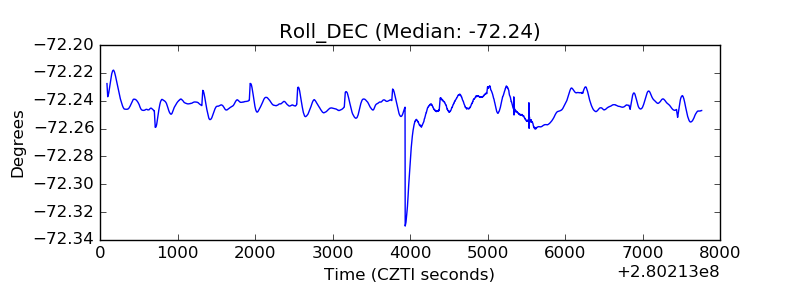 |
| _Roll_RA | 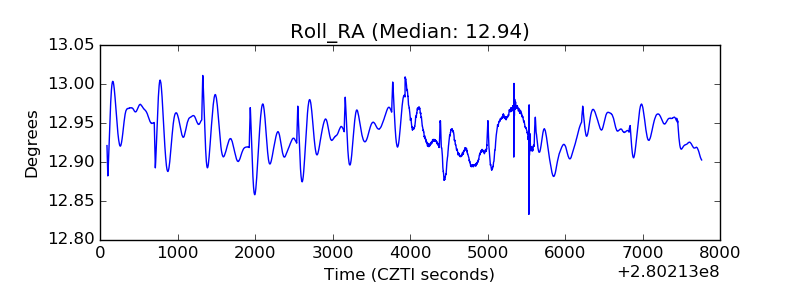 |
| Veto Counter | 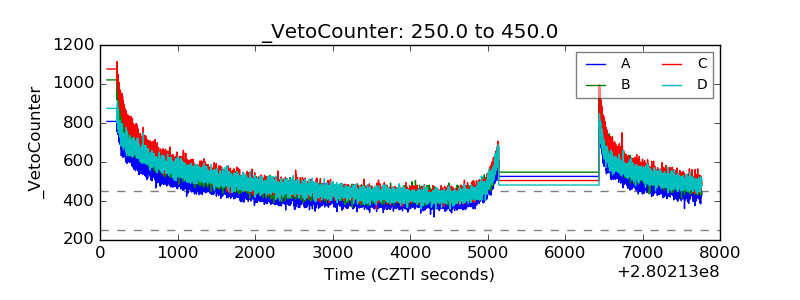 |