| Param | Original file | Final file |
|---|---|---|
| Filename | modeM0/AS1T03_058T01_9000002522_16980cztM0_level2.evt | modeM0/AS1T03_058T01_9000002522_16980cztM0_level2_quad_clean.evt |
| Size (bytes) | 544,613,760 | 87,114,240 |
| Size | 519.4 MB | 83.1 MB |
| Events in quadrant A | 3,056,093 | 563,674 |
| Events in quadrant B | 3,607,139 | 569,211 |
| Events in quadrant C | 4,241,677 | 553,869 |
| Events in quadrant D | 5,167,830 | 517,214 |
| Mode M9 | |||
|---|---|---|---|
| Quadrant | BADHDUFLAG | Total packets | Discarded packets |
| A | 0 | 11 | 0 |
| B | 0 | 11 | 0 |
| C | 0 | 11 | 0 |
| D | 0 | 11 | 0 |
| Mode M0 | |||
|---|---|---|---|
| Quadrant | BADHDUFLAG | Total packets | Discarded packets |
| A | 0 | 12915 | 1 |
| B | 0 | 14446 | 1 |
| C | 0 | 16973 | 1 |
| D | 0 | 19438 | 1 |
| Mode SS | |||
|---|---|---|---|
| Quadrant | BADHDUFLAG | Total packets | Discarded packets |
| A | 0 | 126 | 0 |
| B | 0 | 126 | 0 |
| C | 0 | 126 | 0 |
| D | 0 | 126 | 0 |
| Quadrant | Total seconds | Saturated seconds | Saturation percentage |
|---|---|---|---|
| A | 6212 | 150 | 2.414681% |
| B | 6213 | 224 | 3.605344% |
| C | 6213 | 253 | 4.072107% |
| D | 6213 | 601 | 9.673266% |
Noise dominated data is calculated using 1-second bins in cleaned event files. If a bin has >2000 counts, and if more than 50% of those come from <1% of pixels, then it is considered to be noise-dominated and hence unusable.
| Quadrant | # 1 sec bins | Bins with >0 counts | Bins with >2000 counts | High rate bins dominated by noise | Noise dominated (total time) | Noise dominated (detector-on time) | Marked lightcurve |
|---|---|---|---|---|---|---|---|
| A | 7278 | 6213 | 0 | 0 | 0.00% | 0.00% | 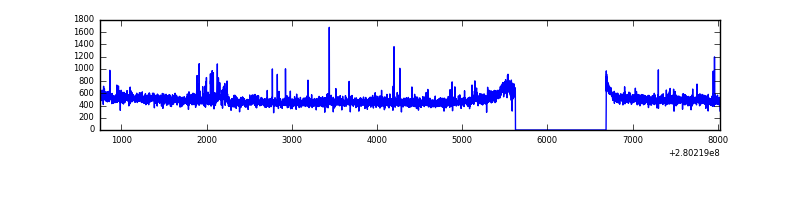 |
| B | 7279 | 6214 | 46 | 46 | 0.63% | 0.74% | 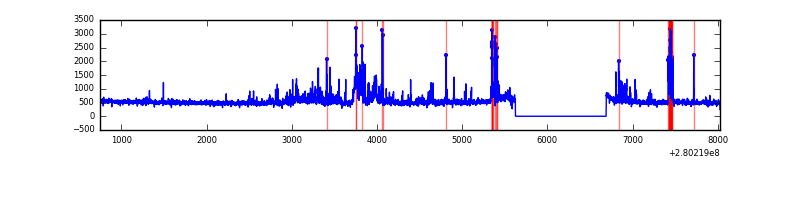 |
| C | 7279 | 6214 | 5 | 5 | 0.07% | 0.08% | 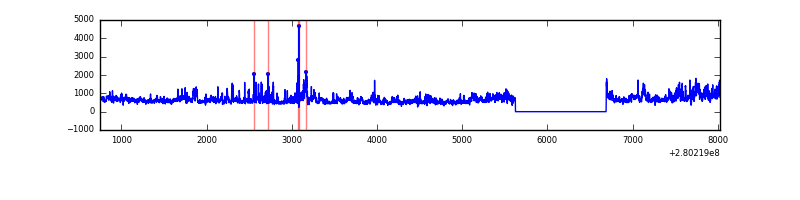 |
| D | 7279 | 6214 | 384 | 384 | 5.28% | 6.18% | 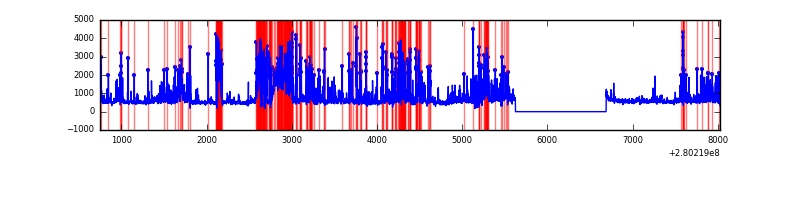 |
Top three noisy pixels from each quadrant. If the there are fewer than three noisy pixels in the level2.evt file, extra rows are filled as -1
| Pixel properties | Quadrant properties | ||||||
|---|---|---|---|---|---|---|---|
| Quadrant | DetID | PixID | Counts | Sigma | Mean | Median | Sigma |
| A | 15 | 174 | 50869 | 326.27 | 778 | 762 | 153.6 |
| A | 12 | 189 | 9874 | 59.33 | 778 | 762 | 153.6 |
| A | 0 | 226 | 7038 | 40.87 | 778 | 762 | 153.6 |
| B | 3 | 64 | 210047 | 1466.03 | 772 | 754 | 142.8 |
| B | 15 | 35 | 115820 | 806.0 | 772 | 754 | 142.8 |
| B | 7 | 220 | 65314 | 452.22 | 772 | 754 | 142.8 |
| C | 3 | 233 | 1135733 | 6597.1 | 750 | 752 | 172.0 |
| C | 14 | 238 | 117875 | 680.78 | 750 | 752 | 172.0 |
| C | 0 | 207 | 53888 | 308.85 | 750 | 752 | 172.0 |
| D | 1 | 52 | 2292001 | 13033.75 | 741 | 719 | 175.8 |
| D | 15 | 145 | 29109 | 161.49 | 741 | 719 | 175.8 |
| D | 2 | 234 | 26488 | 146.58 | 741 | 719 | 175.8 |
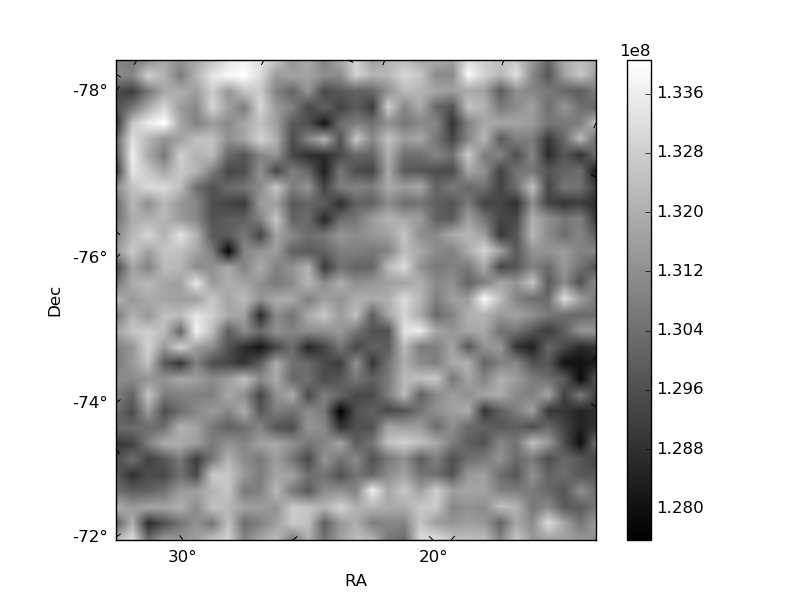
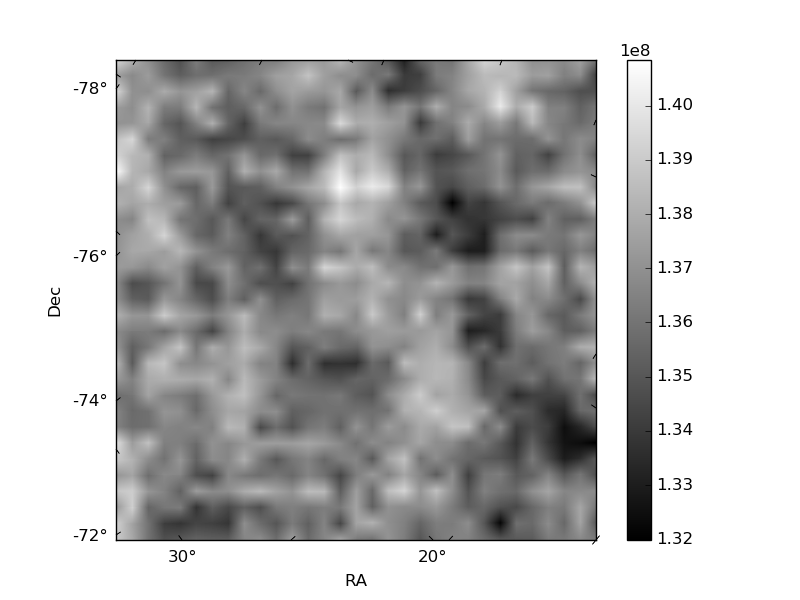
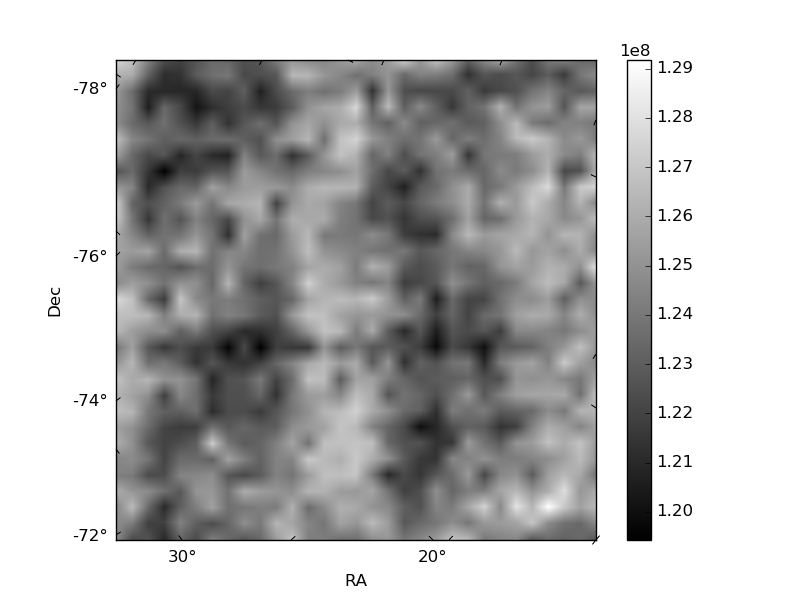
Histogram calculated using DETX and DETY for each event in the final _common_clean file
| Quadrant A | 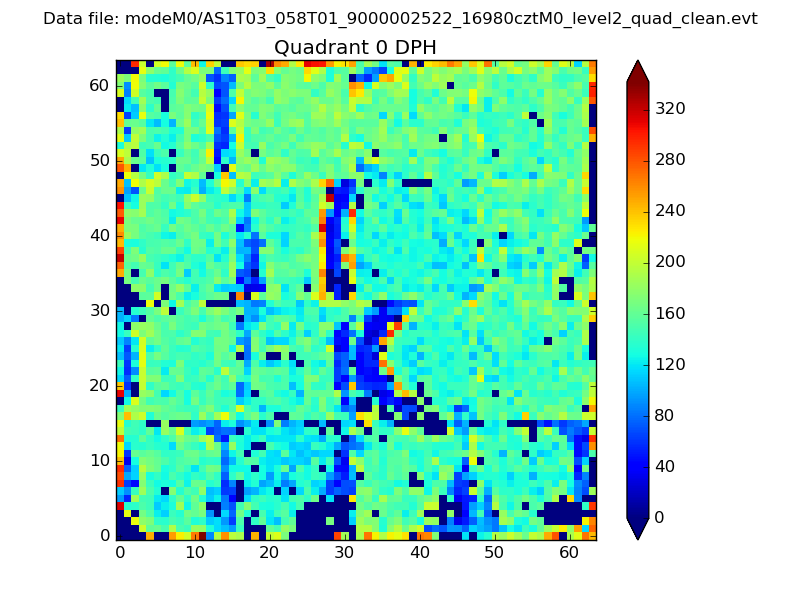 |
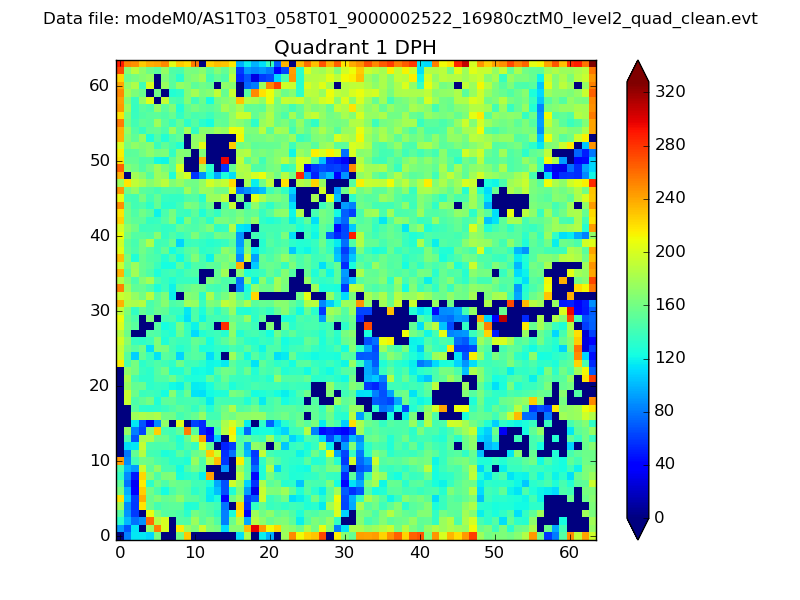 |
Quadrant B |
|---|---|---|---|
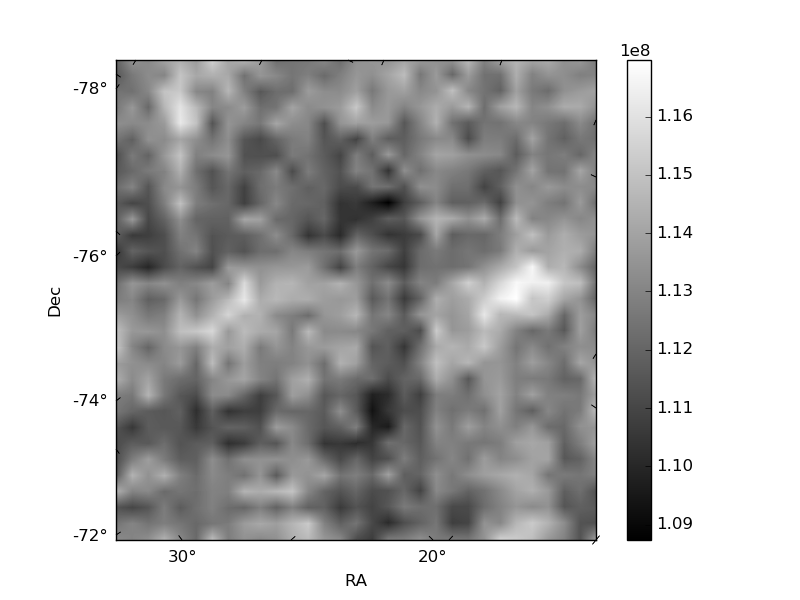
| Quadrant D | 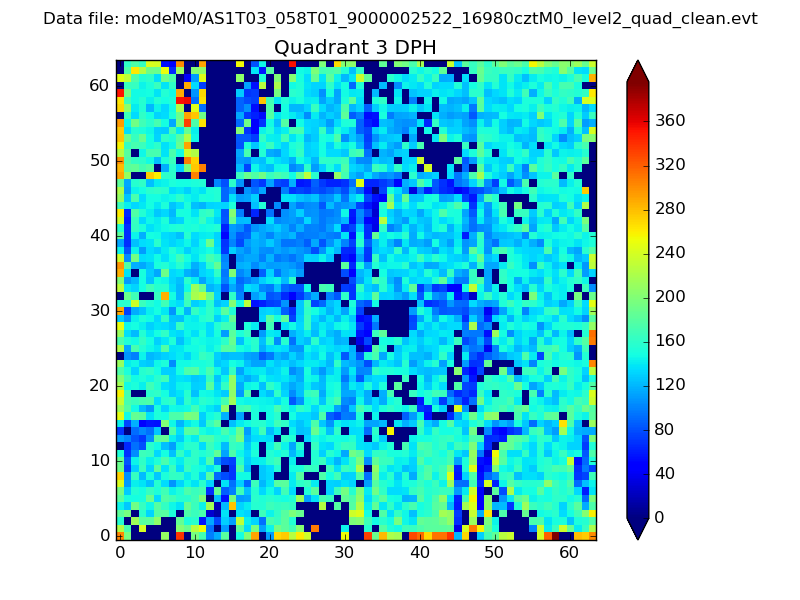 |
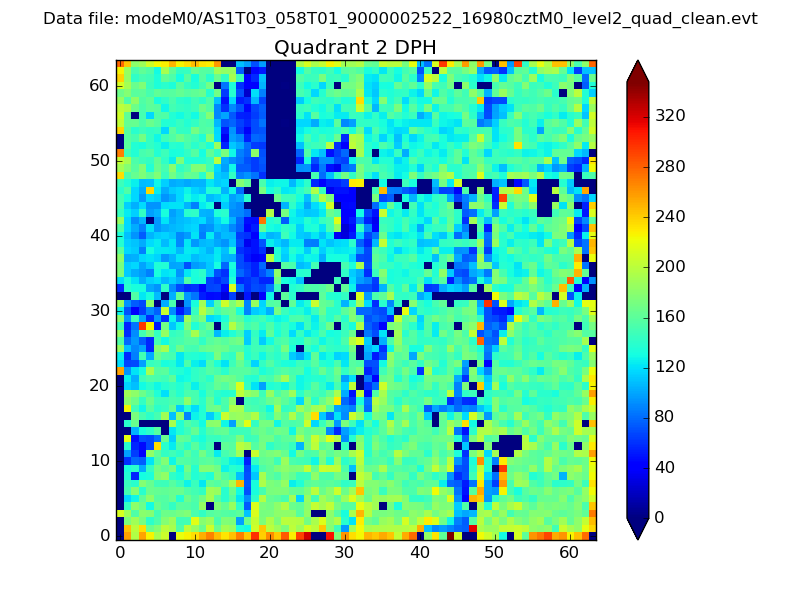 |
Quadrant C |
| Plot type | Count rate plots | Images |
|---|---|---|
| Comparison with Poisson distribution Blue bars denote a histogram of data divided into 1 sec bins. Red curve is a Poisson curve with rate = median count rate of data. |
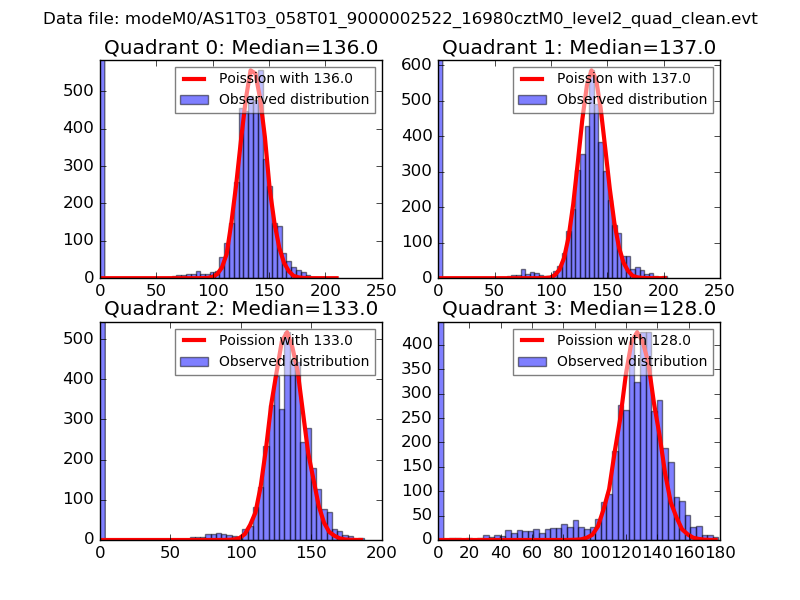 |
 |
| Quadrant-wise count rates Data is divided into 100 sec bins |
 |
|
| Module-wise count rates for Quadrant A Data is divided into 100 sec bins |
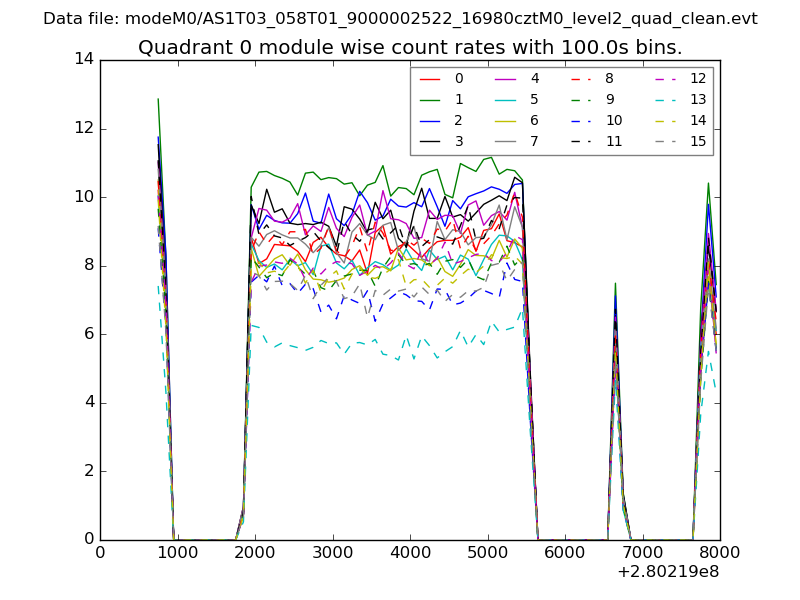 |
 |
| Module-wise count rates for Quadrant B Data is divided into 100 sec bins |
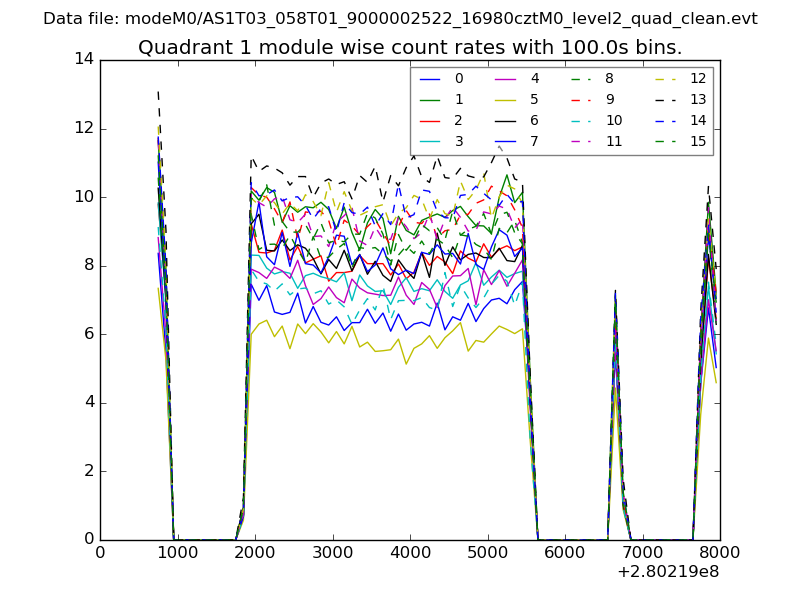 |
 |
| Module-wise count rates for Quadrant C Data is divided into 100 sec bins |
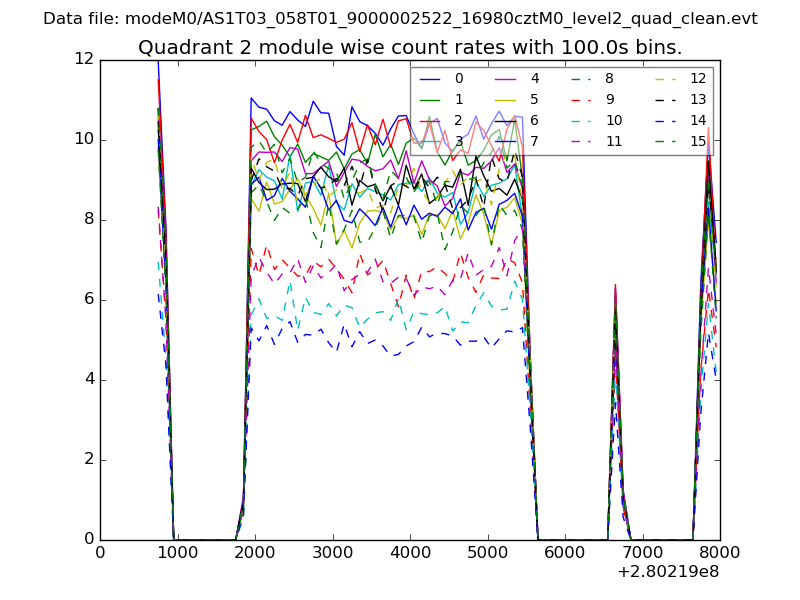 |
 |
| Module-wise count rates for Quadrant D Data is divided into 100 sec bins |
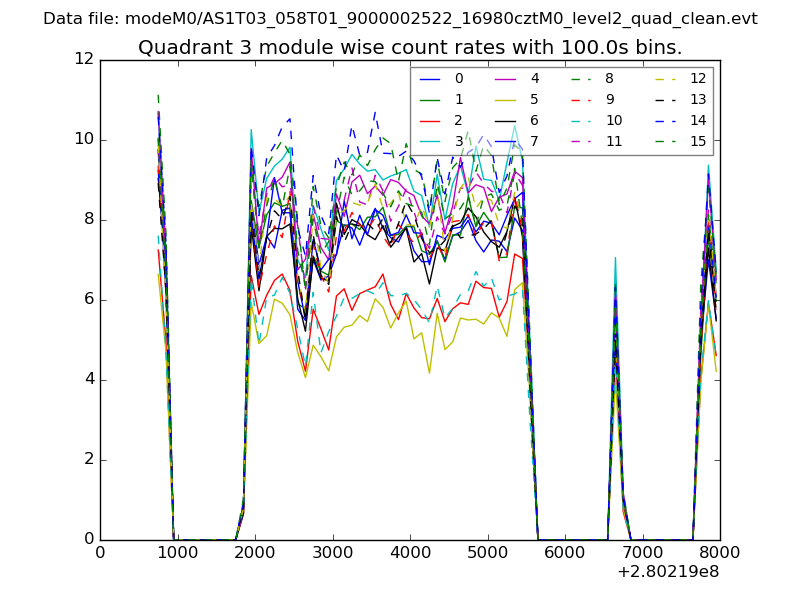 |
 |
| Parameter | Plot |
|---|---|
| CZT HV Monitor | 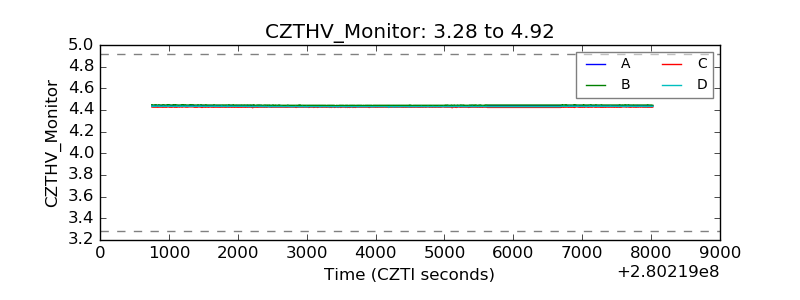 |
| D_VDD | 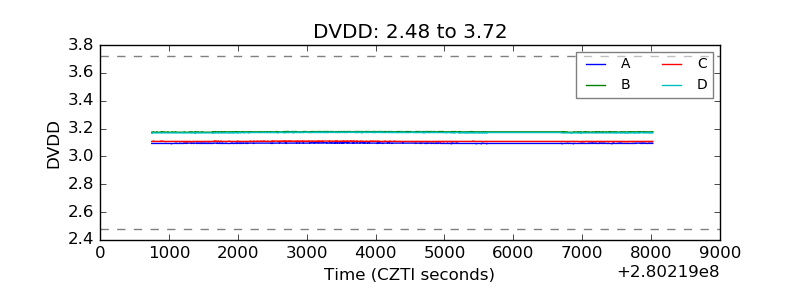 |
| Temperature 1 | 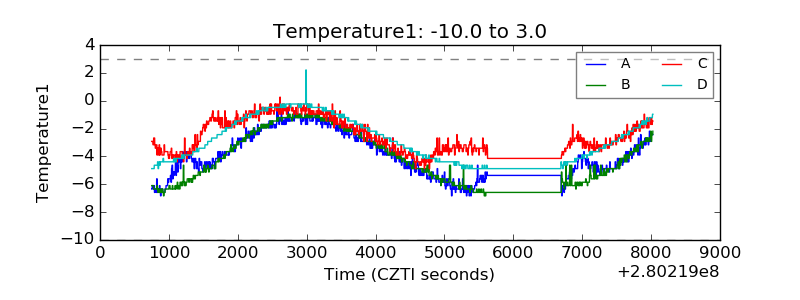 |
| Veto HV Monitor | 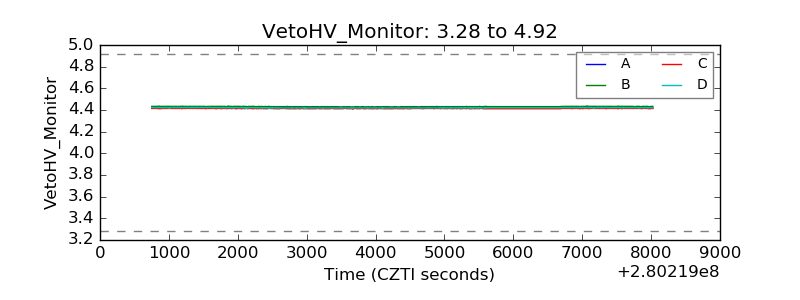 |
| Veto LLD |  |
| Alpha Counter | 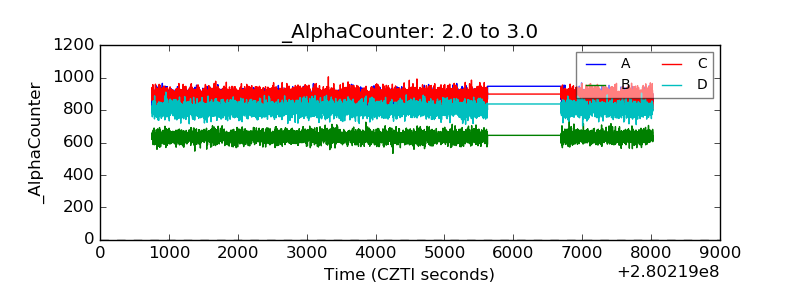 |
| _CPM_Rate | 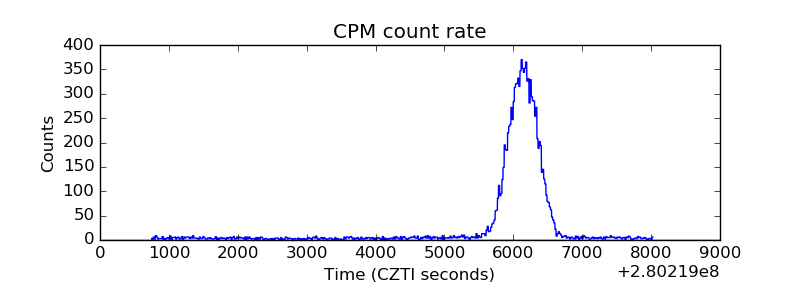 |
| CZT Counter | 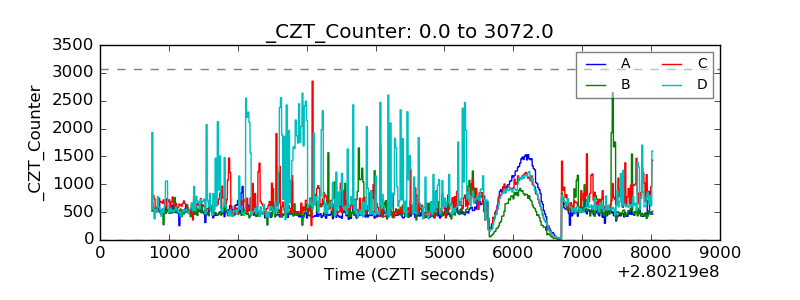 |
| +2.5 Volts monitor |  |
| +5 Volts monitor |  |
| _ROLL_ROT | 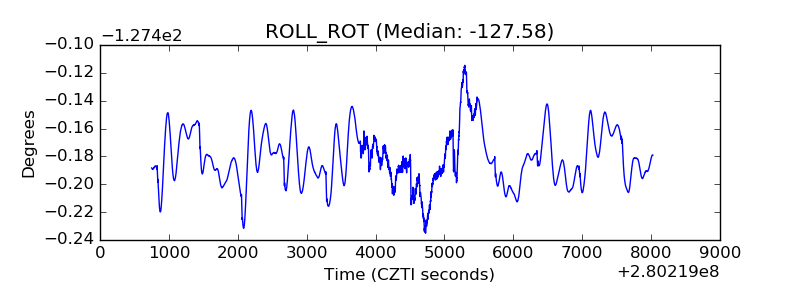 |
| _Roll_DEC | 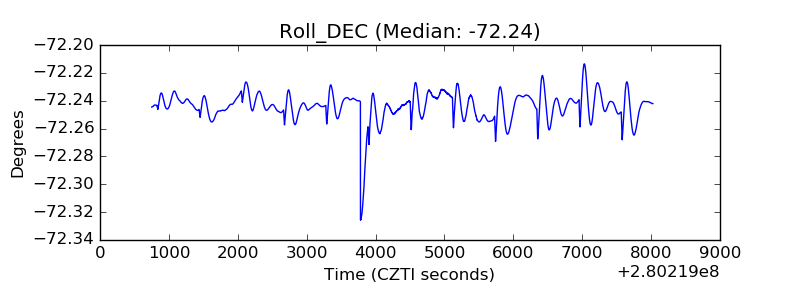 |
| _Roll_RA |  |
| Veto Counter | 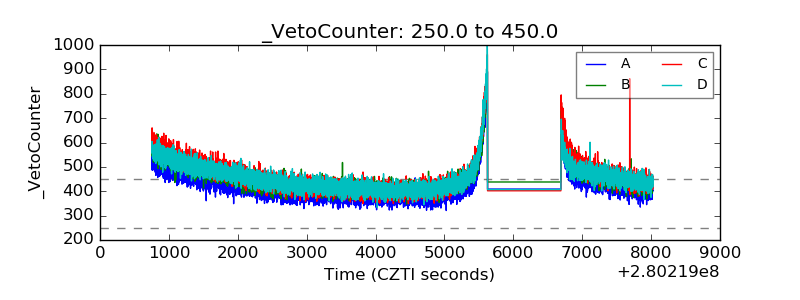 |