| Param | Original file | Final file |
|---|---|---|
| Filename | modeM0/AS1T03_058T01_9000002522_16982cztM0_level2.evt | modeM0/AS1T03_058T01_9000002522_16982cztM0_level2_quad_clean.evt |
| Size (bytes) | 660,919,680 | 117,504,000 |
| Size | 630.3 MB | 112.1 MB |
| Events in quadrant A | 3,597,183 | 780,589 |
| Events in quadrant B | 4,135,585 | 785,662 |
| Events in quadrant C | 5,065,285 | 762,659 |
| Events in quadrant D | 6,688,702 | 686,442 |
| Mode M9 | |||
|---|---|---|---|
| Quadrant | BADHDUFLAG | Total packets | Discarded packets |
| A | 0 | 3 | 0 |
| B | 0 | 4 | 0 |
| C | 0 | 4 | 0 |
| D | 0 | 4 | 0 |
| Mode M0 | |||
|---|---|---|---|
| Quadrant | BADHDUFLAG | Total packets | Discarded packets |
| A | 0 | 16095 | 2 |
| B | 0 | 17275 | 2 |
| C | 0 | 20174 | 2 |
| D | 0 | 25157 | 3 |
| Mode SS | |||
|---|---|---|---|
| Quadrant | BADHDUFLAG | Total packets | Discarded packets |
| A | 0 | 160 | 0 |
| B | 0 | 160 | 0 |
| C | 0 | 160 | 0 |
| D | 0 | 160 | 0 |
| Quadrant | Total seconds | Saturated seconds | Saturation percentage |
|---|---|---|---|
| A | 7811 | 216 | 2.765331% |
| B | 7811 | 276 | 3.533478% |
| C | 7811 | 364 | 4.660095% |
| D | 7810 | 1252 | 16.030730% |
Noise dominated data is calculated using 1-second bins in cleaned event files. If a bin has >2000 counts, and if more than 50% of those come from <1% of pixels, then it is considered to be noise-dominated and hence unusable.
| Quadrant | # 1 sec bins | Bins with >0 counts | Bins with >2000 counts | High rate bins dominated by noise | Noise dominated (total time) | Noise dominated (detector-on time) | Marked lightcurve |
|---|---|---|---|---|---|---|---|
| A | 8072 | 7814 | 0 | 0 | 0.00% | 0.00% | 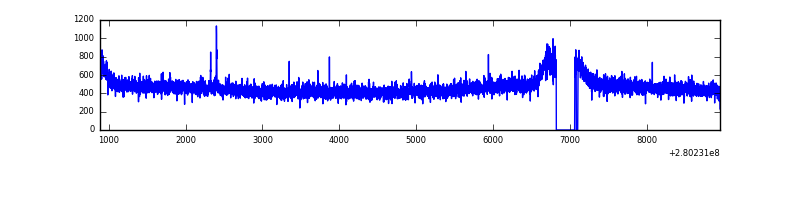 |
| B | 8072 | 7814 | 22 | 22 | 0.27% | 0.28% | 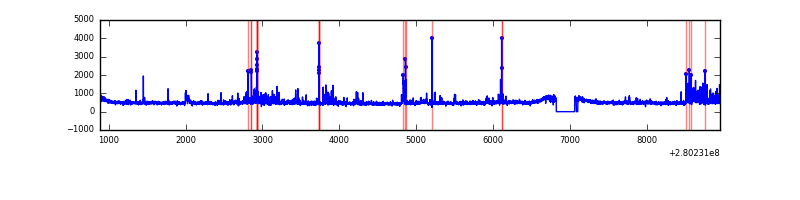 |
| C | 8072 | 7814 | 10 | 10 | 0.12% | 0.13% | 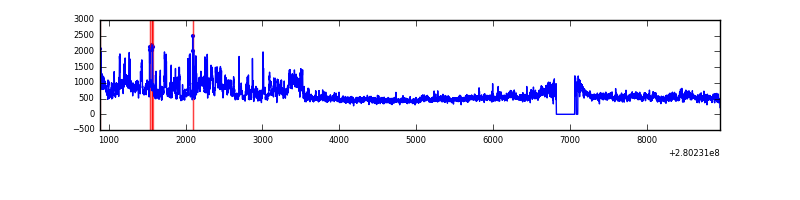 |
| D | 8071 | 7813 | 750 | 750 | 9.29% | 9.60% | 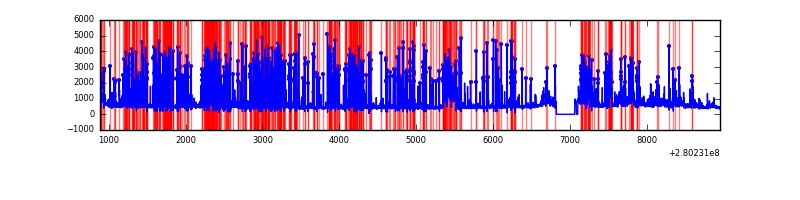 |
Top three noisy pixels from each quadrant. If the there are fewer than three noisy pixels in the level2.evt file, extra rows are filled as -1
| Pixel properties | Quadrant properties | ||||||
|---|---|---|---|---|---|---|---|
| Quadrant | DetID | PixID | Counts | Sigma | Mean | Median | Sigma |
| A | 12 | 189 | 10808 | 52.59 | 933 | 912 | 188.2 |
| A | 0 | 226 | 8178 | 38.61 | 933 | 912 | 188.2 |
| A | 12 | 194 | 6976 | 32.22 | 933 | 912 | 188.2 |
| B | 7 | 220 | 231717 | 1305.3 | 932 | 907 | 176.8 |
| B | 3 | 64 | 82325 | 460.44 | 932 | 907 | 176.8 |
| B | 15 | 35 | 38107 | 210.37 | 932 | 907 | 176.8 |
| C | 3 | 233 | 1438271 | 6935.95 | 894 | 896 | 207.2 |
| C | 14 | 238 | 137029 | 656.9 | 894 | 896 | 207.2 |
| C | 13 | 61 | 6277 | 25.96 | 894 | 896 | 207.2 |
| D | 1 | 52 | 3357757 | 16513.79 | 847 | 821 | 203.3 |
| D | 2 | 152 | 61884 | 300.39 | 847 | 821 | 203.3 |
| D | 2 | 234 | 32488 | 155.78 | 847 | 821 | 203.3 |
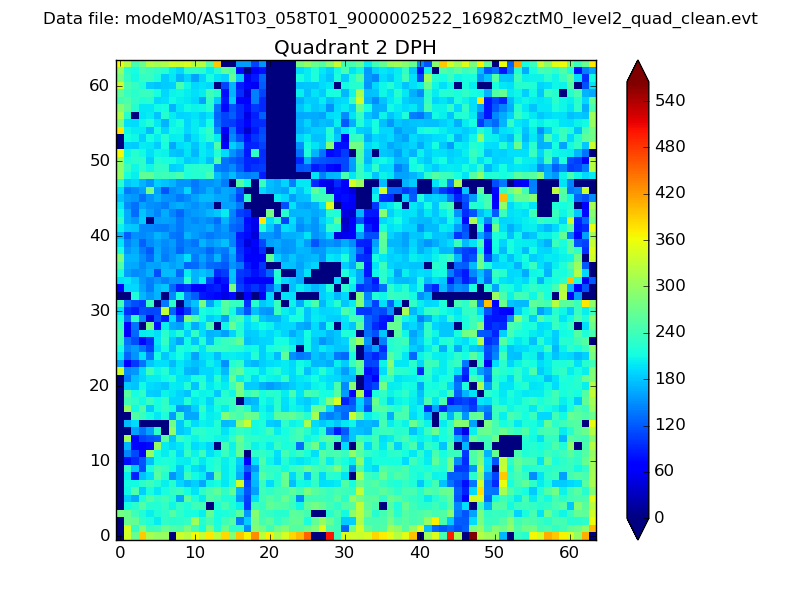
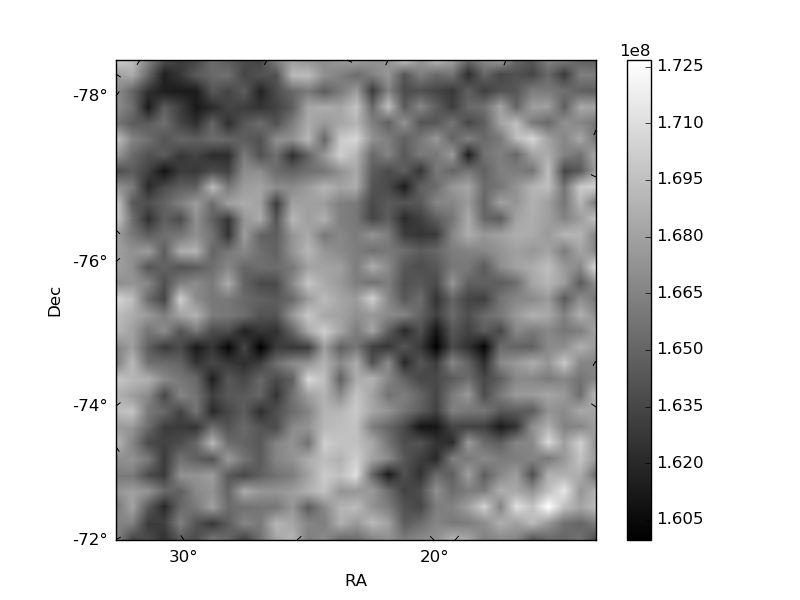
Histogram calculated using DETX and DETY for each event in the final _common_clean file
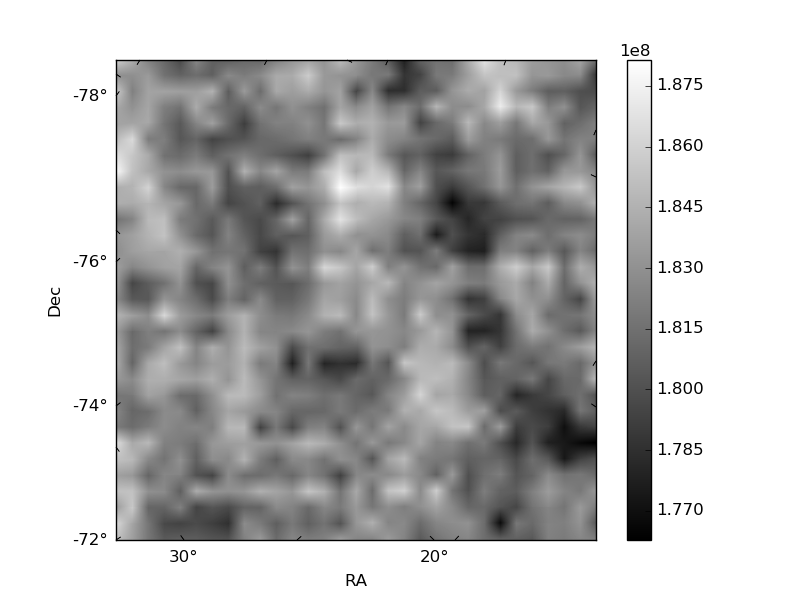
| Quadrant A | 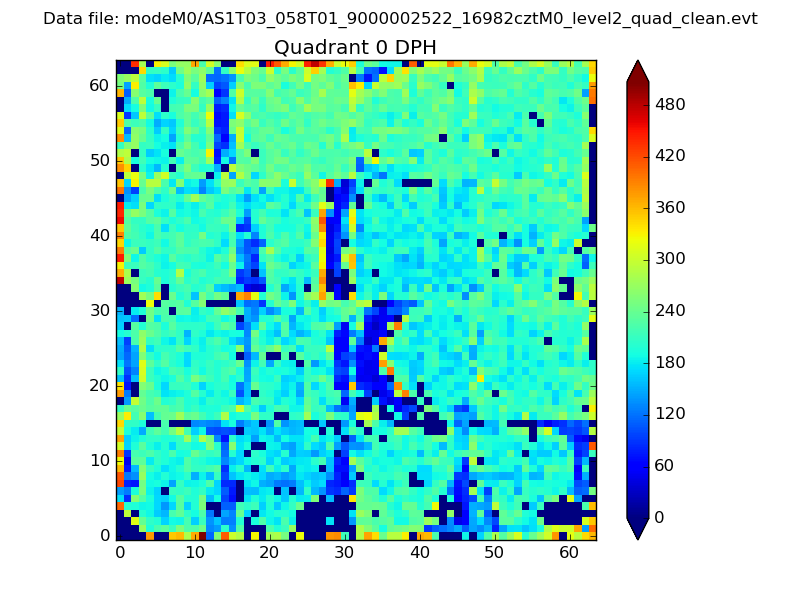 |
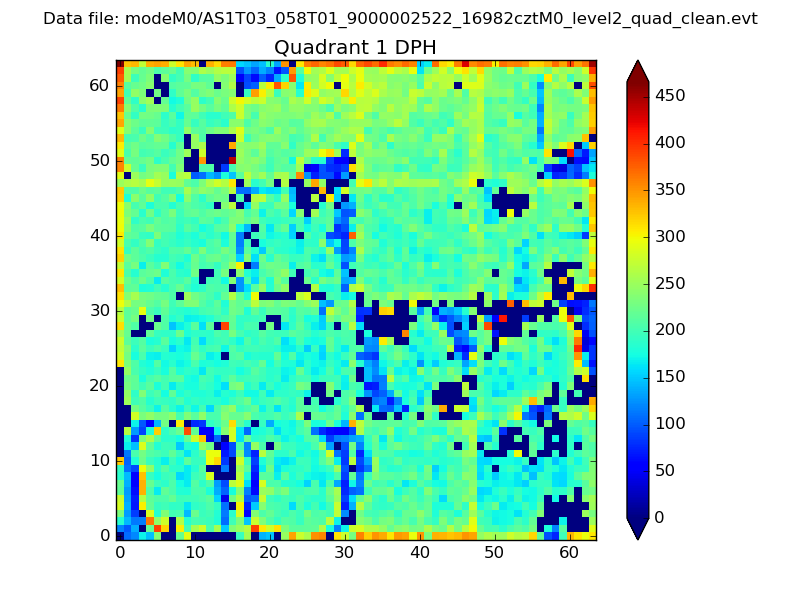 |
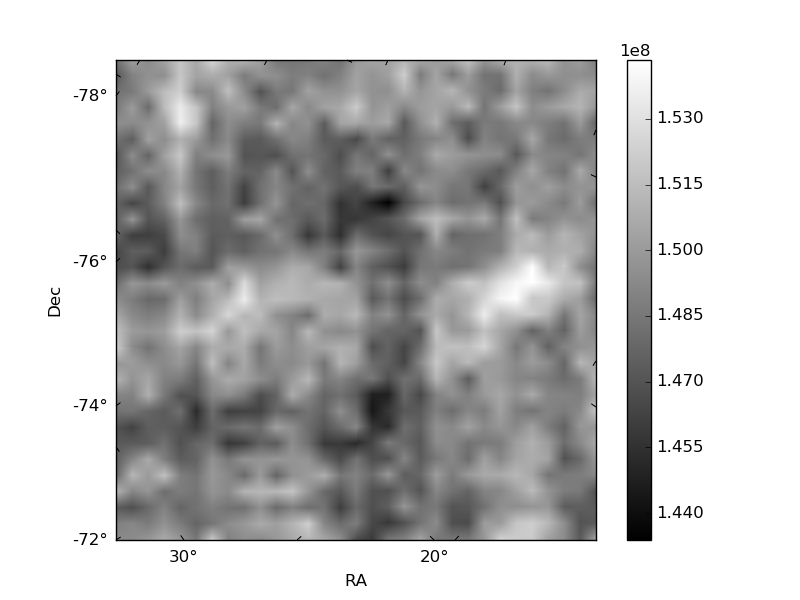
Quadrant B |
|---|---|---|---|
| Quadrant D | 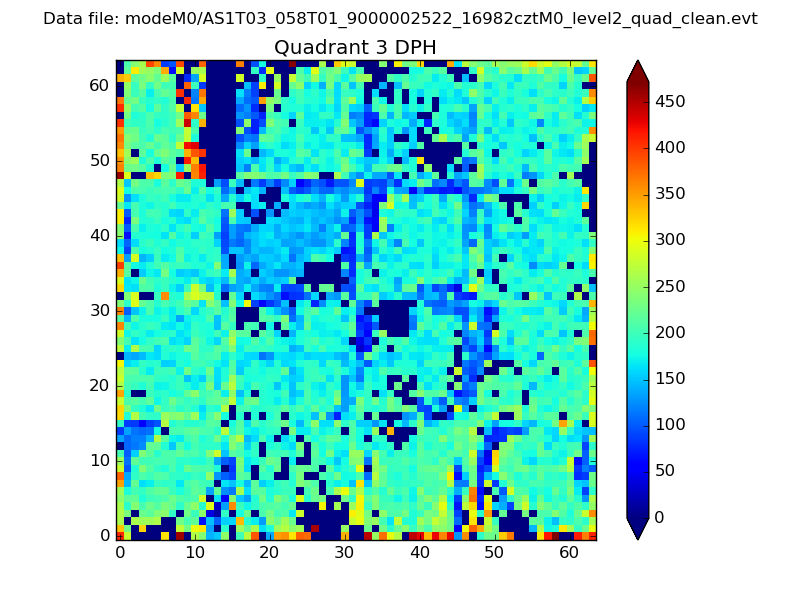 |
 |
Quadrant C |
| Plot type | Count rate plots | Images |
|---|---|---|
| Comparison with Poisson distribution Blue bars denote a histogram of data divided into 1 sec bins. Red curve is a Poisson curve with rate = median count rate of data. |
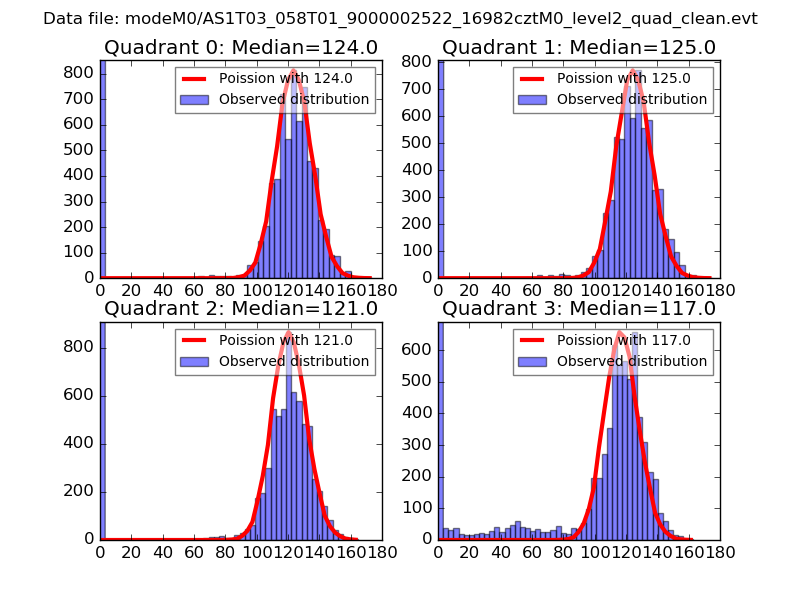 |
 |
| Quadrant-wise count rates Data is divided into 100 sec bins |
 |
|
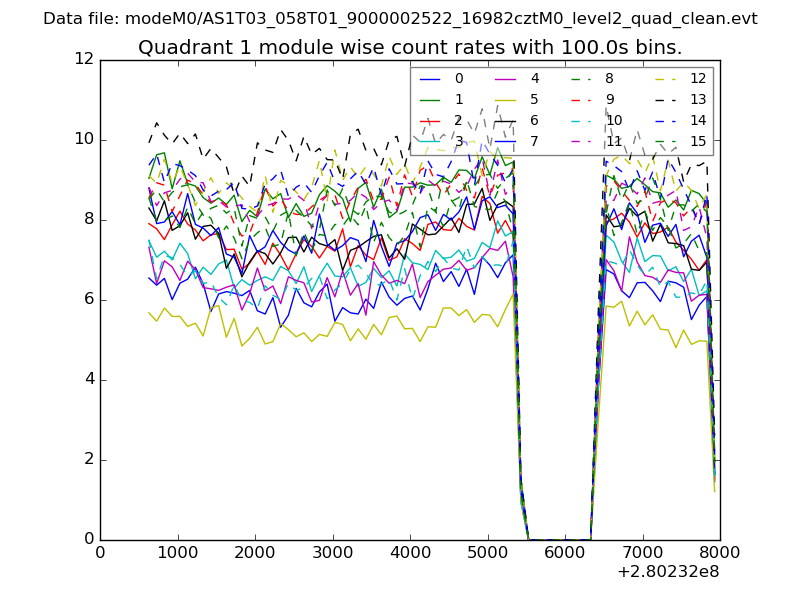
| Module-wise count rates for Quadrant A Data is divided into 100 sec bins |
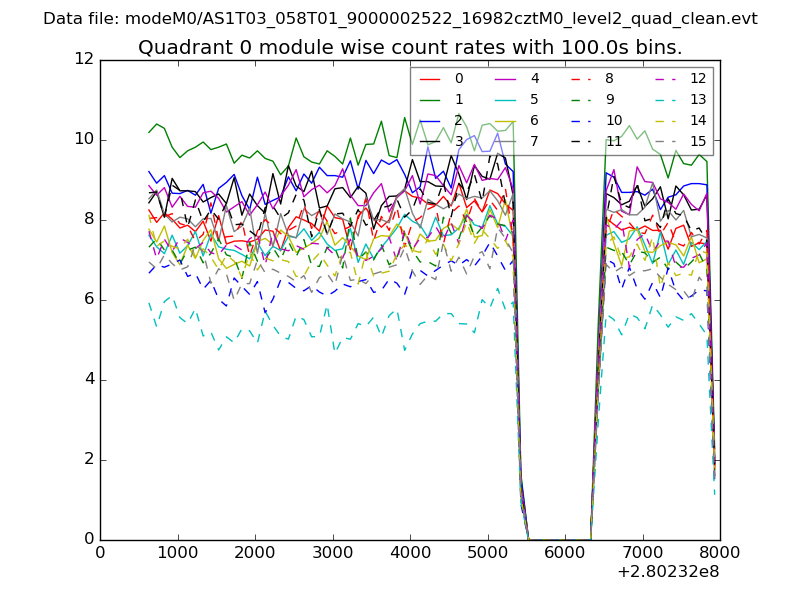 |
 |
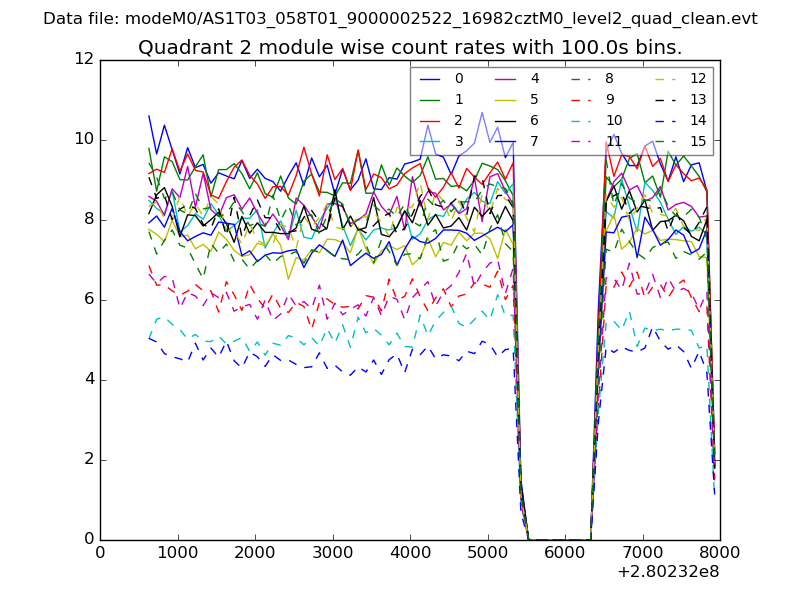
| Module-wise count rates for Quadrant B Data is divided into 100 sec bins |
 |
 |
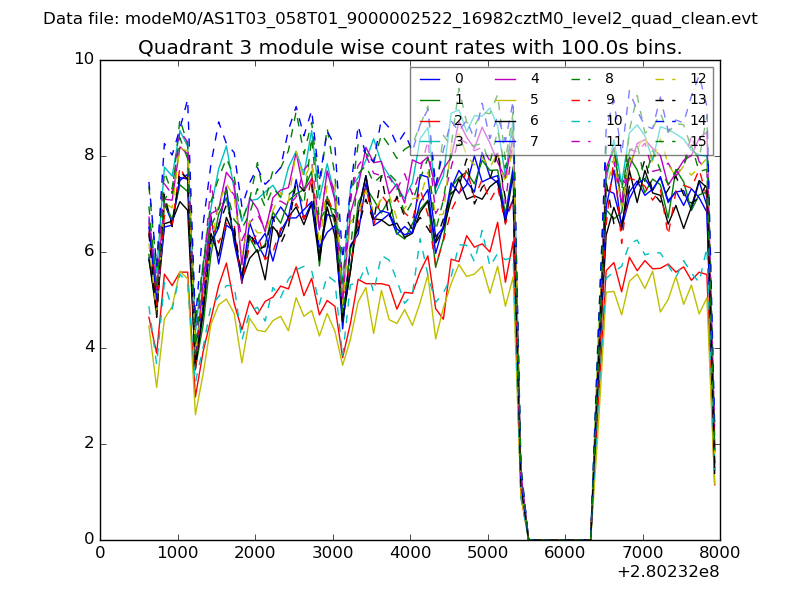
| Module-wise count rates for Quadrant C Data is divided into 100 sec bins |
 |
 |
| Module-wise count rates for Quadrant D Data is divided into 100 sec bins |
 |
 |
| Parameter | Plot |
|---|---|
| CZT HV Monitor | 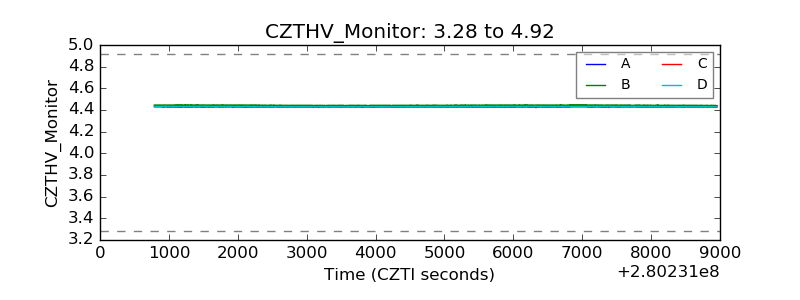 |
| D_VDD | 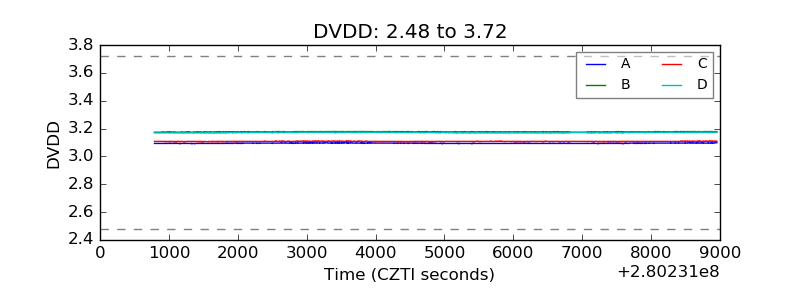 |
| Temperature 1 | 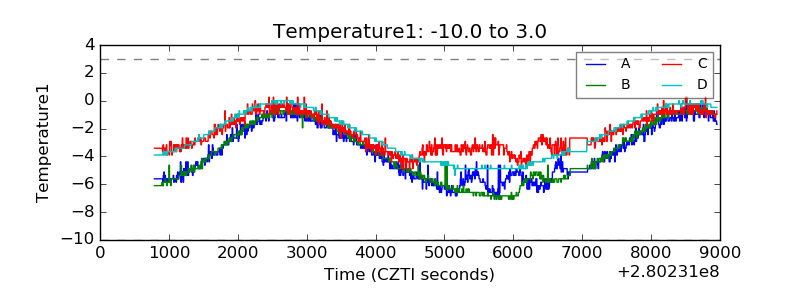 |
| Veto HV Monitor | 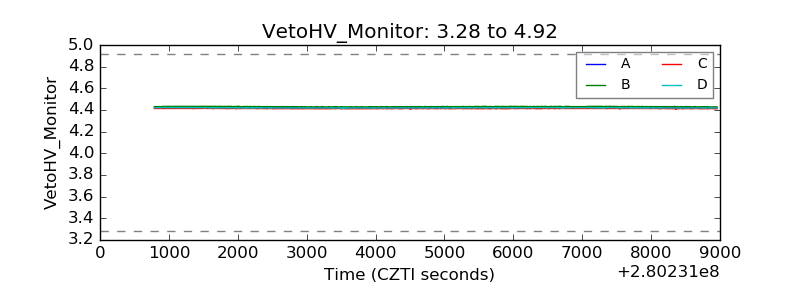 |
| Veto LLD | 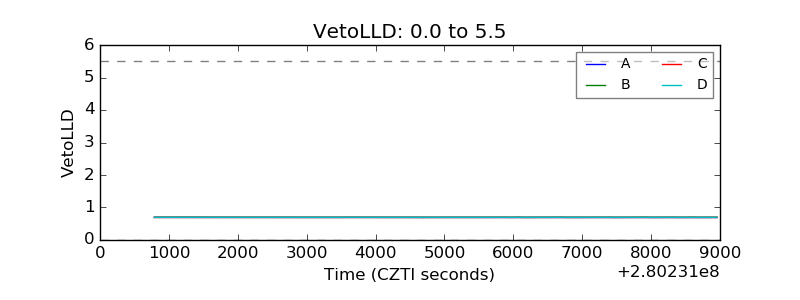 |
| Alpha Counter | 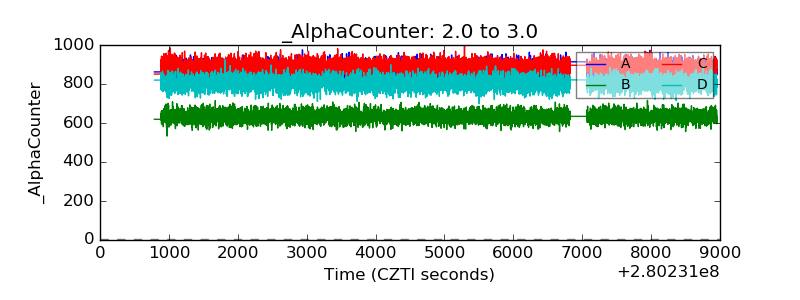 |
| _CPM_Rate | 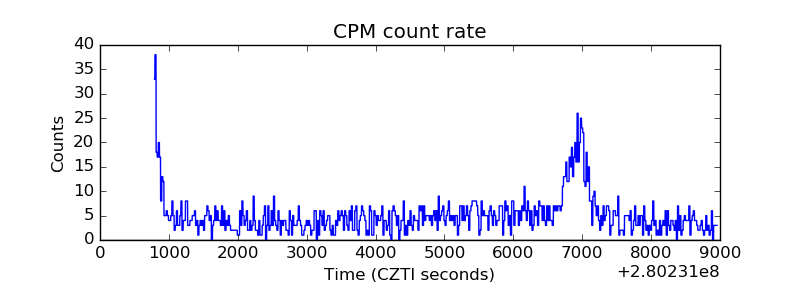 |
| CZT Counter |  |
| +2.5 Volts monitor |  |
| +5 Volts monitor |  |
| _ROLL_ROT | 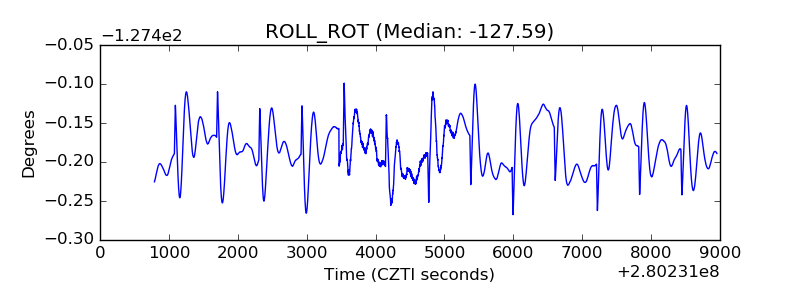 |
| _Roll_DEC | 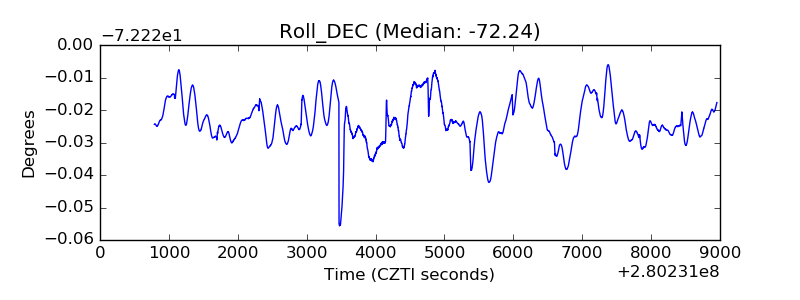 |
| _Roll_RA | 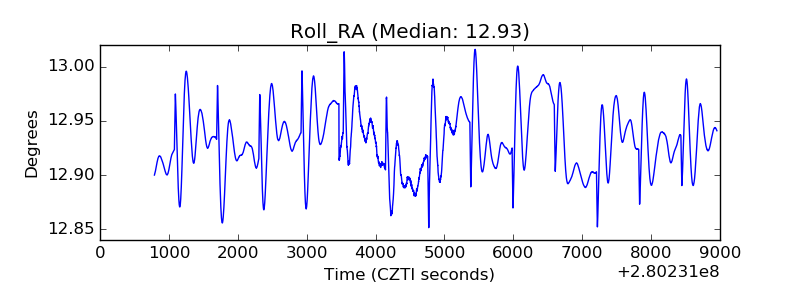 |
| Veto Counter | 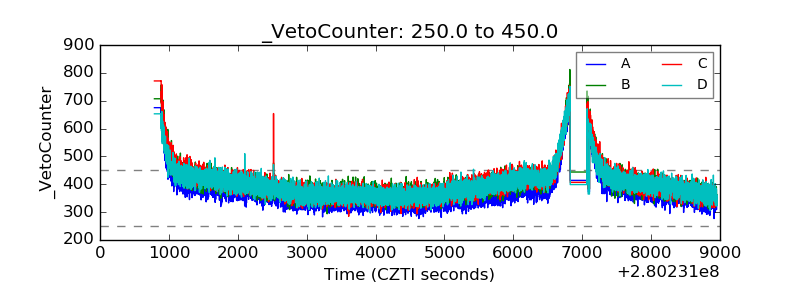 |