| Param | Original file | Final file |
|---|---|---|
| Filename | modeM0/AS1T03_058T01_9000002522_16983cztM0_level2.evt | modeM0/AS1T03_058T01_9000002522_16983cztM0_level2_quad_clean.evt |
| Size (bytes) | 571,538,880 | 120,893,760 |
| Size | 545.1 MB | 115.3 MB |
| Events in quadrant A | 3,437,775 | 798,319 |
| Events in quadrant B | 4,217,642 | 801,057 |
| Events in quadrant C | 4,186,222 | 779,287 |
| Events in quadrant D | 4,958,646 | 760,976 |
| Mode M0 | |||
|---|---|---|---|
| Quadrant | BADHDUFLAG | Total packets | Discarded packets |
| A | 0 | 15468 | 1 |
| B | 0 | 17483 | 1 |
| C | 0 | 17452 | 1 |
| D | 0 | 19959 | 1 |
| Mode SS | |||
|---|---|---|---|
| Quadrant | BADHDUFLAG | Total packets | Discarded packets |
| A | 0 | 150 | 0 |
| B | 0 | 150 | 0 |
| C | 0 | 150 | 0 |
| D | 0 | 150 | 0 |
| Quadrant | Total seconds | Saturated seconds | Saturation percentage |
|---|---|---|---|
| A | 7498 | 205 | 2.734062% |
| B | 7499 | 296 | 3.947193% |
| C | 7499 | 266 | 3.547140% |
| D | 7499 | 315 | 4.200560% |
Noise dominated data is calculated using 1-second bins in cleaned event files. If a bin has >2000 counts, and if more than 50% of those come from <1% of pixels, then it is considered to be noise-dominated and hence unusable.
| Quadrant | # 1 sec bins | Bins with >0 counts | Bins with >2000 counts | High rate bins dominated by noise | Noise dominated (total time) | Noise dominated (detector-on time) | Marked lightcurve |
|---|---|---|---|---|---|---|---|
| A | 7524 | 7500 | 0 | 0 | 0.00% | 0.00% | 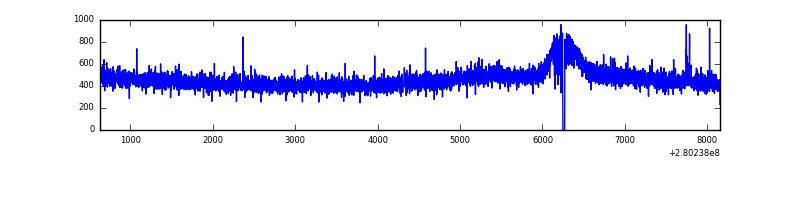 |
| B | 7525 | 7501 | 47 | 47 | 0.62% | 0.63% | 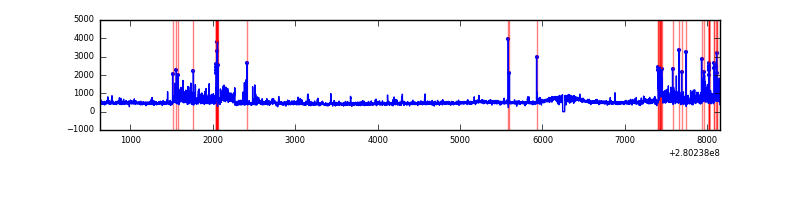 |
| C | 7525 | 7501 | 0 | 0 | 0.00% | 0.00% | 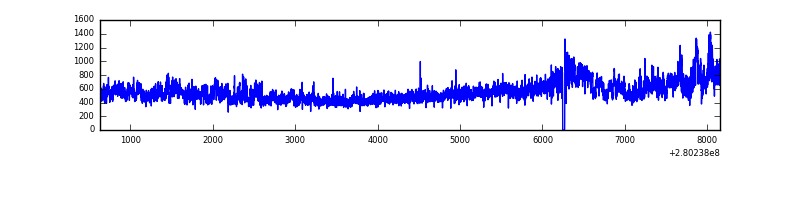 |
| D | 7525 | 7501 | 94 | 94 | 1.25% | 1.25% | 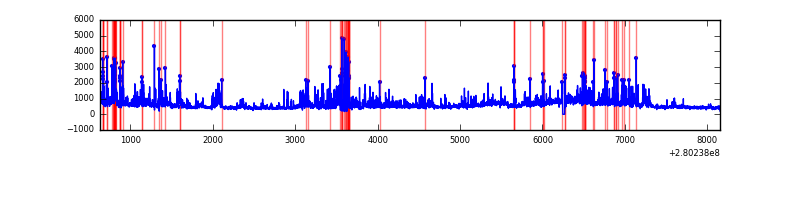 |
Top three noisy pixels from each quadrant. If the there are fewer than three noisy pixels in the level2.evt file, extra rows are filled as -1
| Pixel properties | Quadrant properties | ||||||
|---|---|---|---|---|---|---|---|
| Quadrant | DetID | PixID | Counts | Sigma | Mean | Median | Sigma |
| A | 15 | 174 | 9210 | 46.47 | 890 | 870 | 179.5 |
| A | 12 | 189 | 8845 | 44.44 | 890 | 870 | 179.5 |
| A | 0 | 226 | 7877 | 39.04 | 890 | 870 | 179.5 |
| B | 7 | 220 | 308446 | 1840.38 | 885 | 861 | 167.1 |
| B | 4 | 216 | 147365 | 876.58 | 885 | 861 | 167.1 |
| B | 15 | 35 | 70933 | 419.26 | 885 | 861 | 167.1 |
| C | 3 | 233 | 724678 | 3666.35 | 850 | 853 | 197.4 |
| C | 14 | 238 | 131911 | 663.84 | 850 | 853 | 197.4 |
| C | 0 | 207 | 11829 | 55.6 | 850 | 853 | 197.4 |
| D | 1 | 52 | 1553324 | 7412.43 | 862 | 833 | 209.4 |
| D | 2 | 152 | 51670 | 242.72 | 862 | 833 | 209.4 |
| D | 15 | 145 | 37305 | 174.13 | 862 | 833 | 209.4 |
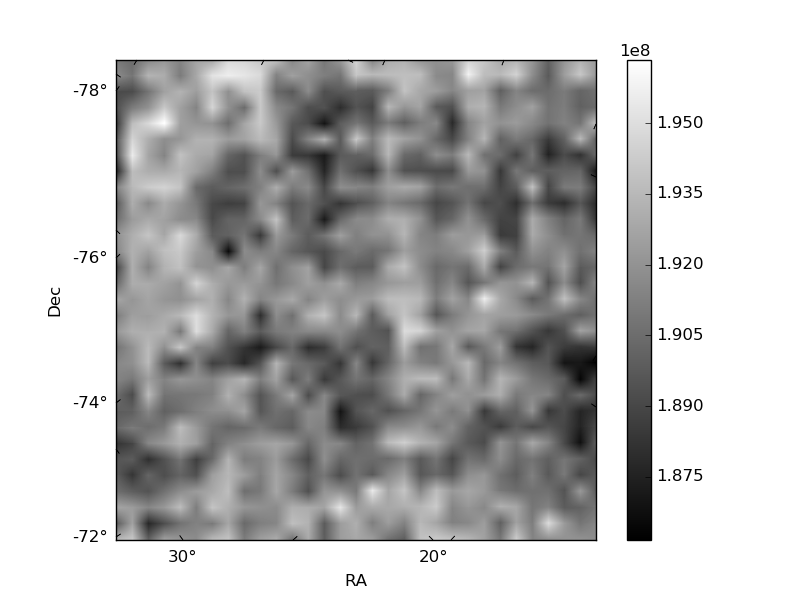
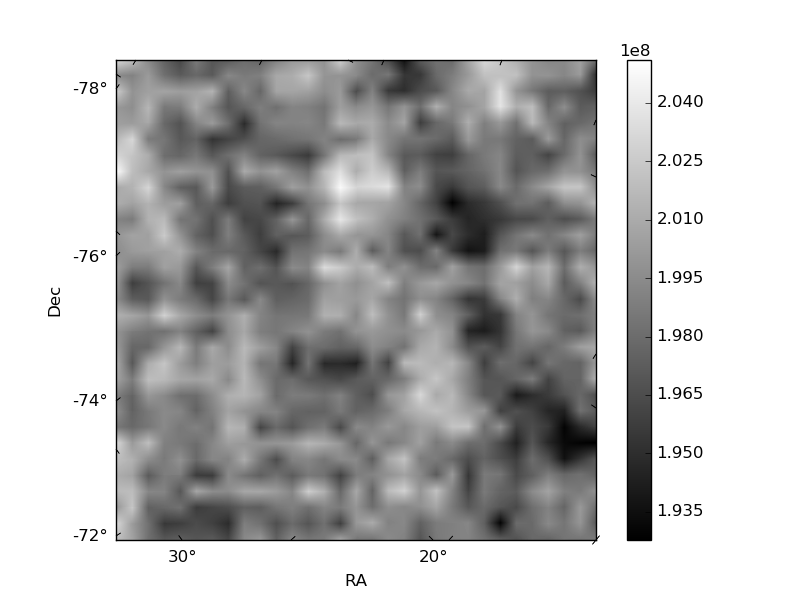
Histogram calculated using DETX and DETY for each event in the final _common_clean file
| Quadrant A |  |
 |
Quadrant B |
|---|---|---|---|
| Quadrant D |  |
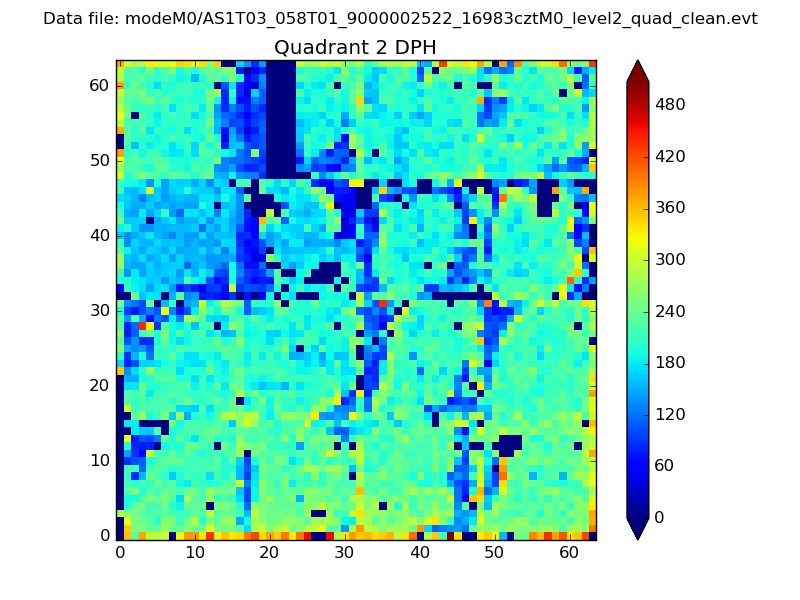 |
Quadrant C |
| Plot type | Count rate plots | Images |
|---|---|---|
| Comparison with Poisson distribution Blue bars denote a histogram of data divided into 1 sec bins. Red curve is a Poisson curve with rate = median count rate of data. |
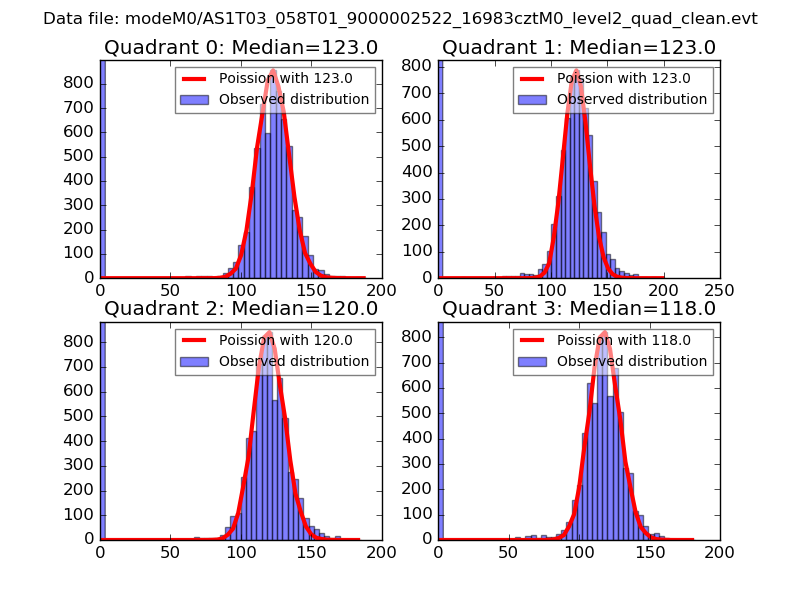 |
 |
| Quadrant-wise count rates Data is divided into 100 sec bins |
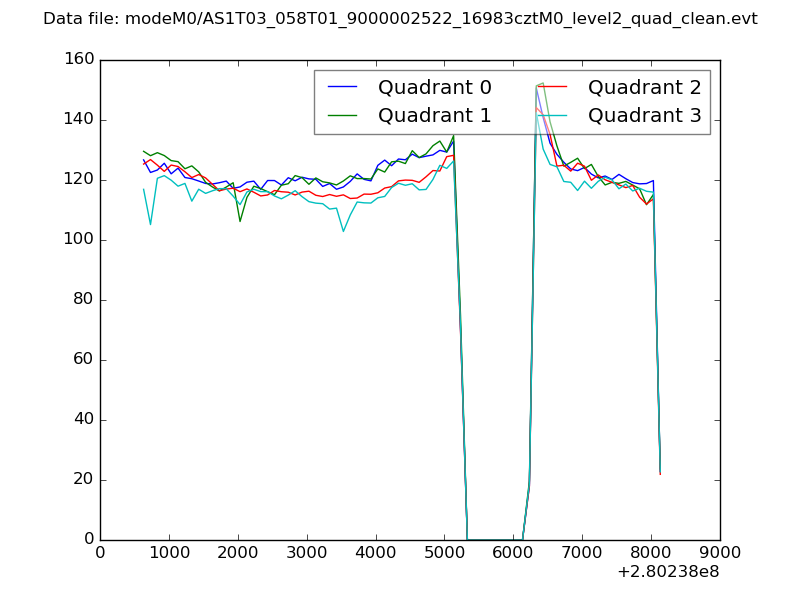 |
|
| Module-wise count rates for Quadrant A Data is divided into 100 sec bins |
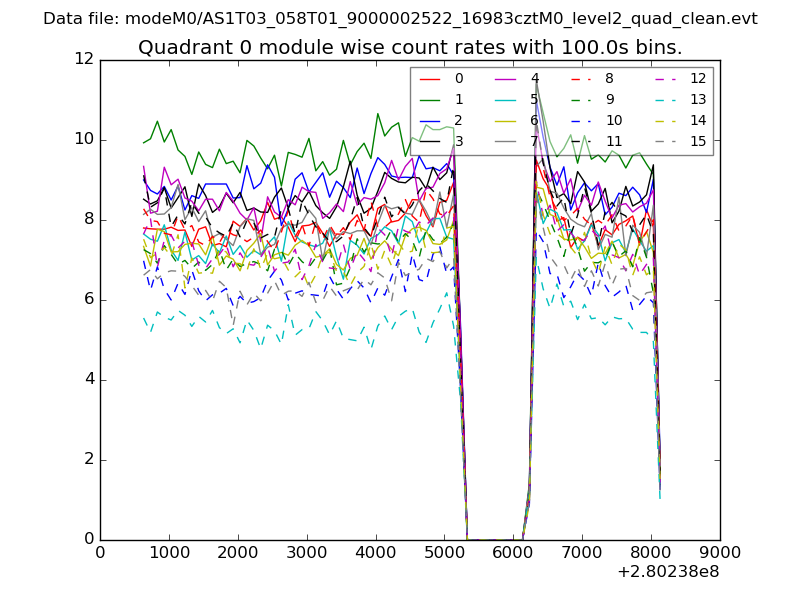 |
 |
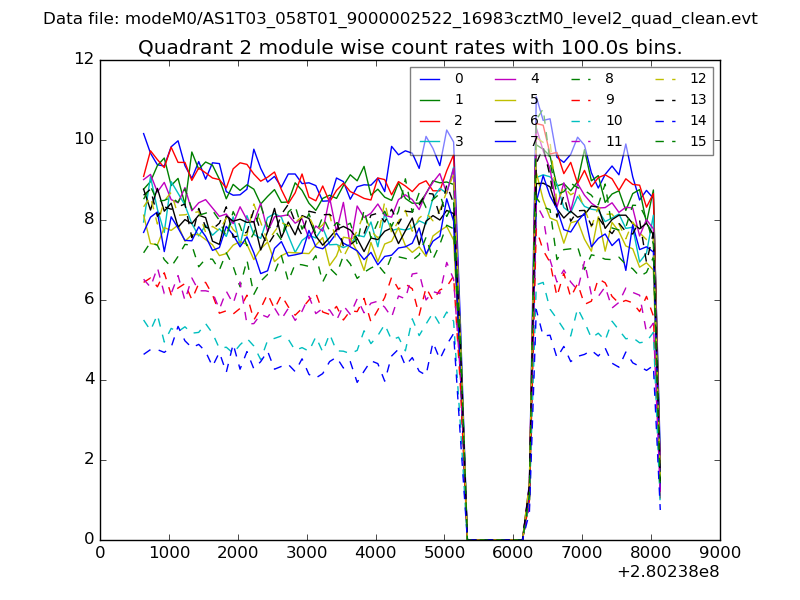
| Module-wise count rates for Quadrant B Data is divided into 100 sec bins |
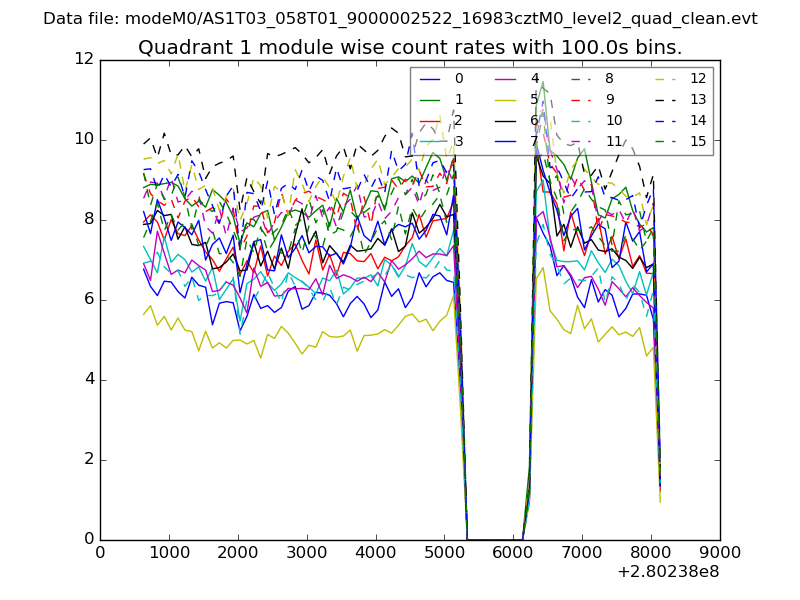 |
 |
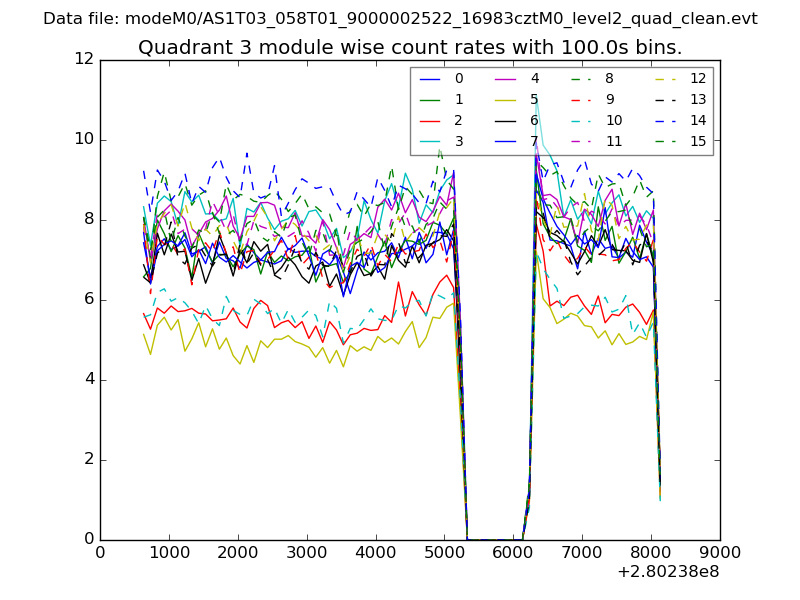
| Module-wise count rates for Quadrant C Data is divided into 100 sec bins |
 |
 |
| Module-wise count rates for Quadrant D Data is divided into 100 sec bins |
 |
 |
| Parameter | Plot |
|---|---|
| CZT HV Monitor | 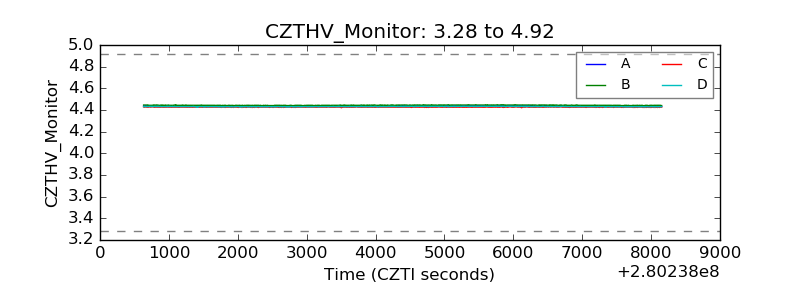 |
| D_VDD | 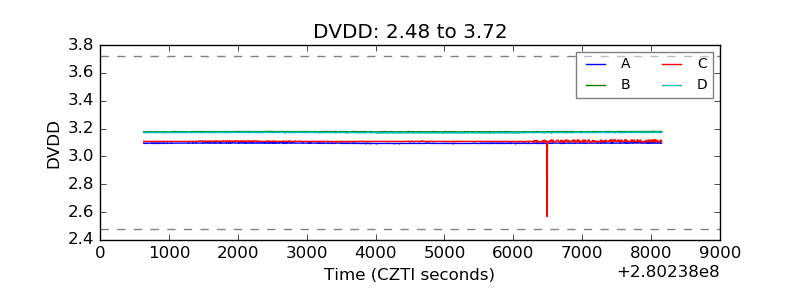 |
| Temperature 1 | 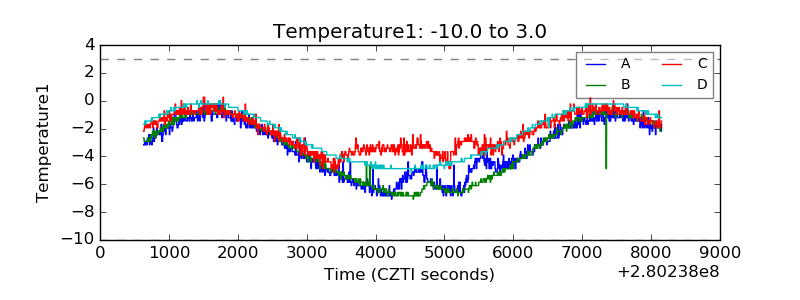 |
| Veto HV Monitor |  |
| Veto LLD | 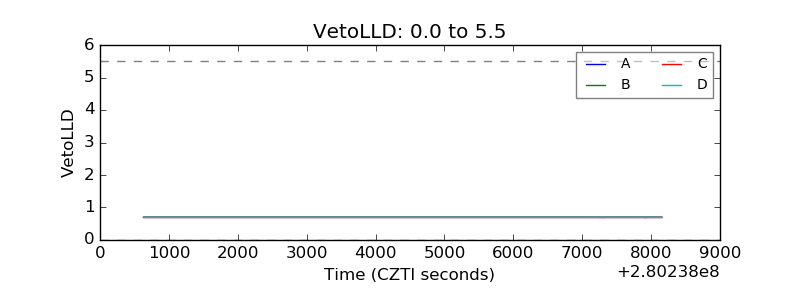 |
| Alpha Counter | 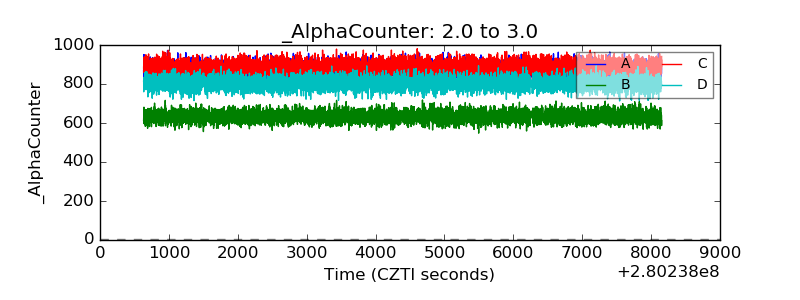 |
| _CPM_Rate |  |
| CZT Counter | 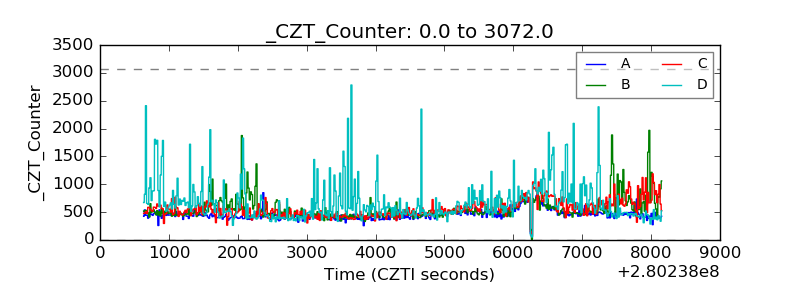 |
| +2.5 Volts monitor |  |
| +5 Volts monitor |  |
| _ROLL_ROT | 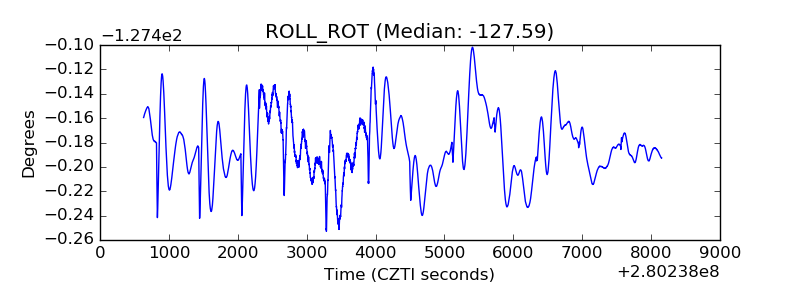 |
| _Roll_DEC | 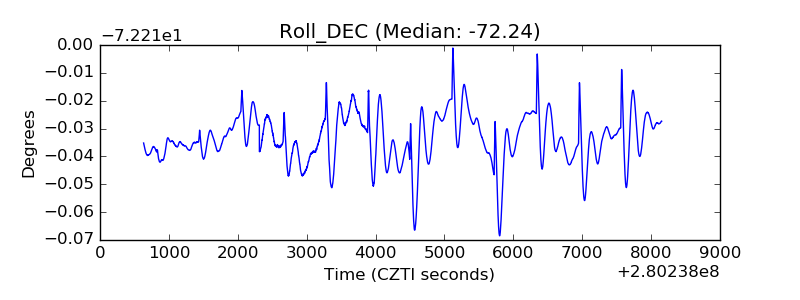 |
| _Roll_RA | 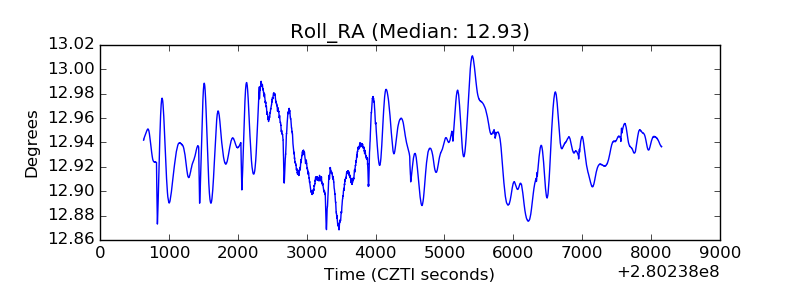 |
| Veto Counter | 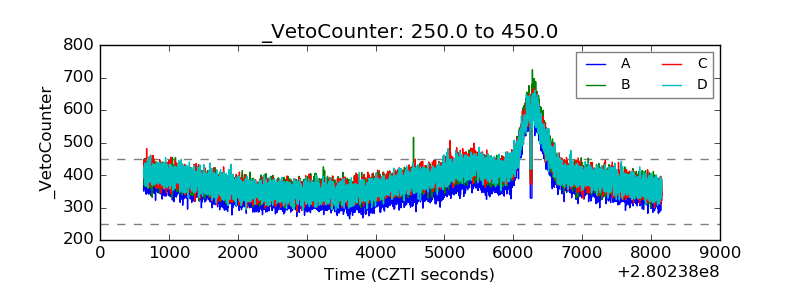 |