| Param | Original file | Final file |
|---|---|---|
| Filename | modeM0/AS1A05_206T01_9000002528cztM0_level2.fits | modeM0/AS1A05_206T01_9000002528cztM0_level2_quad_clean.evt |
| Size (bytes) | 815,639,040 | 915,984,000 |
| Size | 777.9 MB | 873.6 MB |
| Events in quadrant A | 4,921,966 | 5,655,047 |
| Events in quadrant B | 4,725,706 | 5,689,133 |
| Events in quadrant C | 4,906,410 | 5,486,143 |
| Events in quadrant D | 4,264,386 | 5,031,318 |
| Mode M9 | |||
|---|---|---|---|
| Quadrant | BADHDUFLAG | Total packets | Discarded packets |
| A | 0 | 122 | 0 |
| B | 0 | 122 | 0 |
| C | 0 | 122 | 0 |
| D | 0 | 122 | 0 |
| Mode SS | |||
|---|---|---|---|
| Quadrant | BADHDUFLAG | Total packets | Discarded packets |
| A | 0 | 1744 | 0 |
| B | 0 | 1744 | 0 |
| C | 0 | 1744 | 0 |
| D | 0 | 1744 | 0 |
| Mode M0 | |||
|---|---|---|---|
| Quadrant | BADHDUFLAG | Total packets | Discarded packets |
| A | 0 | 190208 | 0 |
| B | 0 | 198256 | 0 |
| C | 0 | 180231 | 0 |
| D | 0 | 200716 | 0 |
| Quadrant | Total seconds | Saturated seconds | Saturation percentage |
|---|---|---|---|
| A | 85792 | 2523 | 2.940834% |
| B | 85792 | 2868 | 3.342969% |
| C | 85792 | 1668 | 1.944237% |
| D | 85792 | 2270 | 2.645934% |
Noise dominated data is calculated using 1-second bins in cleaned event files. If a bin has >2000 counts, and if more than 50% of those come from <1% of pixels, then it is considered to be noise-dominated and hence unusable.
| Quadrant | # 1 sec bins | Bins with >0 counts | Bins with >2000 counts | High rate bins dominated by noise | Noise dominated (total time) | Noise dominated (detector-on time) | Marked lightcurve |
|---|---|---|---|---|---|---|---|
| A | 97431 | 85791 | 0 | 0 | 0.00% | 0.00% |  |
| B | 97431 | 85777 | 0 | 0 | 0.00% | 0.00% |  |
| C | 97431 | 85789 | 0 | 0 | 0.00% | 0.00% |  |
| D | 97431 | 85778 | 0 | 0 | 0.00% | 0.00% |  |
Top three noisy pixels from each quadrant. If the there are fewer than three noisy pixels in the level2.evt file, extra rows are filled as -1
| Pixel properties | Quadrant properties | ||||||
|---|---|---|---|---|---|---|---|
| Quadrant | DetID | PixID | Counts | Sigma | Mean | Median | Sigma |
| A | 0 | 29 | 4651 | 10.87 | 1281 | 1198 | 317.7 |
| A | 7 | 110 | 4008 | 8.84 | 1281 | 1198 | 317.7 |
| A | 0 | 30 | 3814 | 8.23 | 1281 | 1198 | 317.7 |
| B | 2 | 9 | 4018 | 11.72 | 1252 | 1198 | 240.6 |
| B | 2 | 8 | 3295 | 8.72 | 1252 | 1198 | 240.6 |
| B | 3 | 17 | 3183 | 8.25 | 1252 | 1198 | 240.6 |
| C | 12 | 241 | 3445 | 6.81 | 1297 | 1215 | 327.3 |
| C | 3 | 126 | 3342 | 6.5 | 1297 | 1215 | 327.3 |
| C | 2 | 191 | 3229 | 6.15 | 1297 | 1215 | 327.3 |
| D | 3 | 14 | 3176 | 6.49 | 1215 | 1109 | 318.4 |
| D | 6 | 231 | 3116 | 6.3 | 1215 | 1109 | 318.4 |
| D | 7 | 3 | 2965 | 5.83 | 1215 | 1109 | 318.4 |
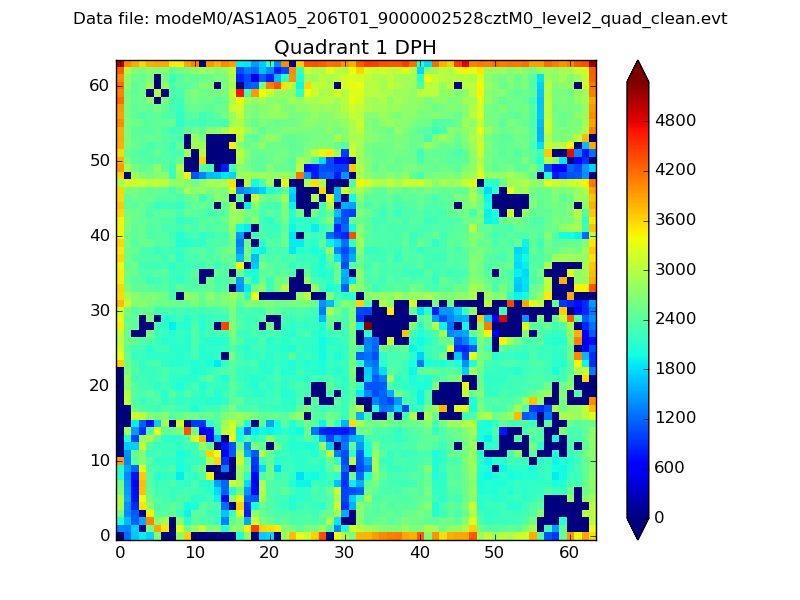
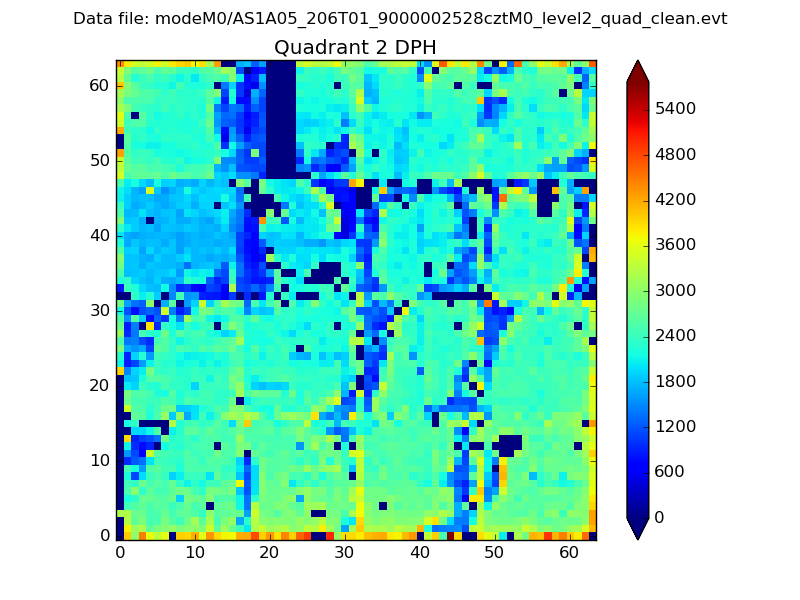
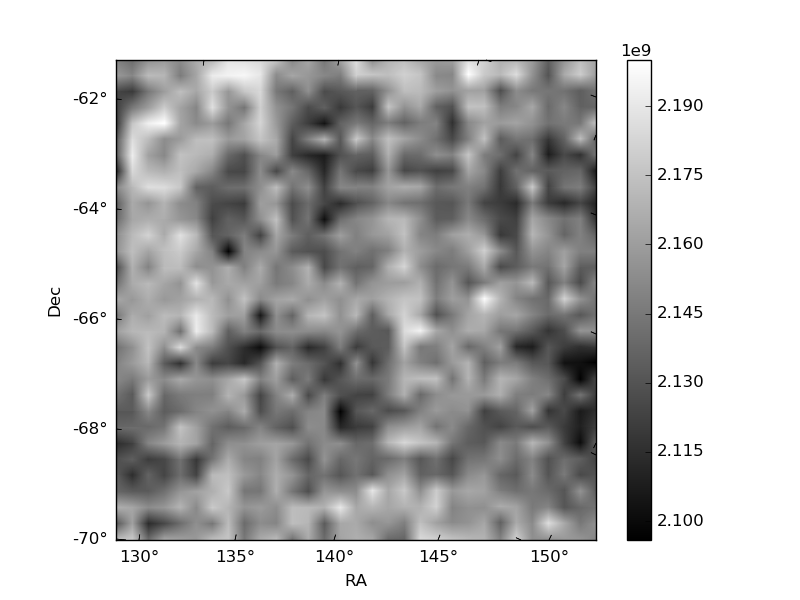
Histogram calculated using DETX and DETY for each event in the final _common_clean file
| Quadrant A |  |
 |
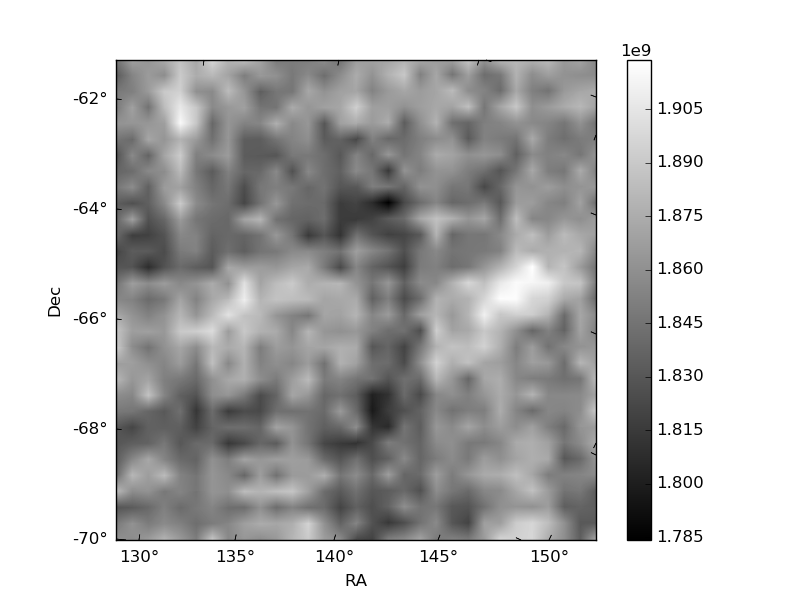
Quadrant B |
|---|---|---|---|
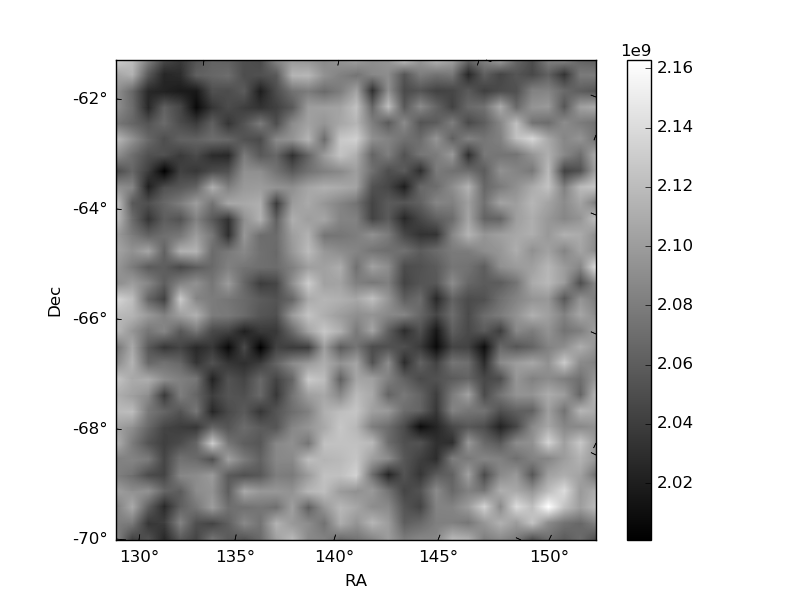
| Quadrant D |  |
 |
Quadrant C |
| Plot type | Count rate plots | Images |
|---|---|---|
| Comparison with Poisson distribution Blue bars denote a histogram of data divided into 1 sec bins. Red curve is a Poisson curve with rate = median count rate of data. |
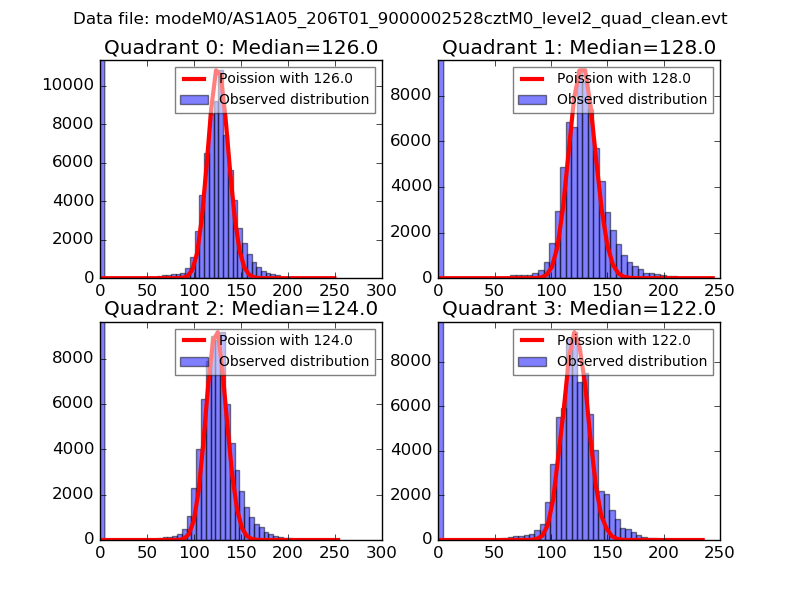 |
 |
| Quadrant-wise count rates Data is divided into 100 sec bins |
 |
|
| Module-wise count rates for Quadrant A Data is divided into 100 sec bins |
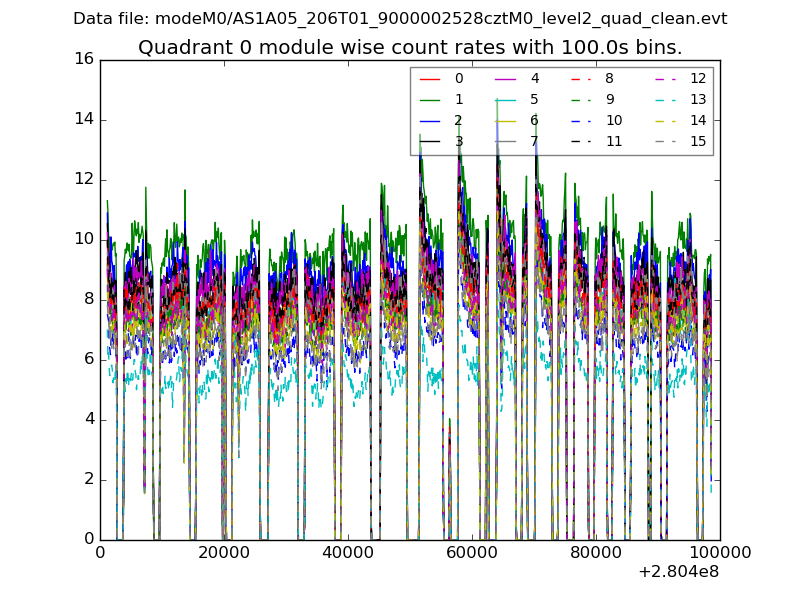 |
 |
| Module-wise count rates for Quadrant B Data is divided into 100 sec bins |
 |
 |
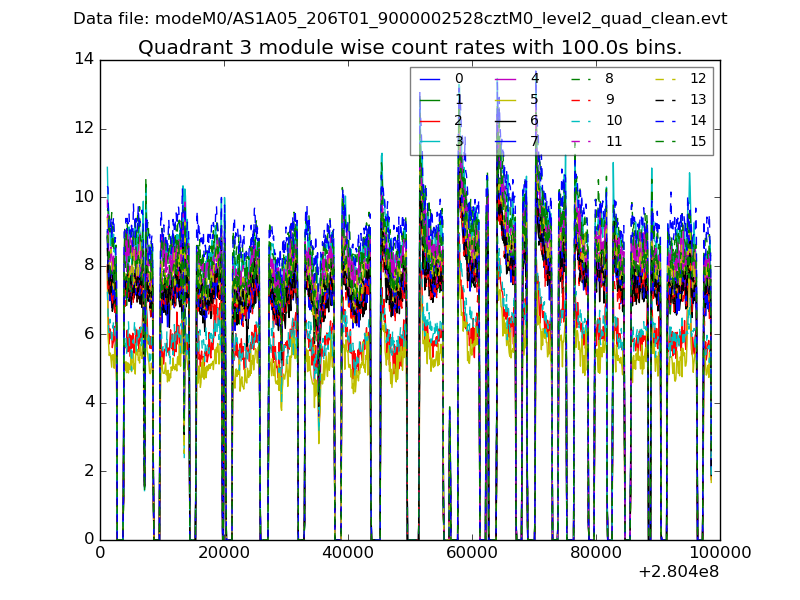
| Module-wise count rates for Quadrant C Data is divided into 100 sec bins |
 |
 |
| Module-wise count rates for Quadrant D Data is divided into 100 sec bins |
 |
 |
| Parameter | Plot |
|---|---|
| CZT HV Monitor | 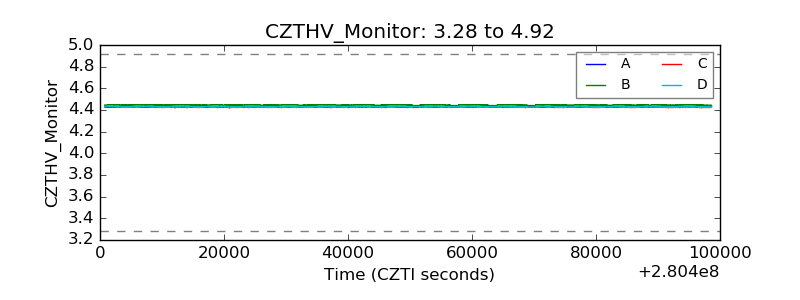 |
| D_VDD |  |
| Temperature 1 |  |
| Veto HV Monitor |  |
| Veto LLD | 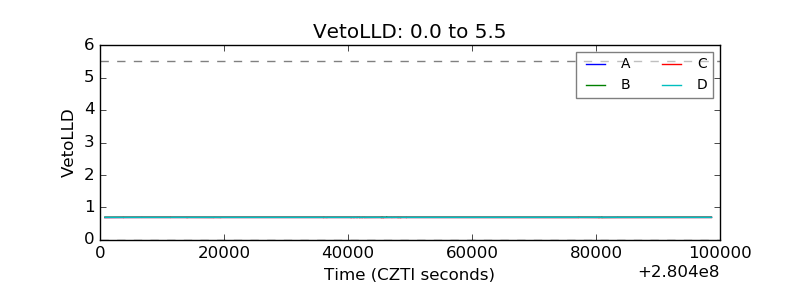 |
| Alpha Counter |  |
| _CPM_Rate | 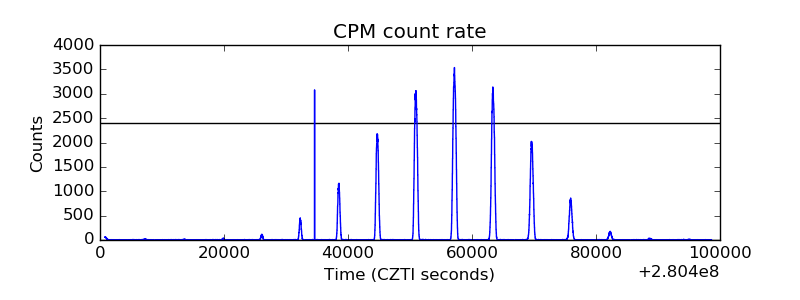 |
| CZT Counter |  |
| +2.5 Volts monitor |  |
| +5 Volts monitor |  |
| _ROLL_ROT |  |
| _Roll_DEC | 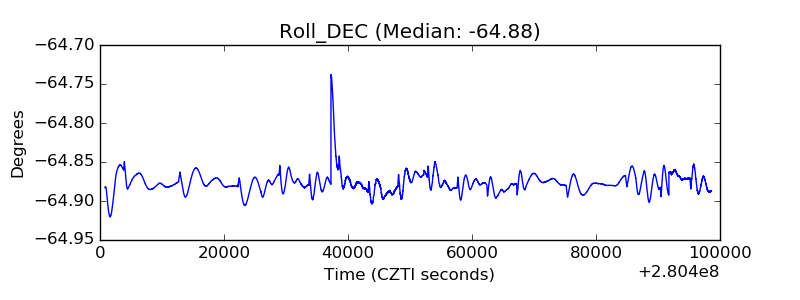 |
| _Roll_RA | 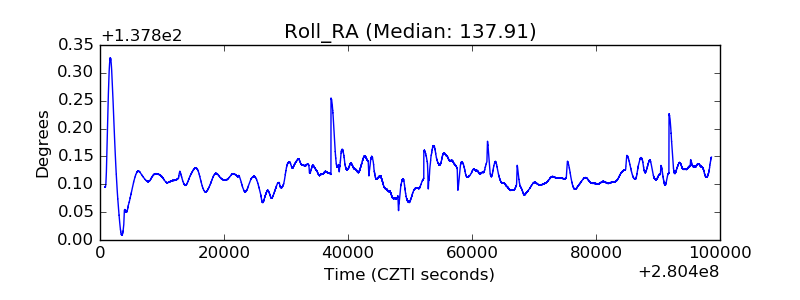 |
| Veto Counter |  |