| Param | Original file | Final file |
|---|---|---|
| Filename | modeM0/AS1A05_206T01_9000002528_17010cztM0_level2.evt | modeM0/AS1A05_206T01_9000002528_17010cztM0_level2_quad_clean.evt |
| Size (bytes) | 103,904,640 | 27,760,320 |
| Size | 99.1 MB | 26.5 MB |
| Events in quadrant A | 685,878 | 184,975 |
| Events in quadrant B | 869,622 | 186,365 |
| Events in quadrant C | 746,589 | 182,348 |
| Events in quadrant D | 742,862 | 178,467 |
| Mode M9 | |||
|---|---|---|---|
| Quadrant | BADHDUFLAG | Total packets | Discarded packets |
| A | 0 | 4 | 0 |
| B | 0 | 4 | 0 |
| C | 0 | 4 | 0 |
| D | 0 | 4 | 0 |
| Mode SS | |||
|---|---|---|---|
| Quadrant | BADHDUFLAG | Total packets | Discarded packets |
| A | 0 | 30 | 0 |
| B | 0 | 30 | 0 |
| C | 0 | 30 | 0 |
| D | 0 | 30 | 0 |
| Mode M0 | |||
|---|---|---|---|
| Quadrant | BADHDUFLAG | Total packets | Discarded packets |
| A | 0 | 3005 | 2 |
| B | 0 | 3552 | 1 |
| C | 0 | 3102 | 1 |
| D | 0 | 3173 | 1 |
| Quadrant | Total seconds | Saturated seconds | Saturation percentage |
|---|---|---|---|
| A | 1452 | 30 | 2.066116% |
| B | 1452 | 102 | 7.024793% |
| C | 1452 | 36 | 2.479339% |
| D | 1452 | 16 | 1.101928% |
Noise dominated data is calculated using 1-second bins in cleaned event files. If a bin has >2000 counts, and if more than 50% of those come from <1% of pixels, then it is considered to be noise-dominated and hence unusable.
| Quadrant | # 1 sec bins | Bins with >0 counts | Bins with >2000 counts | High rate bins dominated by noise | Noise dominated (total time) | Noise dominated (detector-on time) | Marked lightcurve |
|---|---|---|---|---|---|---|---|
| A | 1453 | 1453 | 0 | 0 | 0.00% | 0.00% | 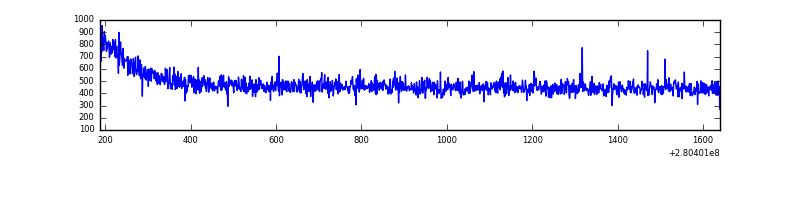 |
| B | 1453 | 1453 | 33 | 33 | 2.27% | 2.27% | 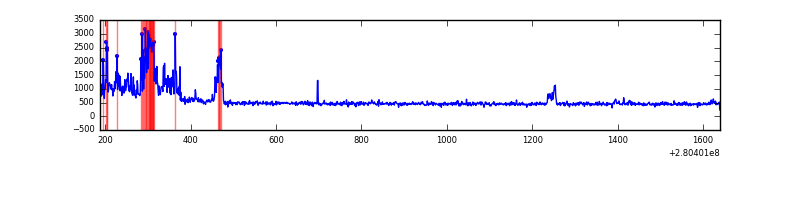 |
| C | 1453 | 1453 | 0 | 0 | 0.00% | 0.00% | 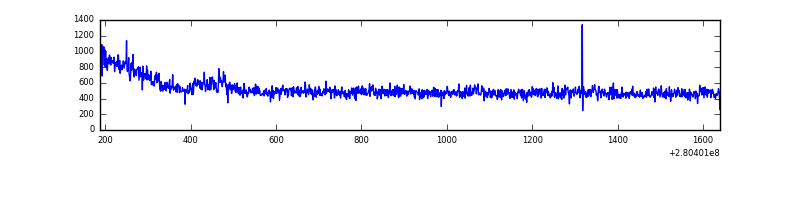 |
| D | 1453 | 1453 | 1 | 1 | 0.07% | 0.07% | 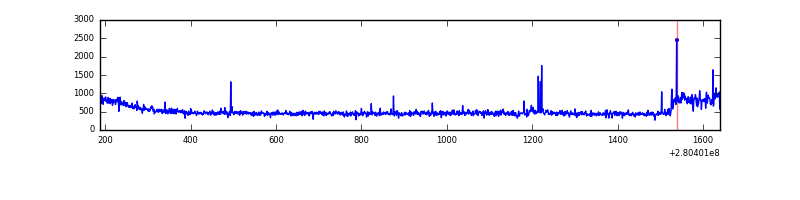 |
Top three noisy pixels from each quadrant. If the there are fewer than three noisy pixels in the level2.evt file, extra rows are filled as -1
| Pixel properties | Quadrant properties | ||||||
|---|---|---|---|---|---|---|---|
| Quadrant | DetID | PixID | Counts | Sigma | Mean | Median | Sigma |
| A | 0 | 226 | 1505 | 35.08 | 178 | 175 | 37.9 |
| A | 12 | 194 | 1340 | 30.73 | 178 | 175 | 37.9 |
| A | 3 | 137 | 1214 | 27.41 | 178 | 175 | 37.9 |
| B | 3 | 64 | 181794 | 5135.83 | 173 | 169 | 35.4 |
| B | 0 | 189 | 10053 | 279.49 | 173 | 169 | 35.4 |
| B | 12 | 111 | 3952 | 106.97 | 173 | 169 | 35.4 |
| C | 3 | 233 | 33439 | 782.11 | 175 | 175 | 42.5 |
| C | 14 | 238 | 26412 | 616.89 | 175 | 175 | 42.5 |
| C | 9 | 54 | 1446 | 29.88 | 175 | 175 | 42.5 |
| D | 1 | 52 | 64383 | 1433.48 | 178 | 172 | 44.8 |
| D | 2 | 234 | 5251 | 113.39 | 178 | 172 | 44.8 |
| D | 3 | 238 | 2399 | 49.72 | 178 | 172 | 44.8 |
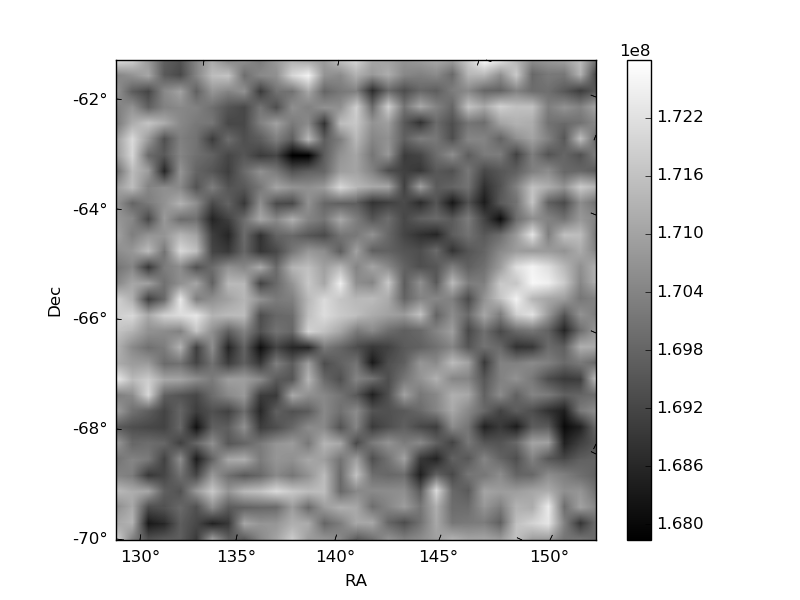
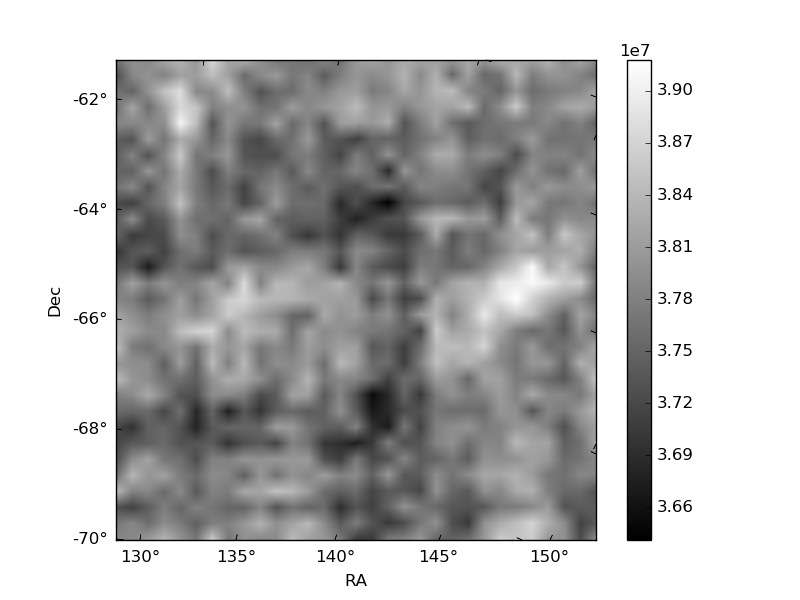
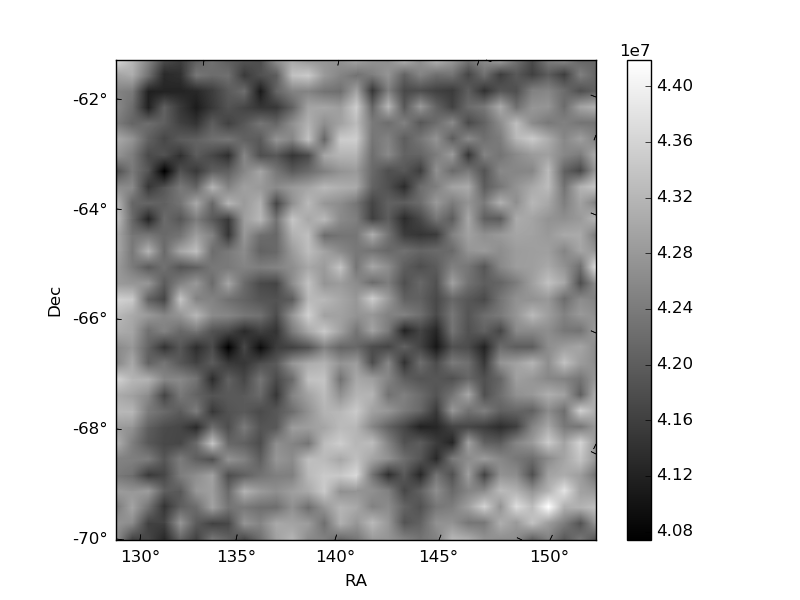
Histogram calculated using DETX and DETY for each event in the final _common_clean file
| Quadrant A | 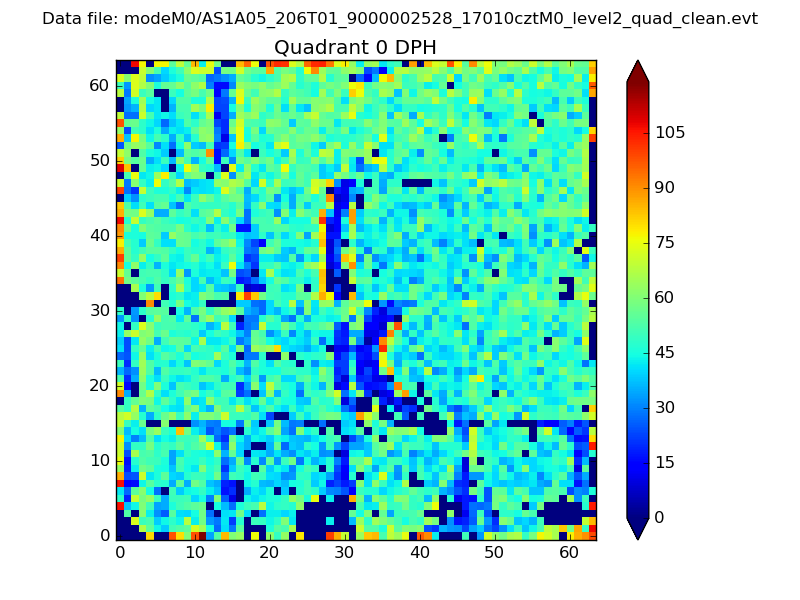 |
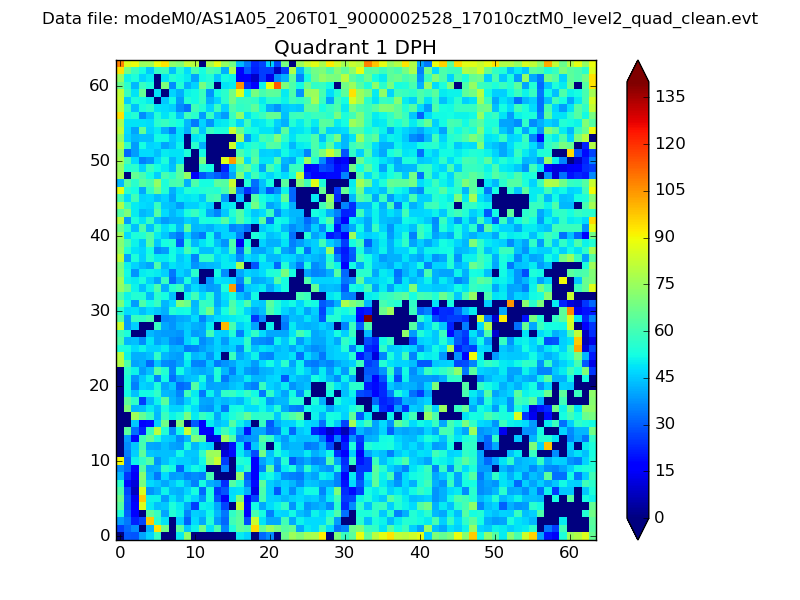 |
Quadrant B |
|---|---|---|---|
| Quadrant D | 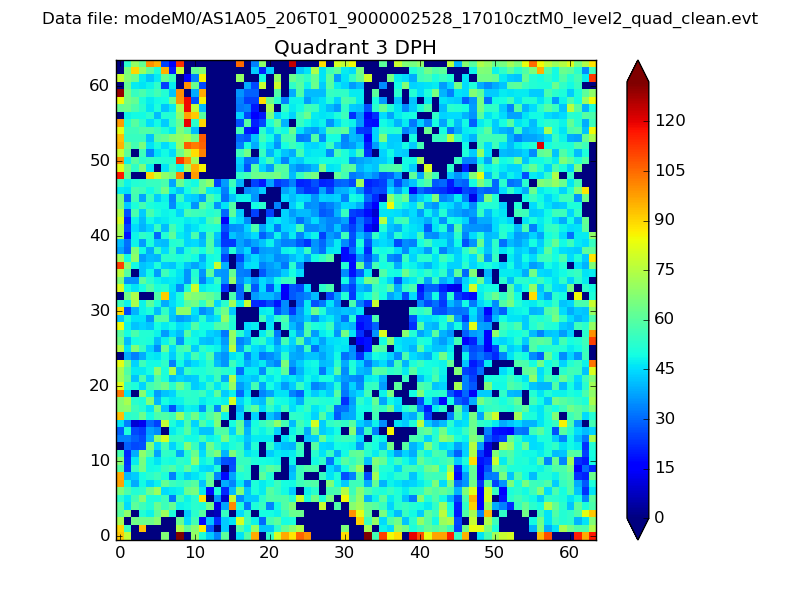 |
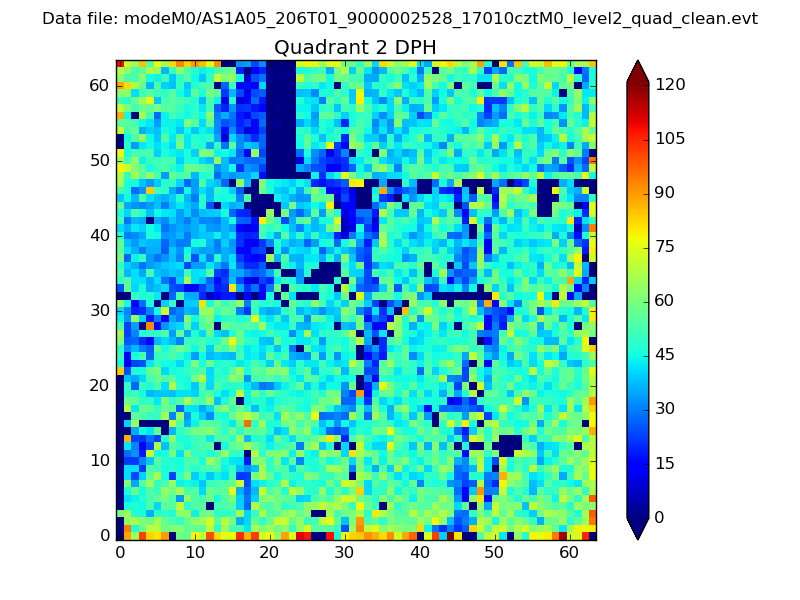 |
Quadrant C |
| Plot type | Count rate plots | Images |
|---|---|---|
| Comparison with Poisson distribution Blue bars denote a histogram of data divided into 1 sec bins. Red curve is a Poisson curve with rate = median count rate of data. |
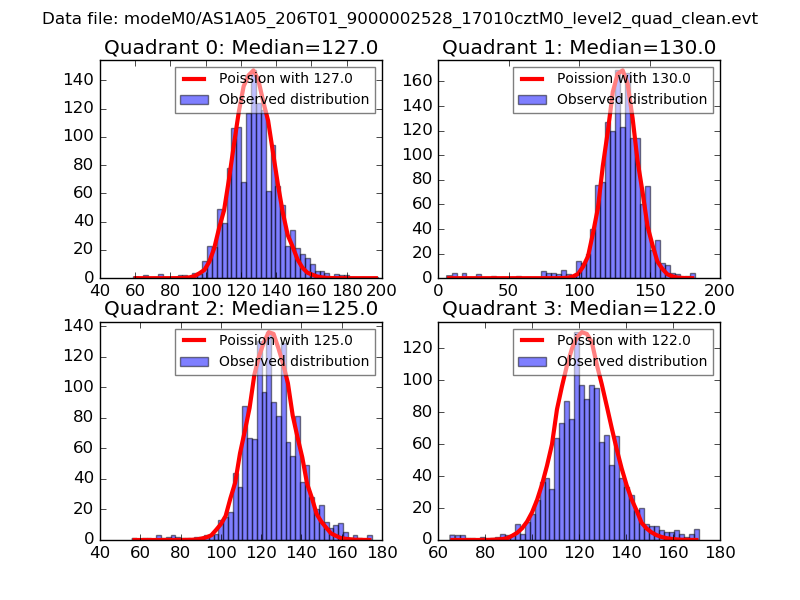 |
 |
| Quadrant-wise count rates Data is divided into 100 sec bins |
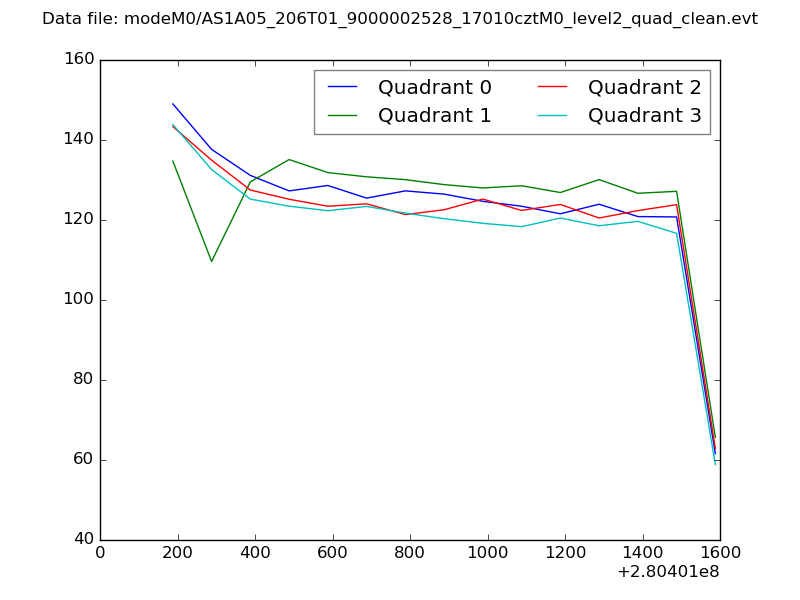 |
|
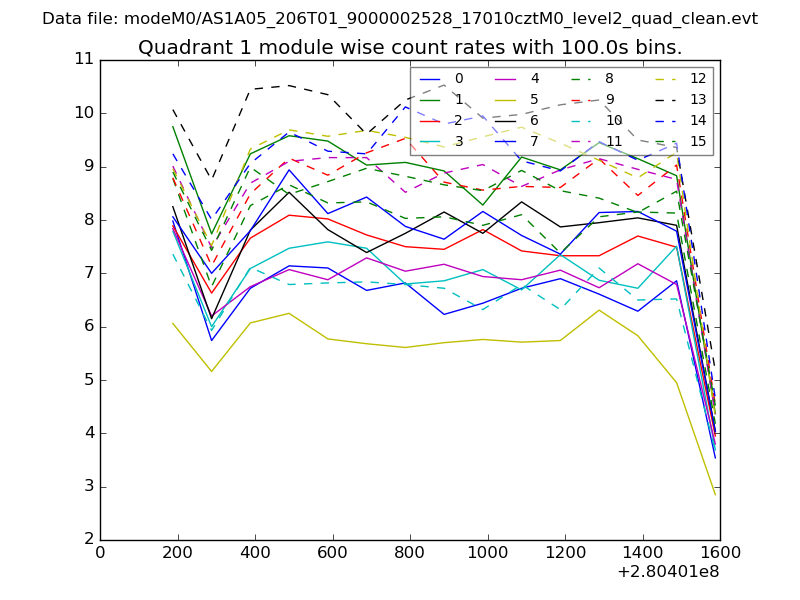
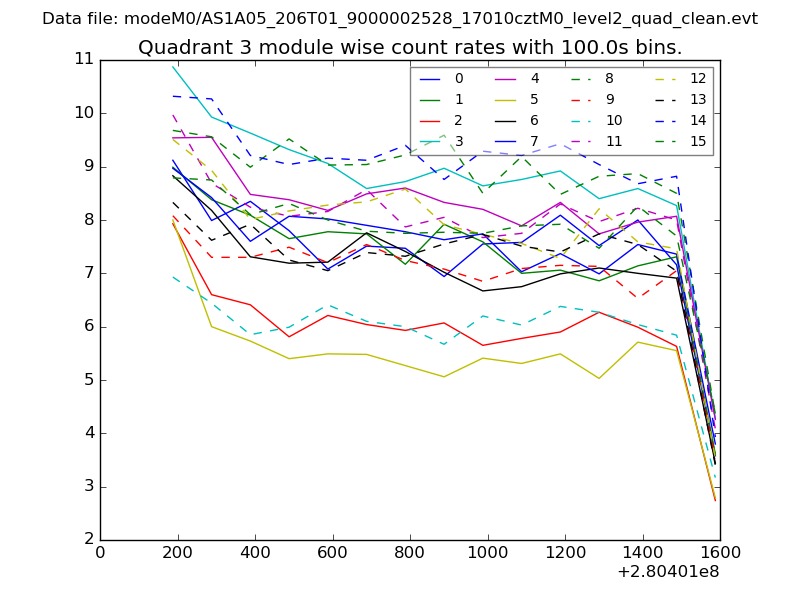
| Module-wise count rates for Quadrant A Data is divided into 100 sec bins |
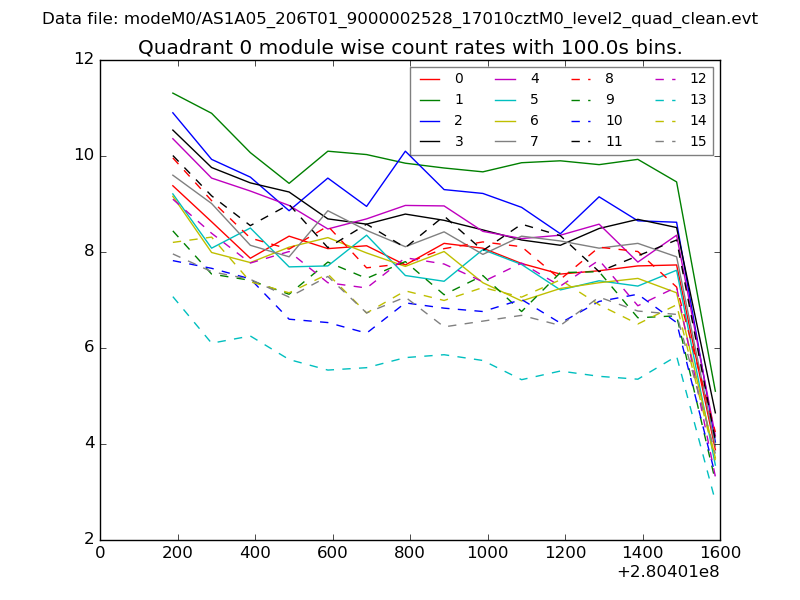 |
 |
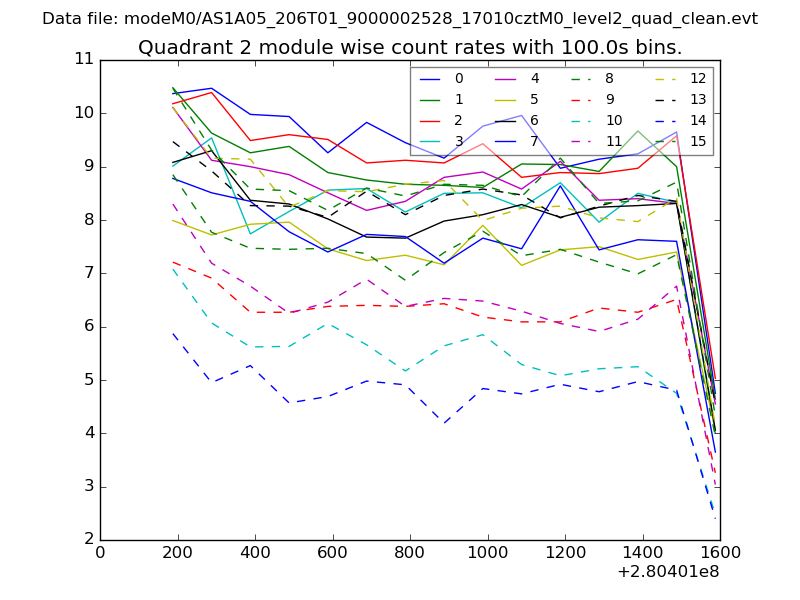
| Module-wise count rates for Quadrant B Data is divided into 100 sec bins |
 |
 |
| Module-wise count rates for Quadrant C Data is divided into 100 sec bins |
 |
 |
| Module-wise count rates for Quadrant D Data is divided into 100 sec bins |
 |
 |
| Parameter | Plot |
|---|---|
| CZT HV Monitor | 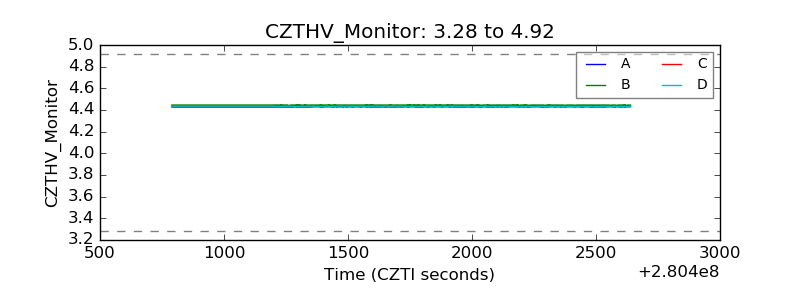 |
| D_VDD | 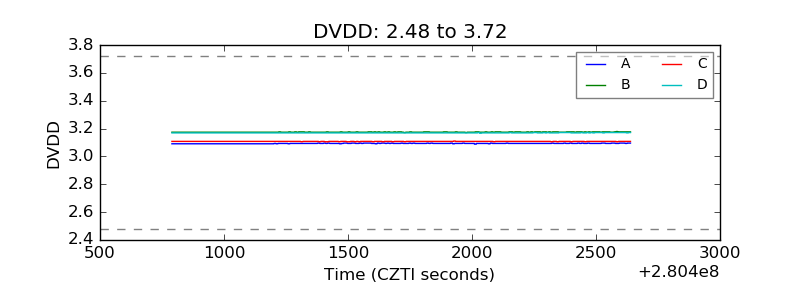 |
| Temperature 1 | 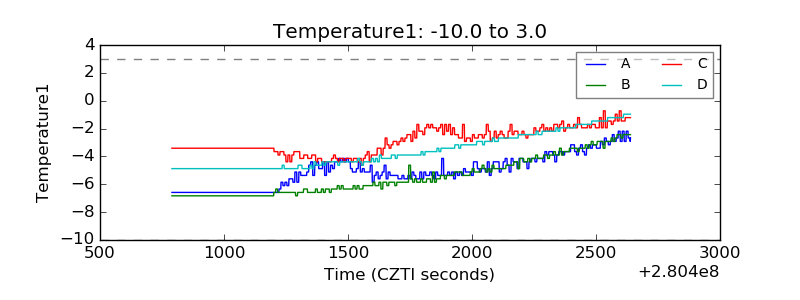 |
| Veto HV Monitor |  |
| Veto LLD | 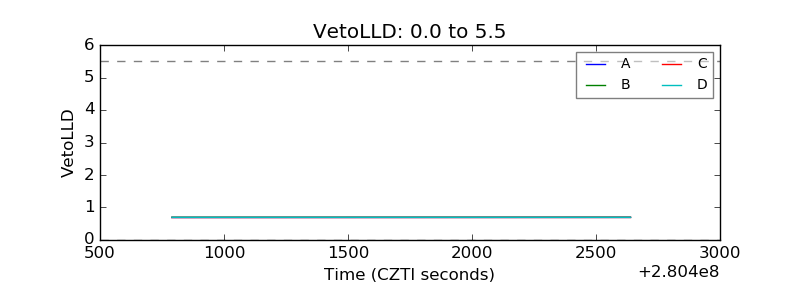 |
| Alpha Counter |  |
| _CPM_Rate |  |
| CZT Counter | 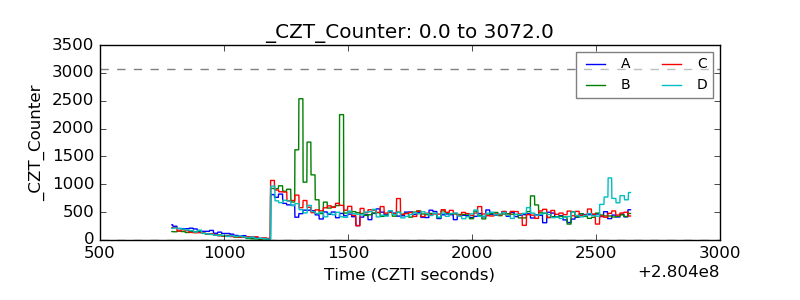 |
| +2.5 Volts monitor |  |
| +5 Volts monitor |  |
| _ROLL_ROT | 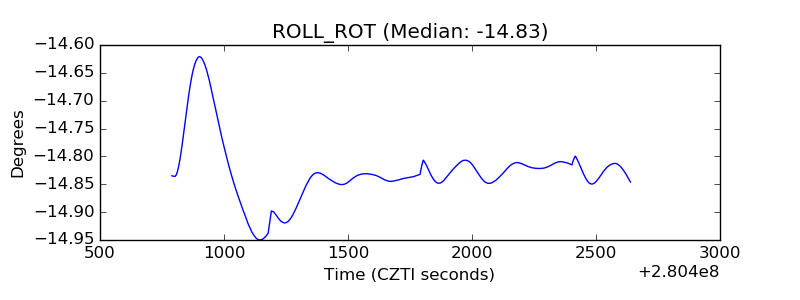 |
| _Roll_DEC | 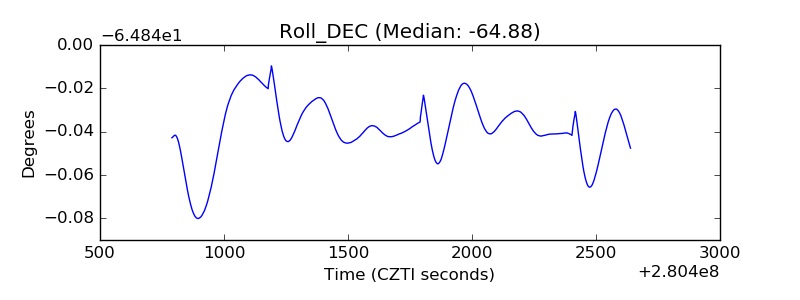 |
| _Roll_RA | 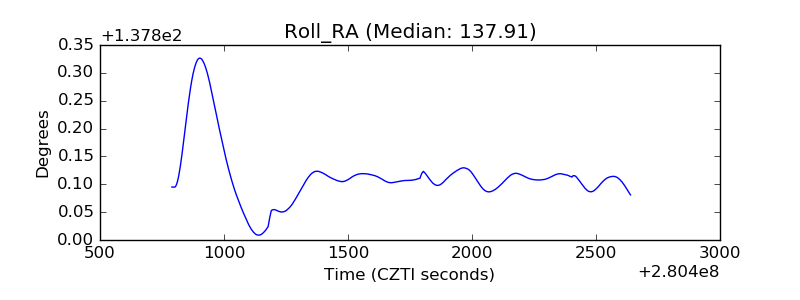 |
| Veto Counter | 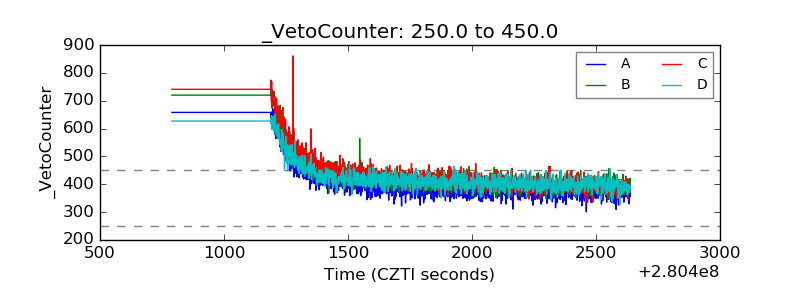 |