| Param | Original file | Final file |
|---|---|---|
| Filename | modeM0/AS1A05_206T01_9000002528_17011cztM0_level2.evt | modeM0/AS1A05_206T01_9000002528_17011cztM0_level2_quad_clean.evt |
| Size (bytes) | 548,490,240 | 117,224,640 |
| Size | 523.1 MB | 111.8 MB |
| Events in quadrant A | 3,611,816 | 758,248 |
| Events in quadrant B | 4,146,742 | 769,798 |
| Events in quadrant C | 3,951,327 | 746,484 |
| Events in quadrant D | 4,369,517 | 731,181 |
| Mode M9 | |||
|---|---|---|---|
| Quadrant | BADHDUFLAG | Total packets | Discarded packets |
| A | 0 | 2 | 0 |
| B | 0 | 2 | 0 |
| C | 0 | 2 | 0 |
| D | 0 | 2 | 0 |
| Mode SS | |||
|---|---|---|---|
| Quadrant | BADHDUFLAG | Total packets | Discarded packets |
| A | 0 | 160 | 0 |
| B | 0 | 160 | 0 |
| C | 0 | 160 | 0 |
| D | 0 | 160 | 0 |
| Mode M0 | |||
|---|---|---|---|
| Quadrant | BADHDUFLAG | Total packets | Discarded packets |
| A | 0 | 16157 | 1 |
| B | 0 | 17318 | 2 |
| C | 0 | 16652 | 1 |
| D | 0 | 18326 | 1 |
| Quadrant | Total seconds | Saturated seconds | Saturation percentage |
|---|---|---|---|
| A | 7829 | 258 | 3.295440% |
| B | 7828 | 342 | 4.368932% |
| C | 7828 | 291 | 3.717425% |
| D | 7828 | 304 | 3.883495% |
Noise dominated data is calculated using 1-second bins in cleaned event files. If a bin has >2000 counts, and if more than 50% of those come from <1% of pixels, then it is considered to be noise-dominated and hence unusable.
| Quadrant | # 1 sec bins | Bins with >0 counts | Bins with >2000 counts | High rate bins dominated by noise | Noise dominated (total time) | Noise dominated (detector-on time) | Marked lightcurve |
|---|---|---|---|---|---|---|---|
| A | 7980 | 7832 | 0 | 0 | 0.00% | 0.00% | 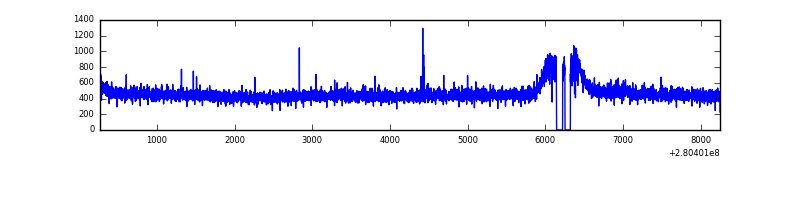 |
| B | 7979 | 7831 | 42 | 42 | 0.53% | 0.54% | 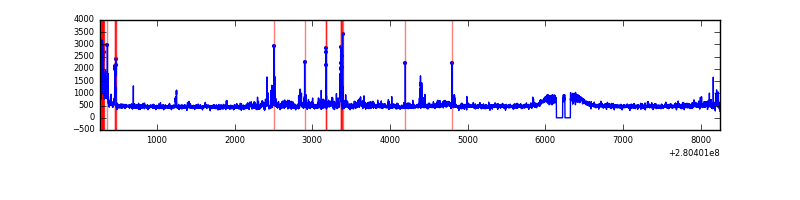 |
| C | 7979 | 7831 | 0 | 0 | 0.00% | 0.00% | 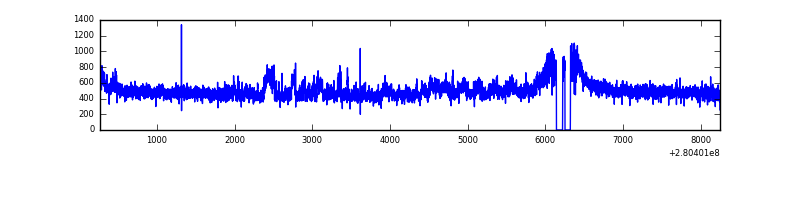 |
| D | 7979 | 7831 | 41 | 41 | 0.51% | 0.52% | 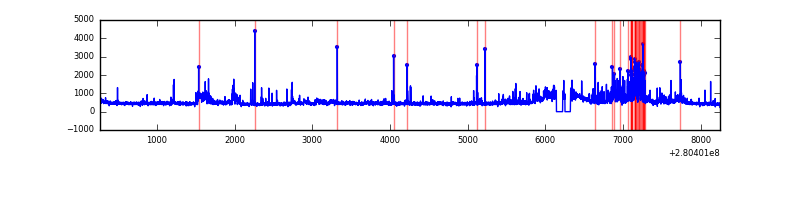 |
Top three noisy pixels from each quadrant. If the there are fewer than three noisy pixels in the level2.evt file, extra rows are filled as -1
| Pixel properties | Quadrant properties | ||||||
|---|---|---|---|---|---|---|---|
| Quadrant | DetID | PixID | Counts | Sigma | Mean | Median | Sigma |
| A | 12 | 189 | 15242 | 76.27 | 934 | 909 | 187.9 |
| A | 15 | 174 | 8677 | 41.33 | 934 | 909 | 187.9 |
| A | 0 | 226 | 8141 | 38.48 | 934 | 909 | 187.9 |
| B | 3 | 64 | 149902 | 838.71 | 929 | 904 | 177.7 |
| B | 0 | 219 | 72499 | 403.01 | 929 | 904 | 177.7 |
| B | 0 | 189 | 58716 | 325.42 | 929 | 904 | 177.7 |
| C | 3 | 233 | 275597 | 1302.72 | 905 | 909 | 210.9 |
| C | 14 | 238 | 139149 | 655.61 | 905 | 909 | 210.9 |
| C | 13 | 61 | 6438 | 26.22 | 905 | 909 | 210.9 |
| D | 1 | 52 | 812941 | 3641.31 | 918 | 888 | 223.0 |
| D | 2 | 234 | 35563 | 155.48 | 918 | 888 | 223.0 |
| D | 10 | 70 | 24979 | 108.02 | 918 | 888 | 223.0 |
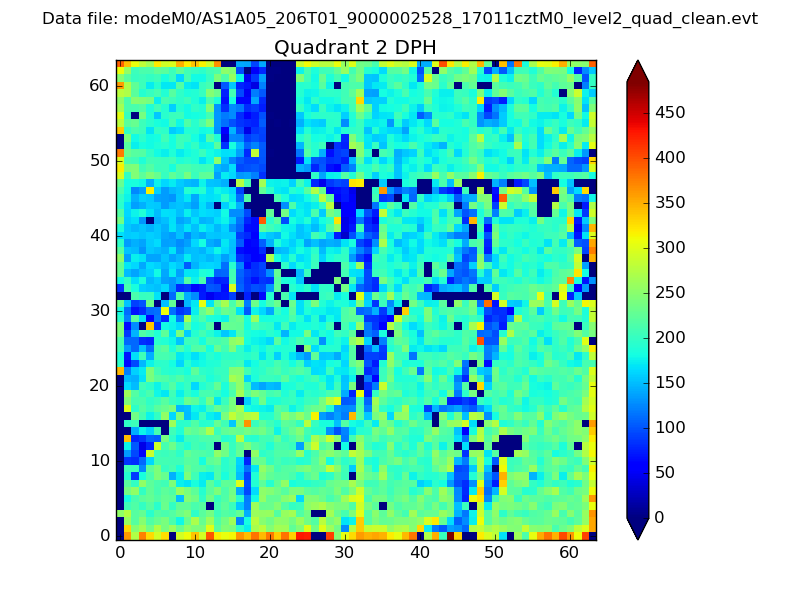
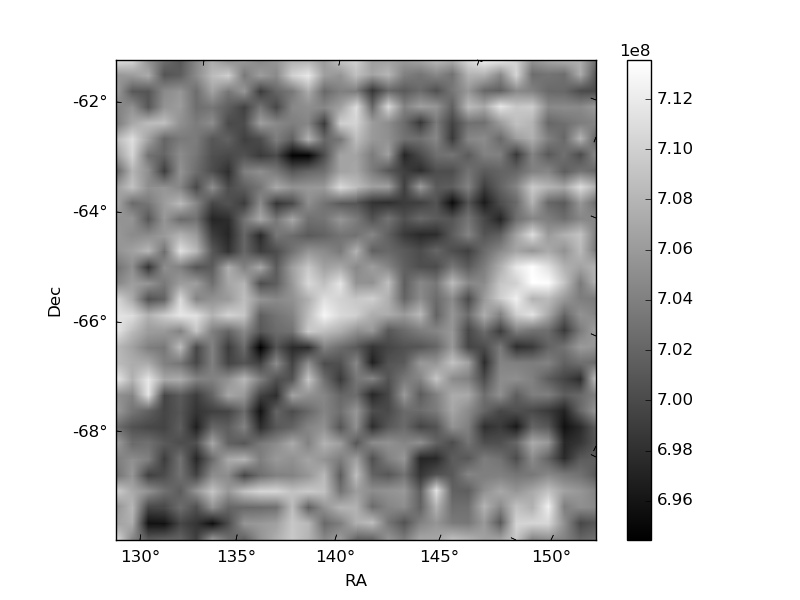
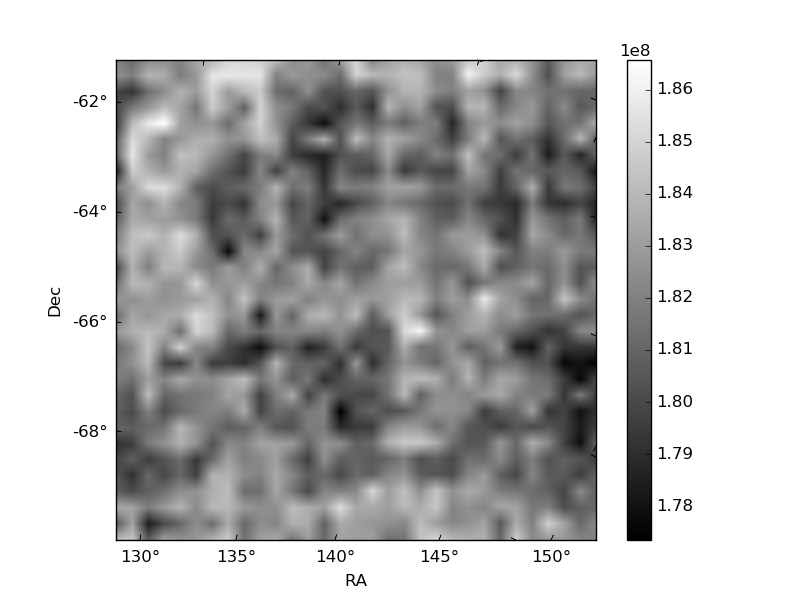
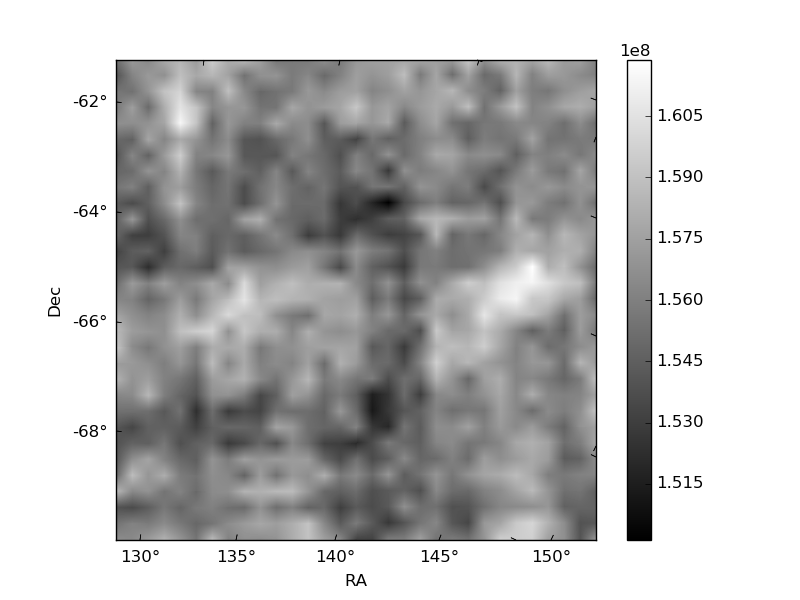
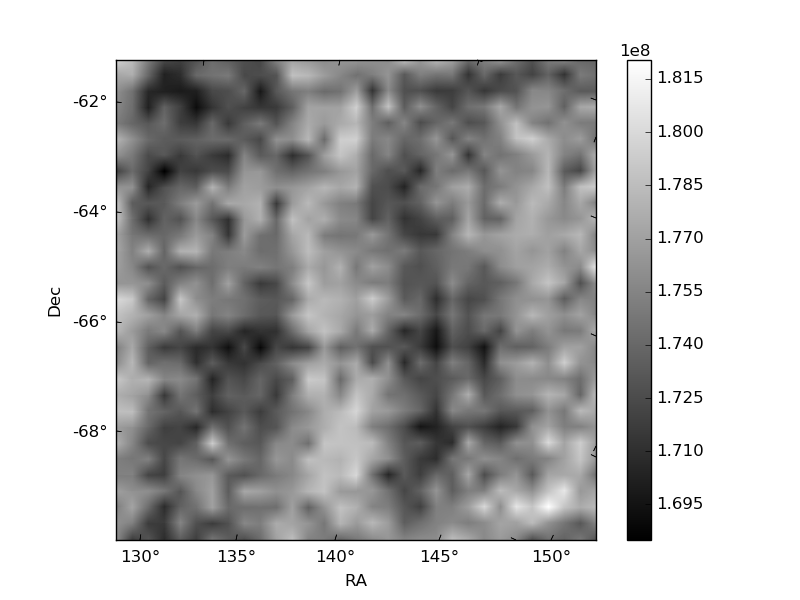
Histogram calculated using DETX and DETY for each event in the final _common_clean file
| Quadrant A | 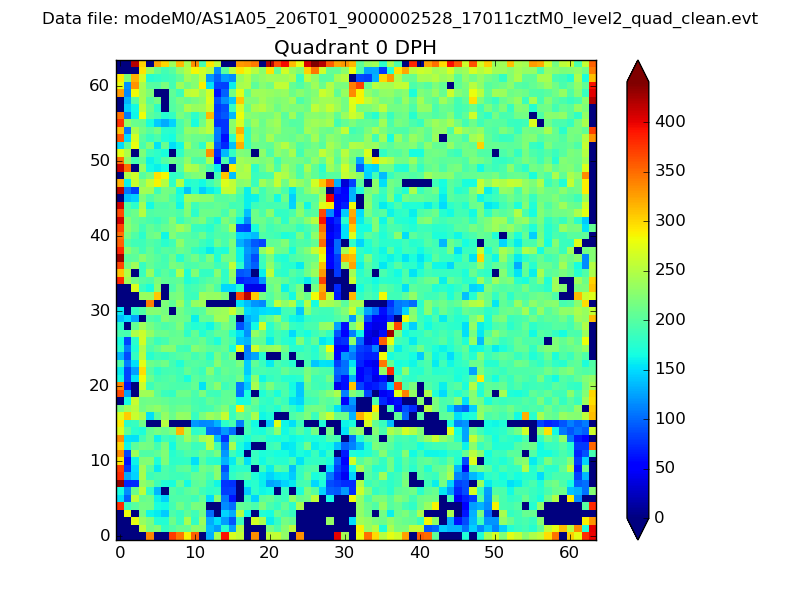 |
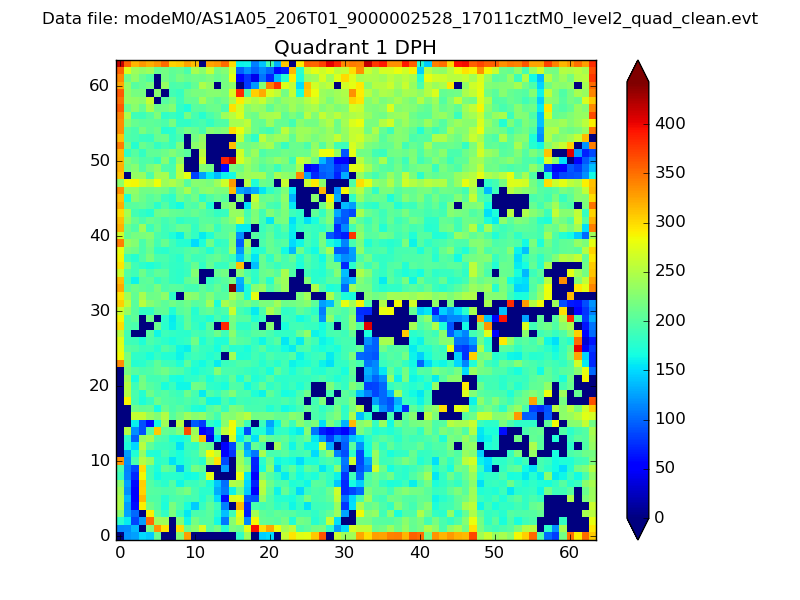 |
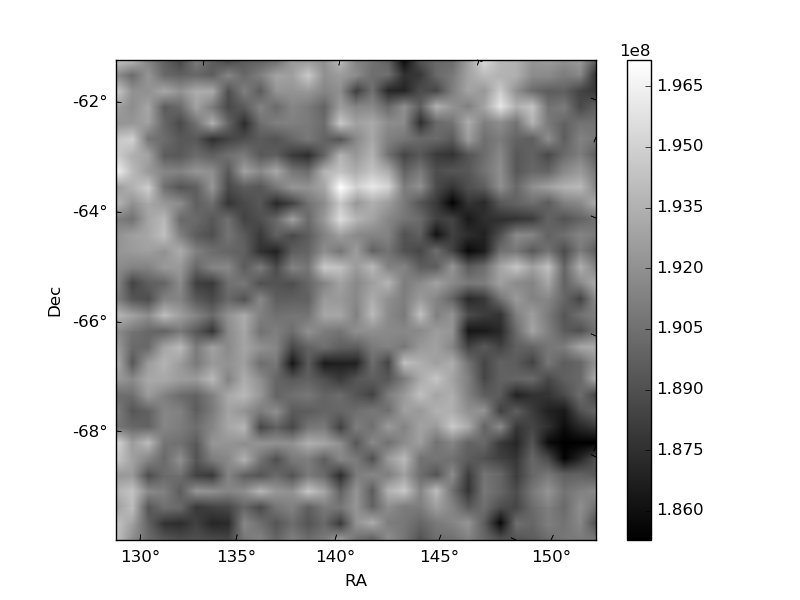
Quadrant B |
|---|---|---|---|
| Quadrant D | 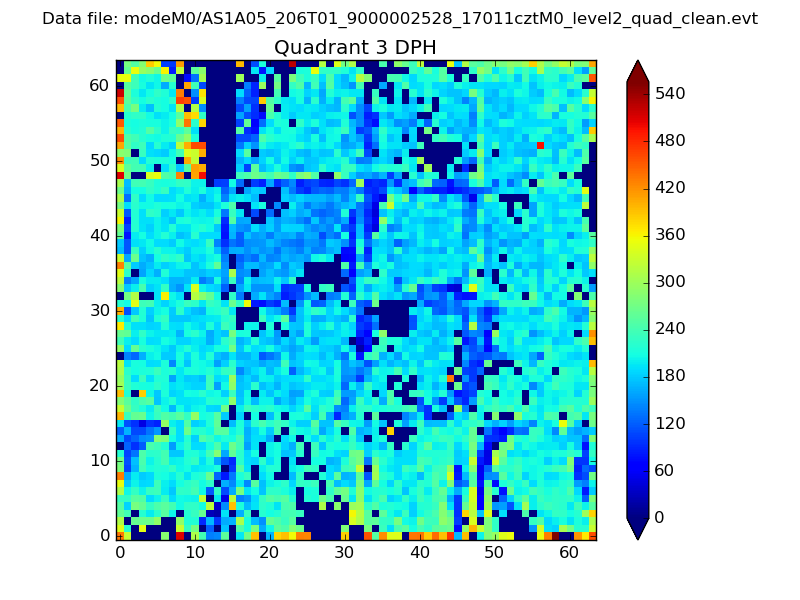 |
 |
Quadrant C |
| Plot type | Count rate plots | Images |
|---|---|---|
| Comparison with Poisson distribution Blue bars denote a histogram of data divided into 1 sec bins. Red curve is a Poisson curve with rate = median count rate of data. |
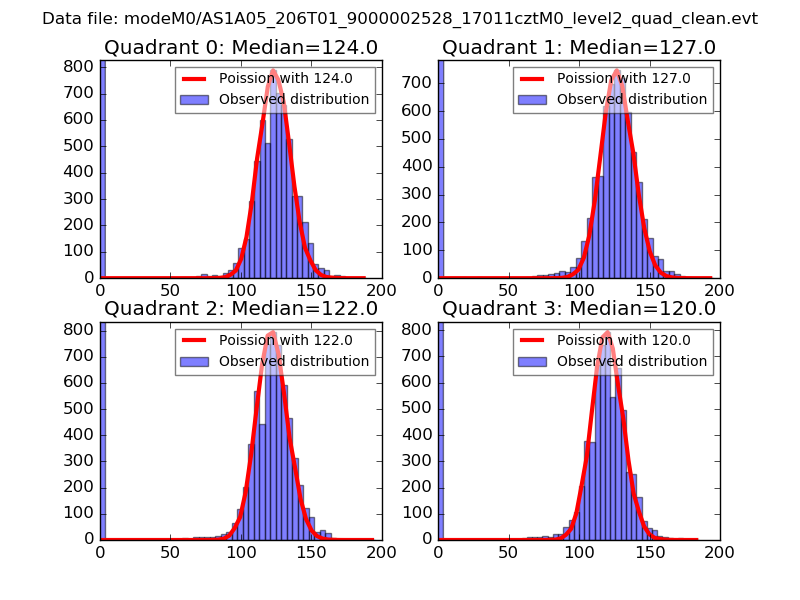 |
 |
| Quadrant-wise count rates Data is divided into 100 sec bins |
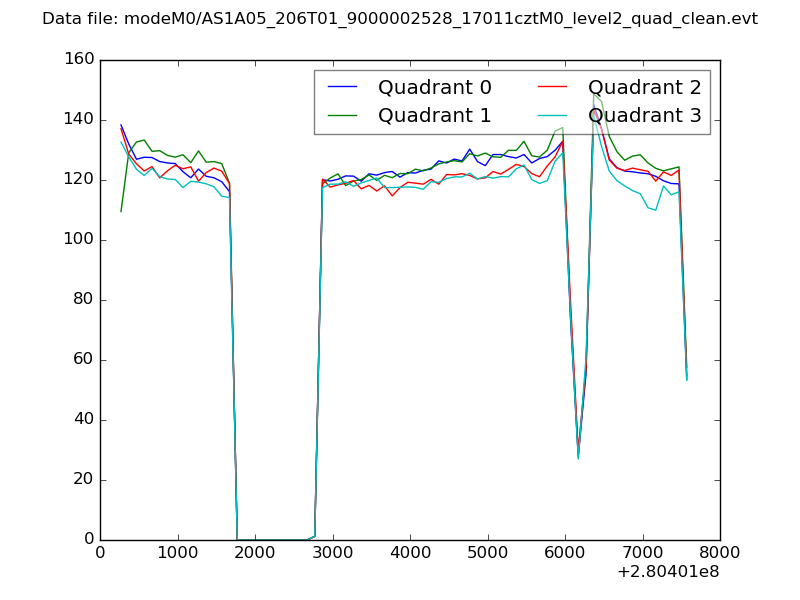 |
|
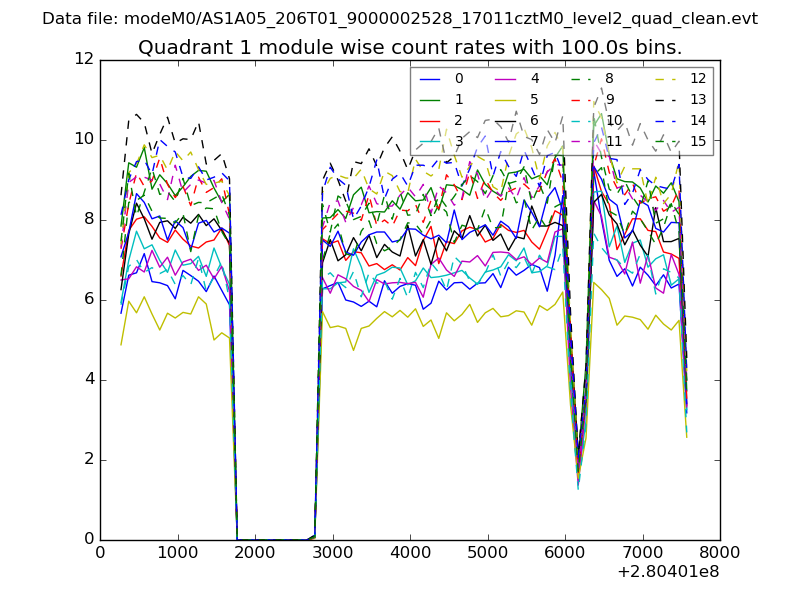
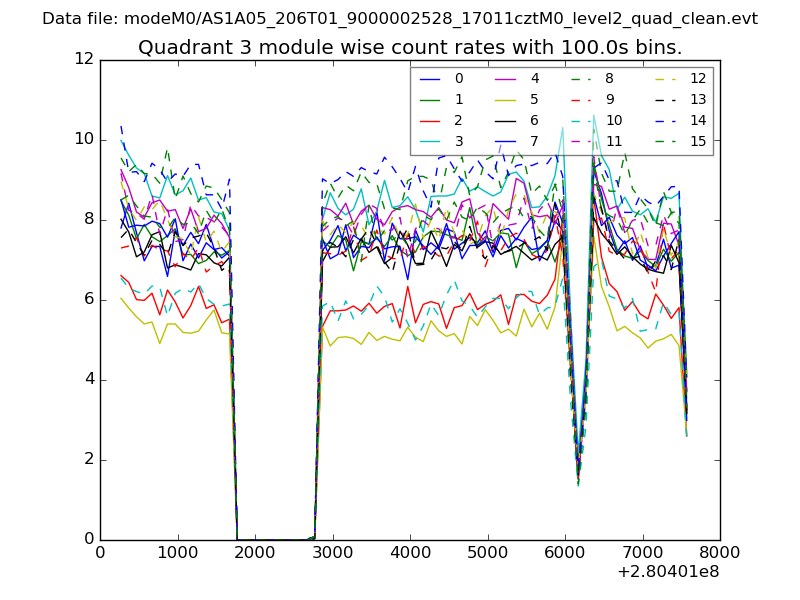
| Module-wise count rates for Quadrant A Data is divided into 100 sec bins |
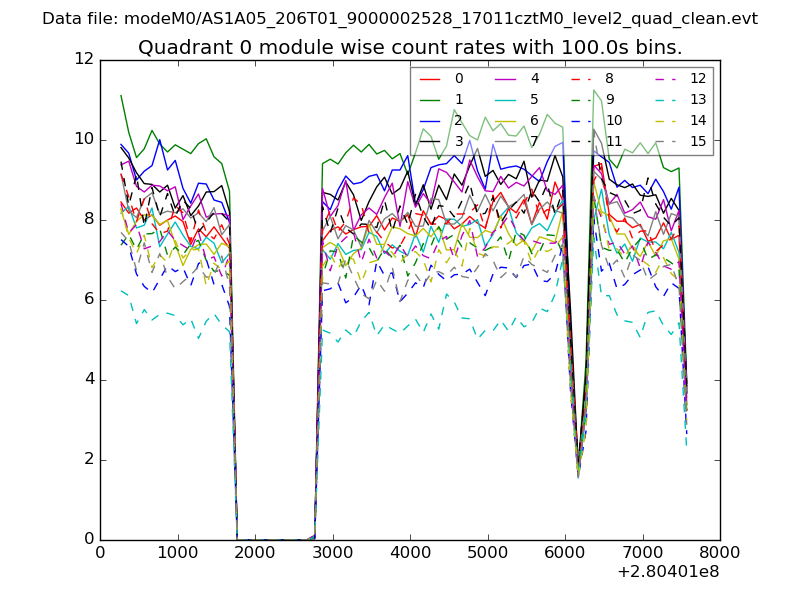 |
 |
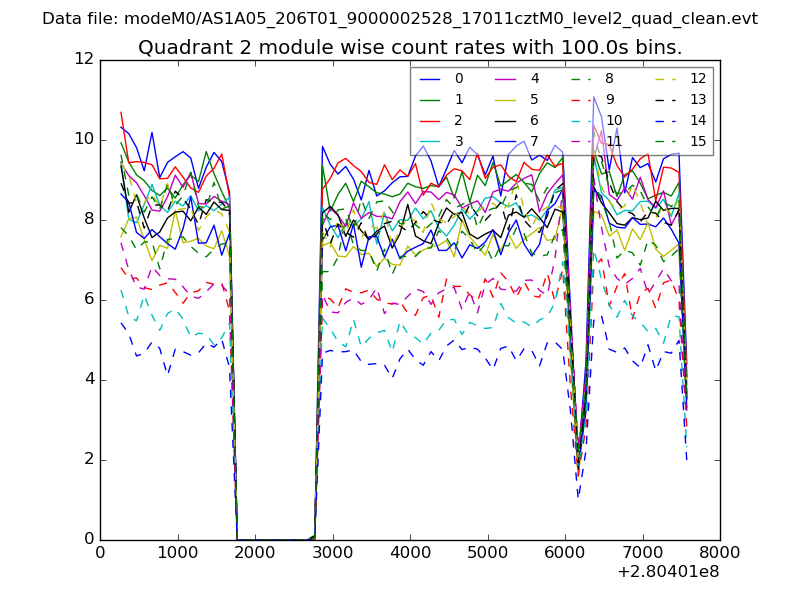
| Module-wise count rates for Quadrant B Data is divided into 100 sec bins |
 |
 |
| Module-wise count rates for Quadrant C Data is divided into 100 sec bins |
 |
 |
| Module-wise count rates for Quadrant D Data is divided into 100 sec bins |
 |
 |
| Parameter | Plot |
|---|---|
| CZT HV Monitor | 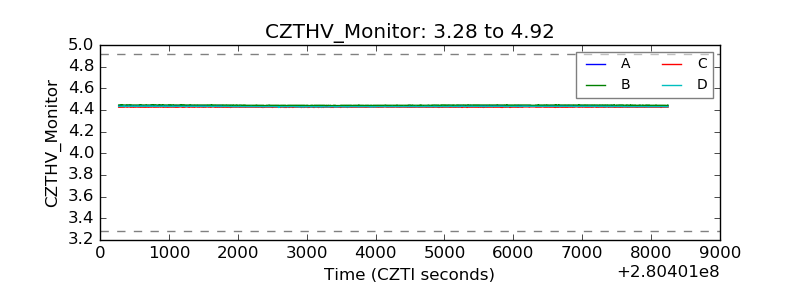 |
| D_VDD | 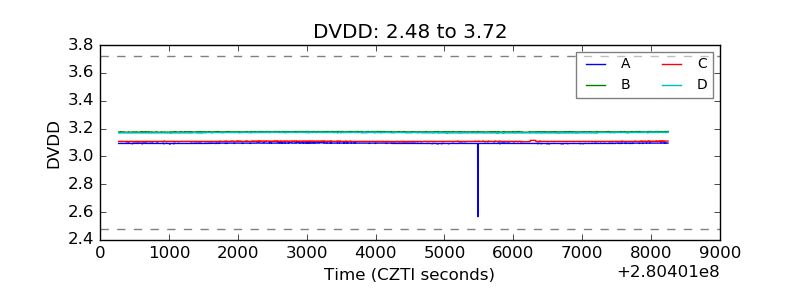 |
| Temperature 1 | 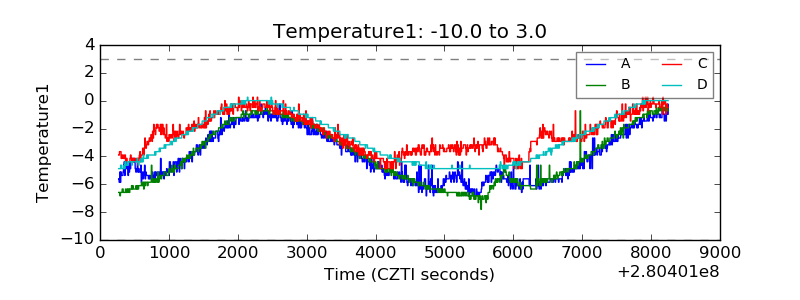 |
| Veto HV Monitor | 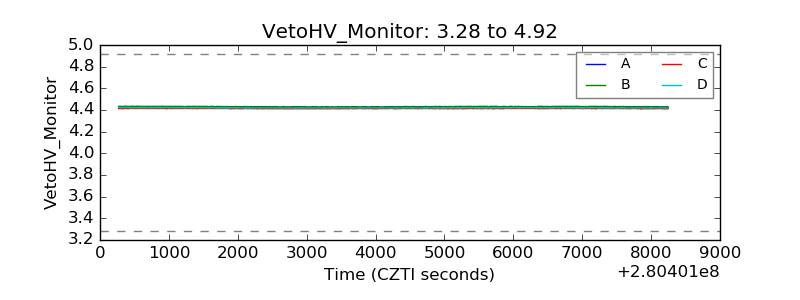 |
| Veto LLD | 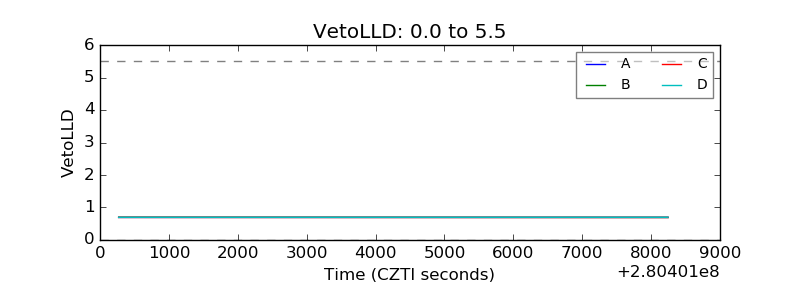 |
| Alpha Counter | 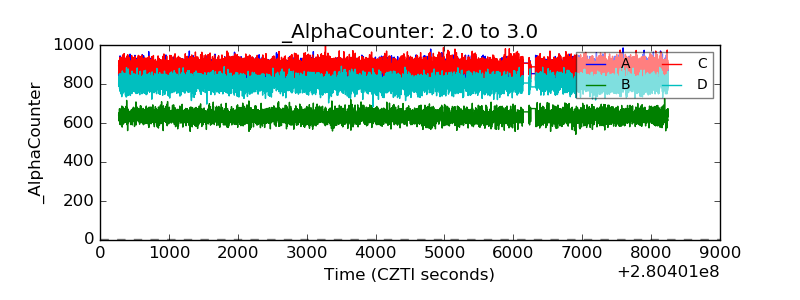 |
| _CPM_Rate | 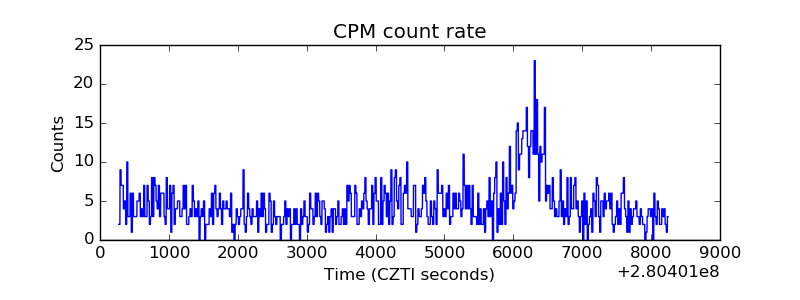 |
| CZT Counter | 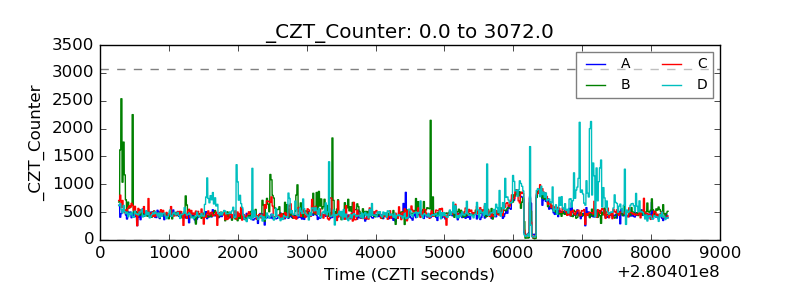 |
| +2.5 Volts monitor |  |
| +5 Volts monitor |  |
| _ROLL_ROT | 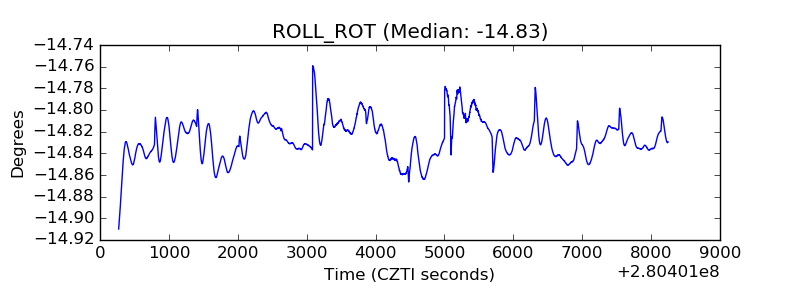 |
| _Roll_DEC | 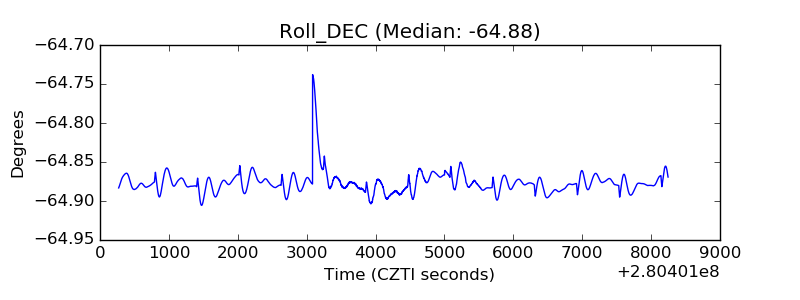 |
| _Roll_RA | 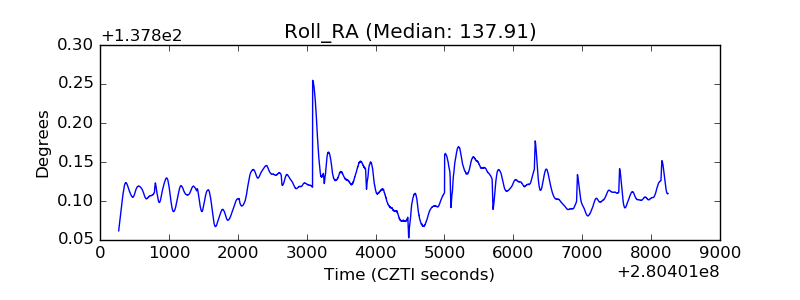 |
| Veto Counter | 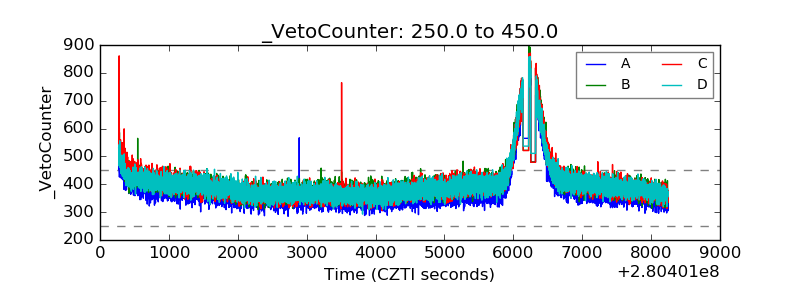 |