| Param | Original file | Final file |
|---|---|---|
| Filename | modeM0/AS1A05_206T01_9000002528_17012cztM0_level2.evt | modeM0/AS1A05_206T01_9000002528_17012cztM0_level2_quad_clean.evt |
| Size (bytes) | 514,506,240 | 100,028,160 |
| Size | 490.7 MB | 95.4 MB |
| Events in quadrant A | 3,387,970 | 636,106 |
| Events in quadrant B | 4,138,198 | 640,162 |
| Events in quadrant C | 3,562,295 | 625,828 |
| Events in quadrant D | 3,996,092 | 617,341 |
| Mode M9 | |||
|---|---|---|---|
| Quadrant | BADHDUFLAG | Total packets | Discarded packets |
| A | 0 | 1 | 0 |
| B | 0 | 1 | 0 |
| C | 0 | 1 | 0 |
| D | 0 | 1 | 0 |
| Mode SS | |||
|---|---|---|---|
| Quadrant | BADHDUFLAG | Total packets | Discarded packets |
| A | 0 | 148 | 0 |
| B | 0 | 148 | 0 |
| C | 0 | 148 | 0 |
| D | 0 | 148 | 0 |
| Mode M0 | |||
|---|---|---|---|
| Quadrant | BADHDUFLAG | Total packets | Discarded packets |
| A | 0 | 15155 | 1 |
| B | 0 | 16950 | 1 |
| C | 0 | 15182 | 1 |
| D | 0 | 16695 | 1 |
| Quadrant | Total seconds | Saturated seconds | Saturation percentage |
|---|---|---|---|
| A | 7322 | 187 | 2.553947% |
| B | 7322 | 313 | 4.274788% |
| C | 7322 | 198 | 2.704179% |
| D | 7322 | 192 | 2.622234% |
Noise dominated data is calculated using 1-second bins in cleaned event files. If a bin has >2000 counts, and if more than 50% of those come from <1% of pixels, then it is considered to be noise-dominated and hence unusable.
| Quadrant | # 1 sec bins | Bins with >0 counts | Bins with >2000 counts | High rate bins dominated by noise | Noise dominated (total time) | Noise dominated (detector-on time) | Marked lightcurve |
|---|---|---|---|---|---|---|---|
| A | 7413 | 7324 | 0 | 0 | 0.00% | 0.00% | 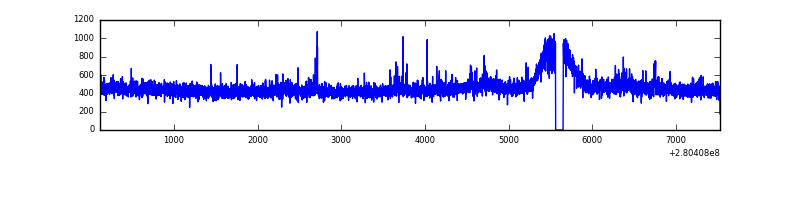 |
| B | 7413 | 7324 | 69 | 69 | 0.93% | 0.94% | 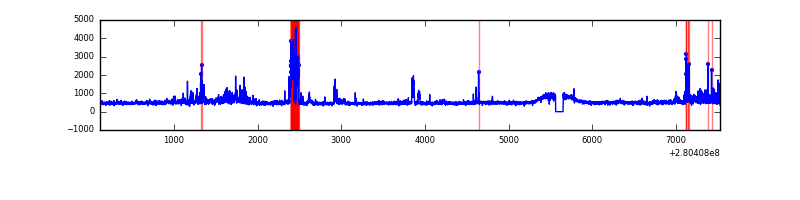 |
| C | 7413 | 7324 | 1 | 1 | 0.01% | 0.01% |  |
| D | 7413 | 7324 | 41 | 41 | 0.55% | 0.56% | 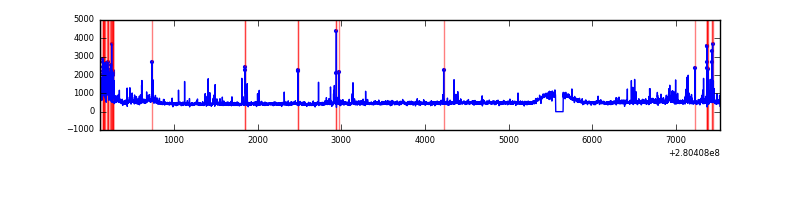 |
Top three noisy pixels from each quadrant. If the there are fewer than three noisy pixels in the level2.evt file, extra rows are filled as -1
| Pixel properties | Quadrant properties | ||||||
|---|---|---|---|---|---|---|---|
| Quadrant | DetID | PixID | Counts | Sigma | Mean | Median | Sigma |
| A | 15 | 174 | 29814 | 163.91 | 867 | 844 | 176.7 |
| A | 12 | 189 | 22949 | 125.07 | 867 | 844 | 176.7 |
| A | 0 | 226 | 7754 | 39.1 | 867 | 844 | 176.7 |
| B | 3 | 64 | 271509 | 1622.39 | 863 | 839 | 166.8 |
| B | 7 | 220 | 161159 | 960.95 | 863 | 839 | 166.8 |
| B | 15 | 33 | 70828 | 419.51 | 863 | 839 | 166.8 |
| C | 3 | 233 | 145184 | 732.5 | 837 | 839 | 197.1 |
| C | 14 | 238 | 128105 | 645.83 | 837 | 839 | 197.1 |
| C | 0 | 207 | 9005 | 41.44 | 837 | 839 | 197.1 |
| D | 1 | 52 | 583716 | 2776.09 | 854 | 826 | 210.0 |
| D | 5 | 222 | 85128 | 401.5 | 854 | 826 | 210.0 |
| D | 10 | 70 | 37703 | 175.63 | 854 | 826 | 210.0 |
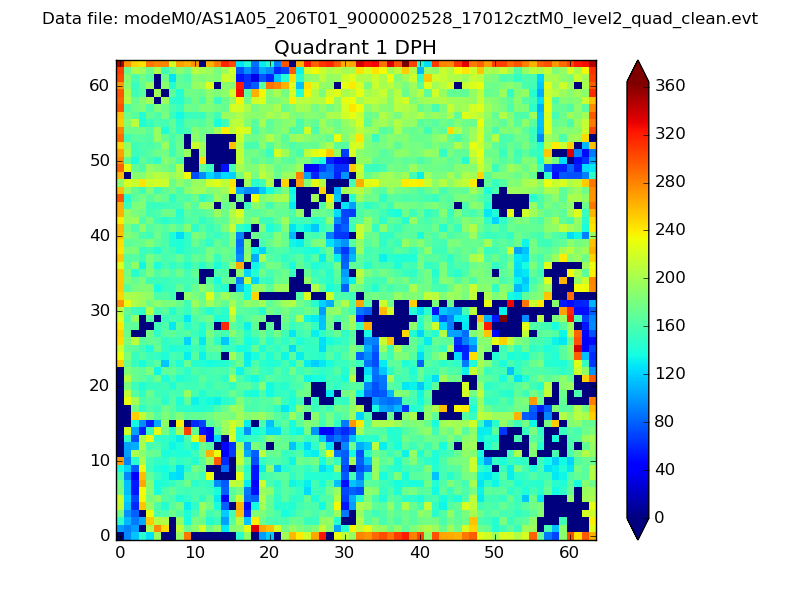
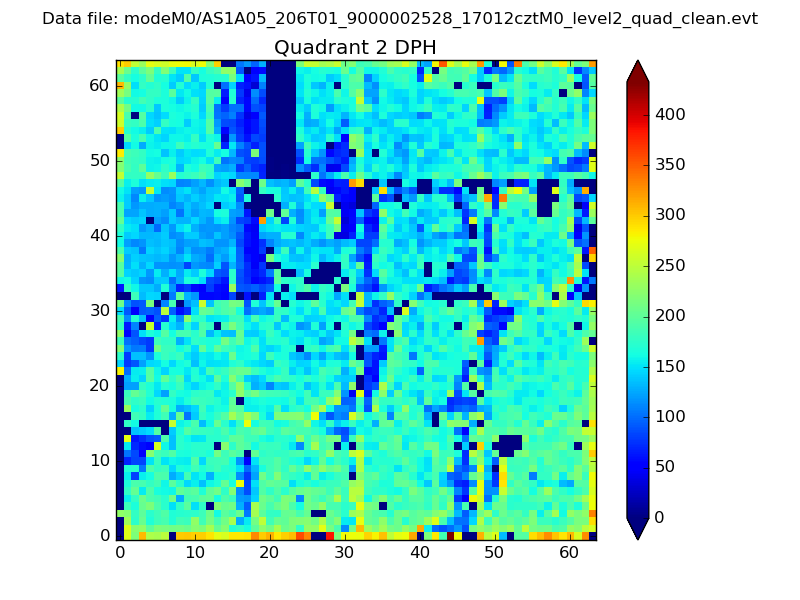
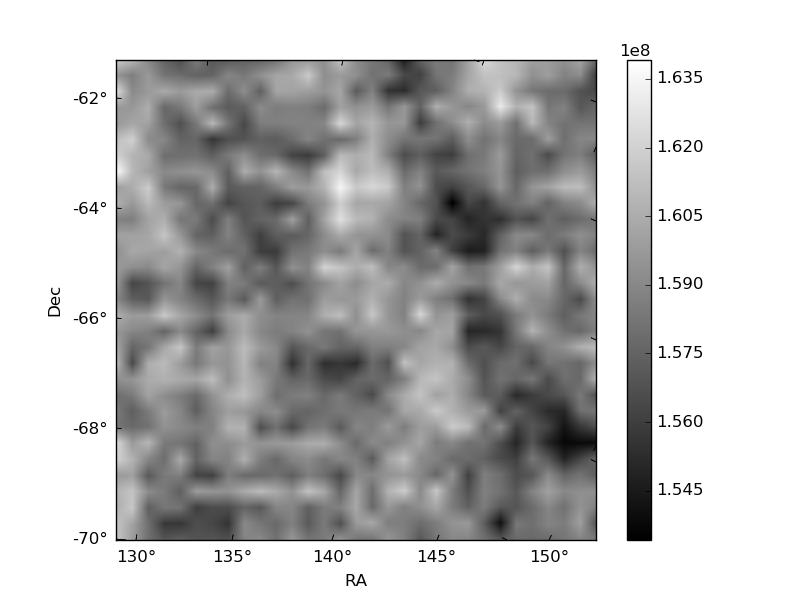
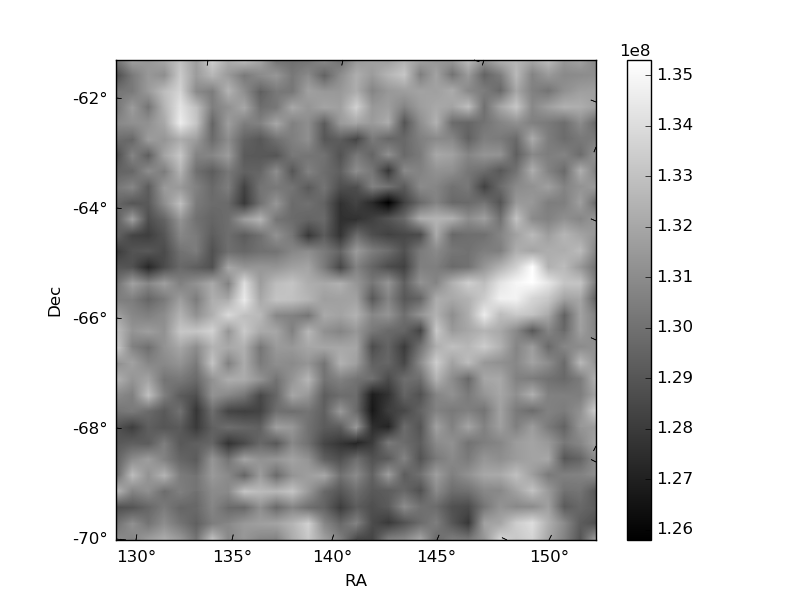
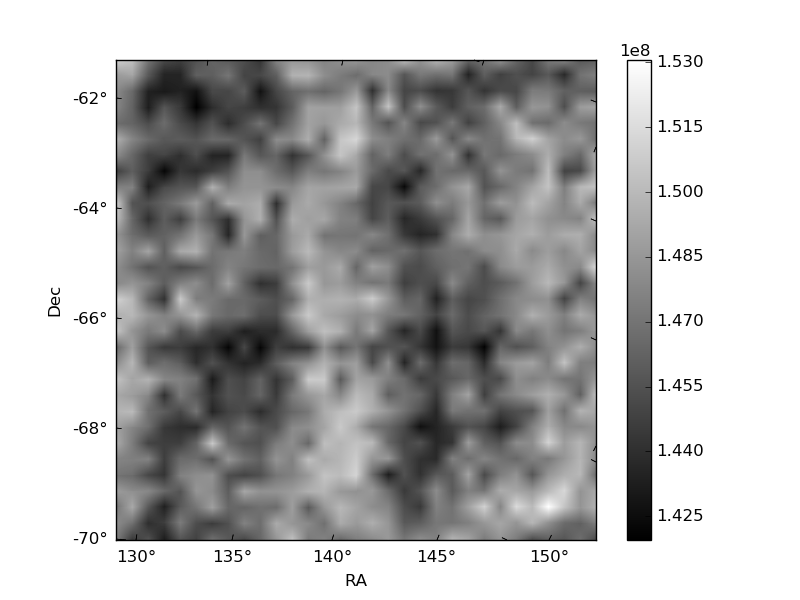
Histogram calculated using DETX and DETY for each event in the final _common_clean file
| Quadrant A | 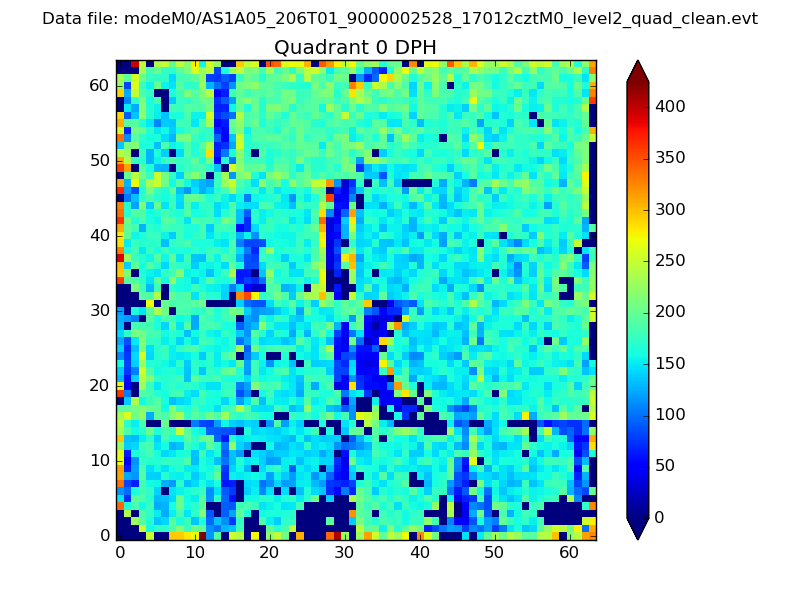 |
 |
Quadrant B |
|---|---|---|---|
| Quadrant D | 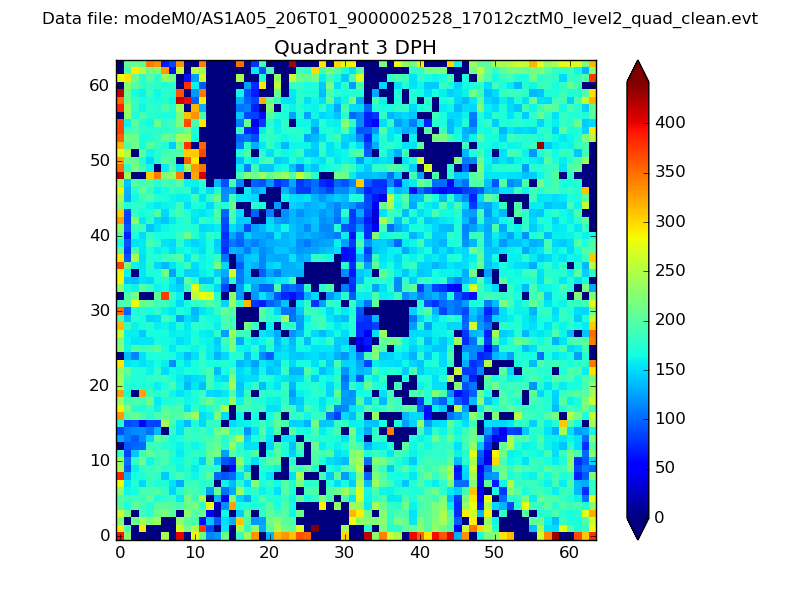 |
 |
Quadrant C |
| Plot type | Count rate plots | Images |
|---|---|---|
| Comparison with Poisson distribution Blue bars denote a histogram of data divided into 1 sec bins. Red curve is a Poisson curve with rate = median count rate of data. |
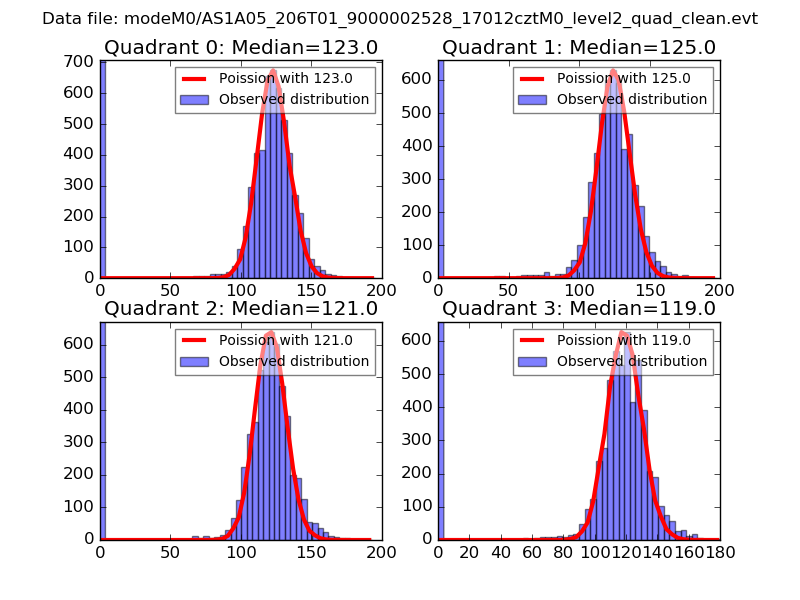 |
 |
| Quadrant-wise count rates Data is divided into 100 sec bins |
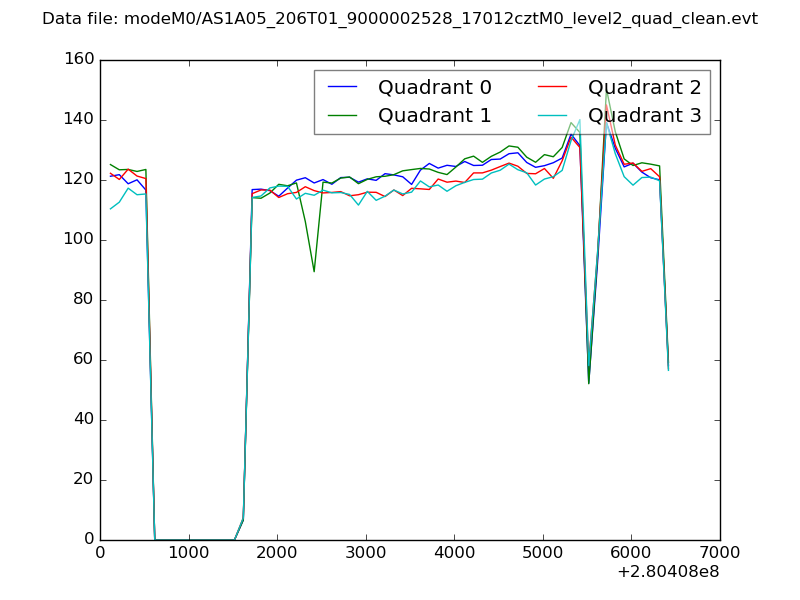 |
|
| Module-wise count rates for Quadrant A Data is divided into 100 sec bins |
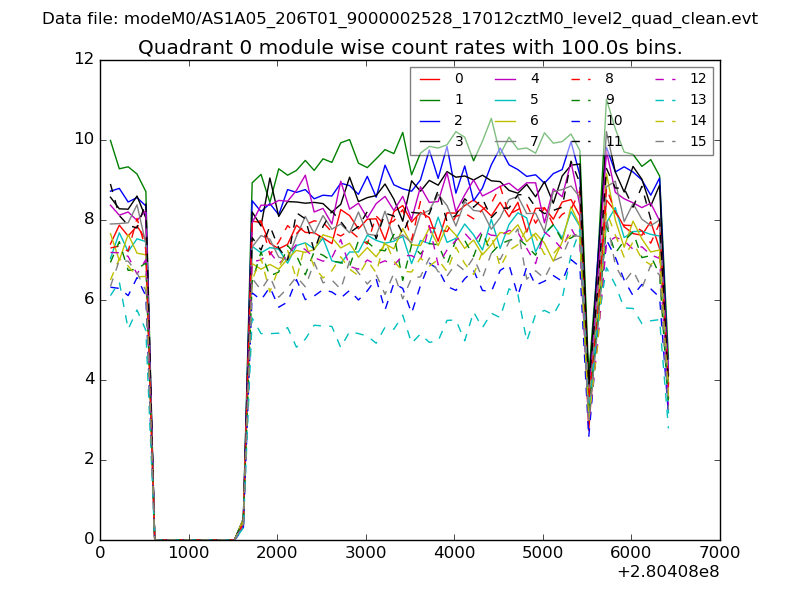 |
 |
| Module-wise count rates for Quadrant B Data is divided into 100 sec bins |
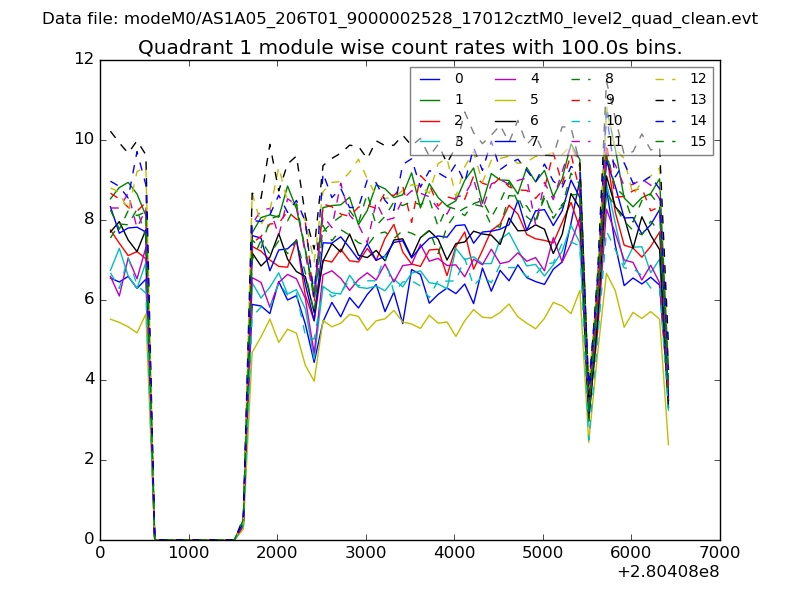 |
 |
| Module-wise count rates for Quadrant C Data is divided into 100 sec bins |
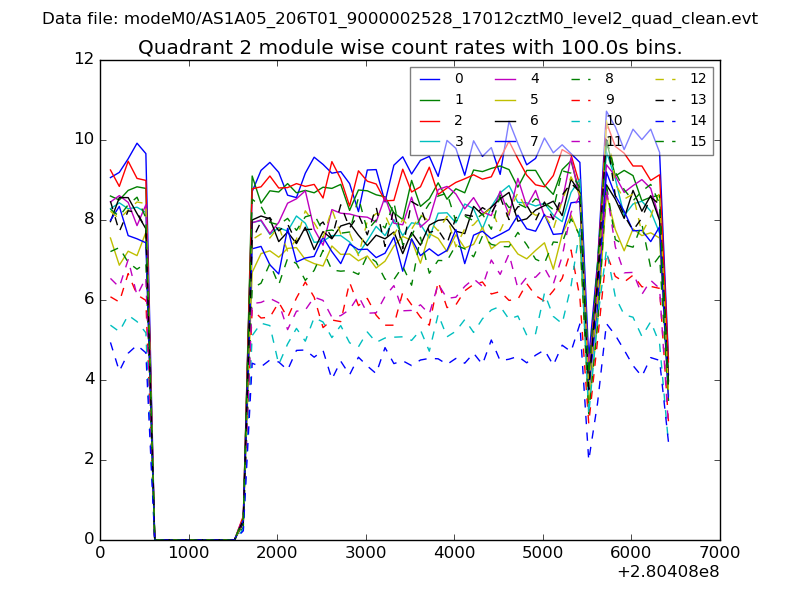 |
 |
| Module-wise count rates for Quadrant D Data is divided into 100 sec bins |
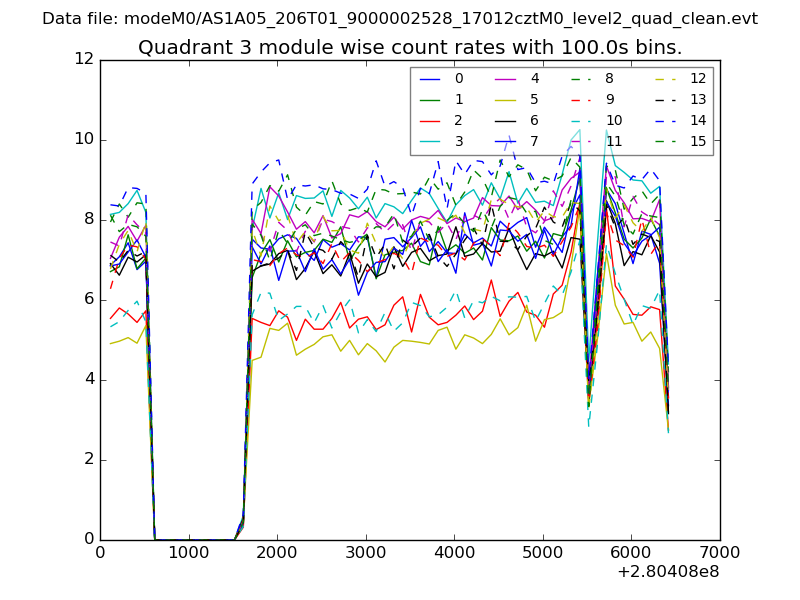 |
 |
| Parameter | Plot |
|---|---|
| CZT HV Monitor | 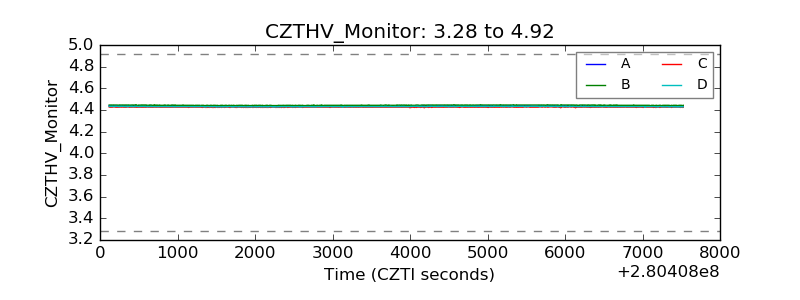 |
| D_VDD | 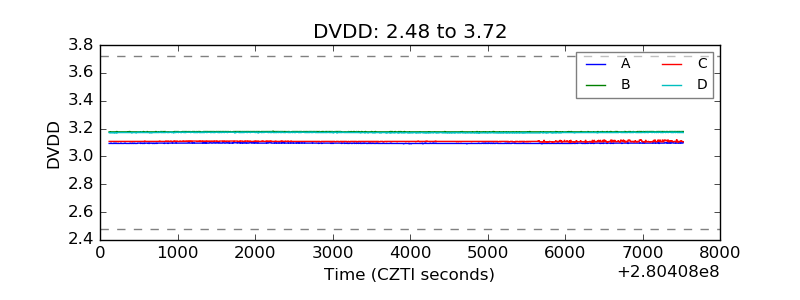 |
| Temperature 1 | 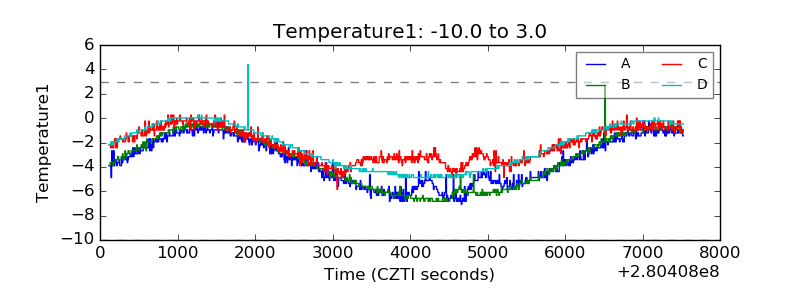 |
| Veto HV Monitor | 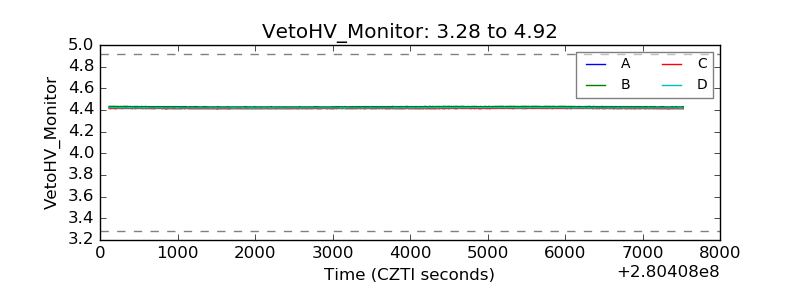 |
| Veto LLD | 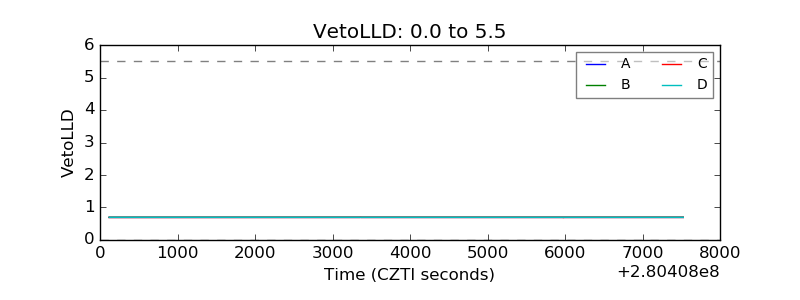 |
| Alpha Counter |  |
| _CPM_Rate | 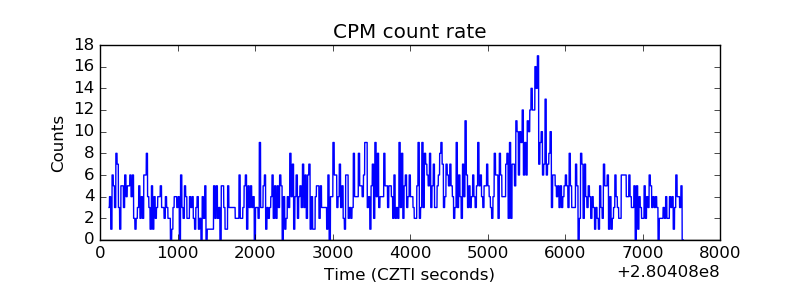 |
| CZT Counter | 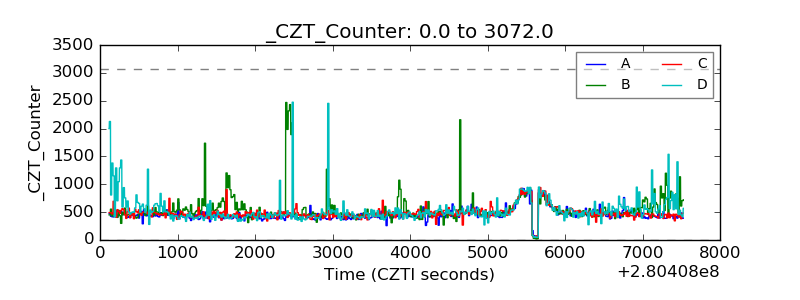 |
| +2.5 Volts monitor |  |
| +5 Volts monitor |  |
| _ROLL_ROT | 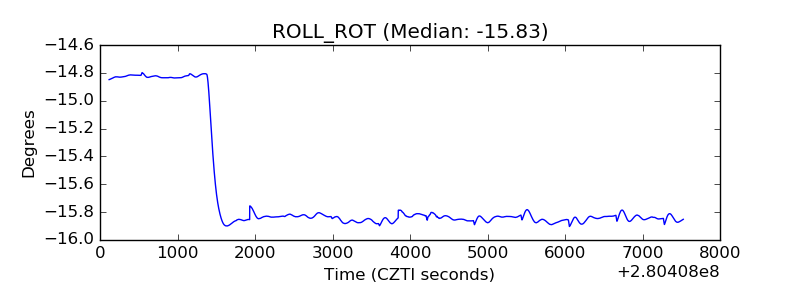 |
| _Roll_DEC | 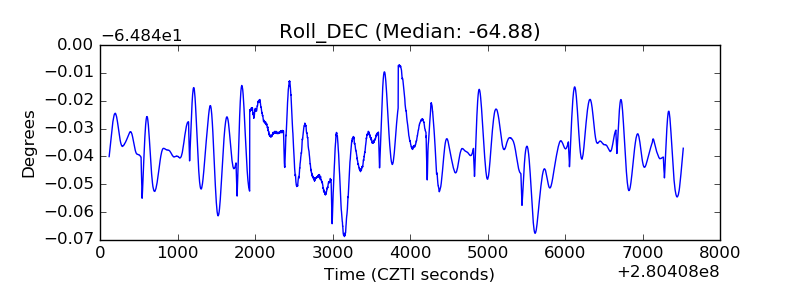 |
| _Roll_RA | 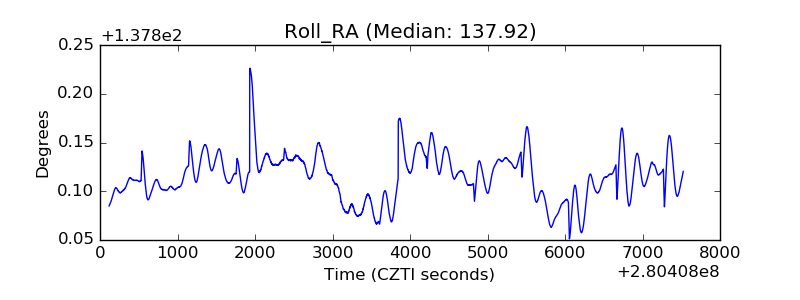 |
| Veto Counter | 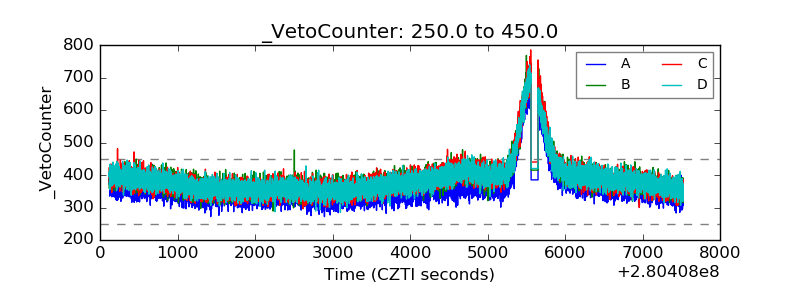 |