| Param | Original file | Final file |
|---|---|---|
| Filename | modeM0/AS1A05_206T01_9000002528_17015cztM0_level2.evt | modeM0/AS1A05_206T01_9000002528_17015cztM0_level2_quad_clean.evt |
| Size (bytes) | 918,789,120 | 189,187,200 |
| Size | 876.2 MB | 180.4 MB |
| Events in quadrant A | 6,713,778 | 1,225,412 |
| Events in quadrant B | 6,752,085 | 1,243,983 |
| Events in quadrant C | 5,892,402 | 1,206,291 |
| Events in quadrant D | 7,612,767 | 1,181,190 |
| Mode M9 | |||
|---|---|---|---|
| Quadrant | BADHDUFLAG | Total packets | Discarded packets |
| A | 0 | 12 | 0 |
| B | 0 | 12 | 0 |
| C | 0 | 12 | 0 |
| D | 0 | 12 | 0 |
| Mode SS | |||
|---|---|---|---|
| Quadrant | BADHDUFLAG | Total packets | Discarded packets |
| A | 0 | 260 | 0 |
| B | 0 | 260 | 0 |
| C | 0 | 260 | 0 |
| D | 0 | 260 | 0 |
| Mode M0 | |||
|---|---|---|---|
| Quadrant | BADHDUFLAG | Total packets | Discarded packets |
| A | 0 | 28469 | 2 |
| B | 0 | 28415 | 2 |
| C | 0 | 25667 | 2 |
| D | 0 | 31369 | 2 |
| Quadrant | Total seconds | Saturated seconds | Saturation percentage |
|---|---|---|---|
| A | 12617 | 322 | 2.552112% |
| B | 12618 | 206 | 1.632588% |
| C | 12618 | 101 | 0.800444% |
| D | 12618 | 322 | 2.551910% |
Noise dominated data is calculated using 1-second bins in cleaned event files. If a bin has >2000 counts, and if more than 50% of those come from <1% of pixels, then it is considered to be noise-dominated and hence unusable.
| Quadrant | # 1 sec bins | Bins with >0 counts | Bins with >2000 counts | High rate bins dominated by noise | Noise dominated (total time) | Noise dominated (detector-on time) | Marked lightcurve |
|---|---|---|---|---|---|---|---|
| A | 13908 | 12620 | 201 | 201 | 1.45% | 1.59% | 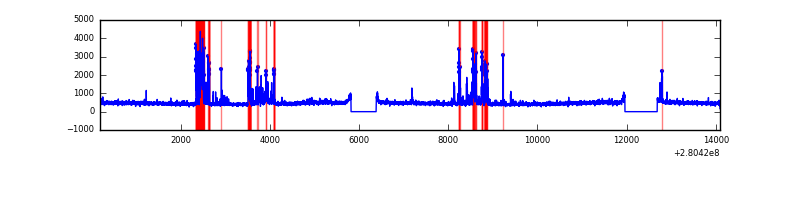 |
| B | 13909 | 12621 | 64 | 64 | 0.46% | 0.51% | 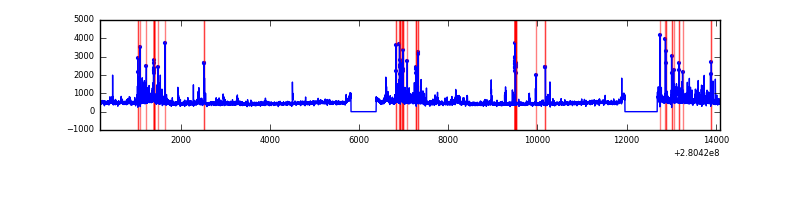 |
| C | 13909 | 12621 | 0 | 0 | 0.00% | 0.00% | 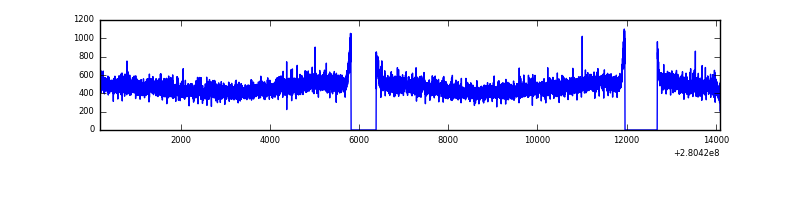 |
| D | 13909 | 12621 | 213 | 213 | 1.53% | 1.69% | 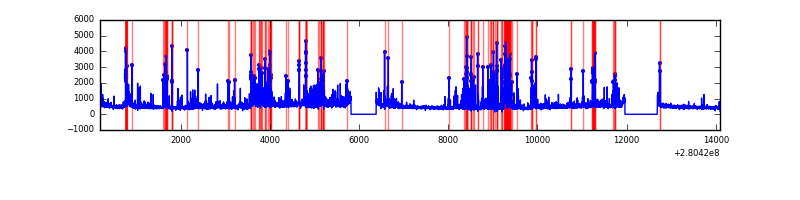 |
Top three noisy pixels from each quadrant. If the there are fewer than three noisy pixels in the level2.evt file, extra rows are filled as -1
| Pixel properties | Quadrant properties | ||||||
|---|---|---|---|---|---|---|---|
| Quadrant | DetID | PixID | Counts | Sigma | Mean | Median | Sigma |
| A | 15 | 174 | 1064131 | 3662.5 | 1454 | 1417 | 290.2 |
| A | 4 | 2 | 36044 | 119.34 | 1454 | 1417 | 290.2 |
| A | 12 | 189 | 25452 | 82.83 | 1454 | 1417 | 290.2 |
| B | 7 | 220 | 478303 | 1718.49 | 1463 | 1423 | 277.5 |
| B | 3 | 64 | 95600 | 339.38 | 1463 | 1423 | 277.5 |
| B | 0 | 219 | 82385 | 291.76 | 1463 | 1423 | 277.5 |
| C | 14 | 238 | 219654 | 666.06 | 1407 | 1412 | 327.7 |
| C | 3 | 233 | 173424 | 524.97 | 1407 | 1412 | 327.7 |
| C | 13 | 61 | 10163 | 26.71 | 1407 | 1412 | 327.7 |
| D | 1 | 52 | 1756415 | 5077.02 | 1417 | 1371 | 345.7 |
| D | 15 | 0 | 346150 | 997.38 | 1417 | 1371 | 345.7 |
| D | 2 | 234 | 60608 | 171.36 | 1417 | 1371 | 345.7 |
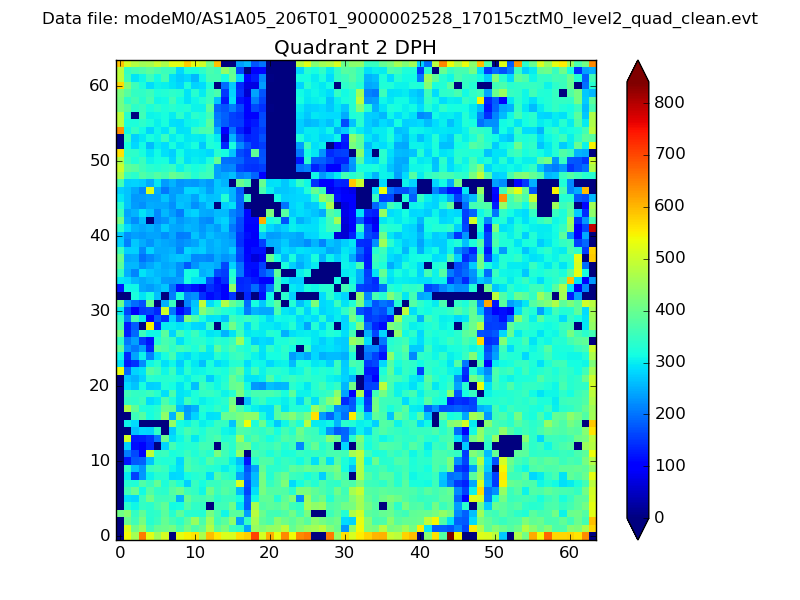
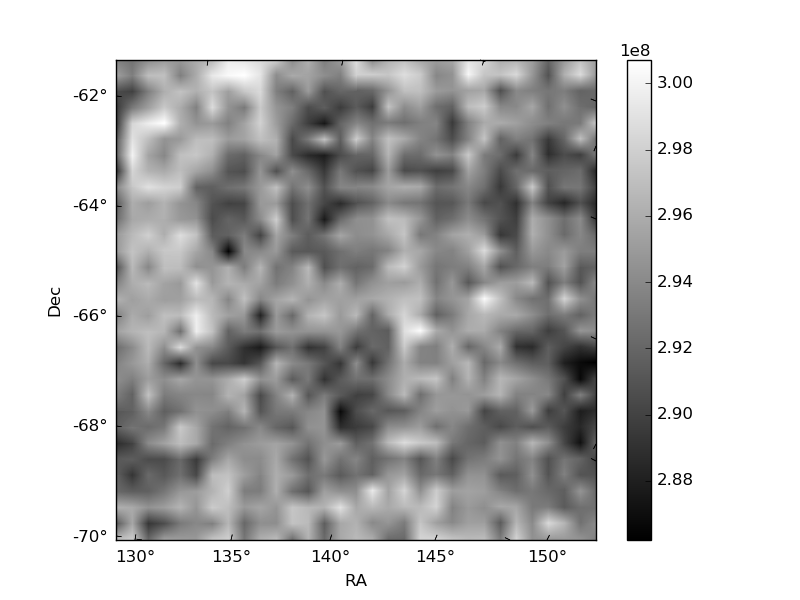
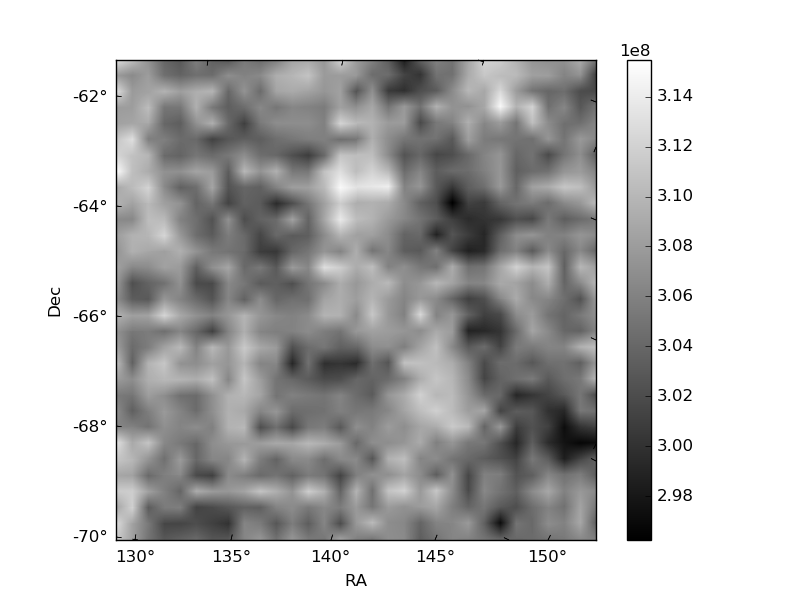
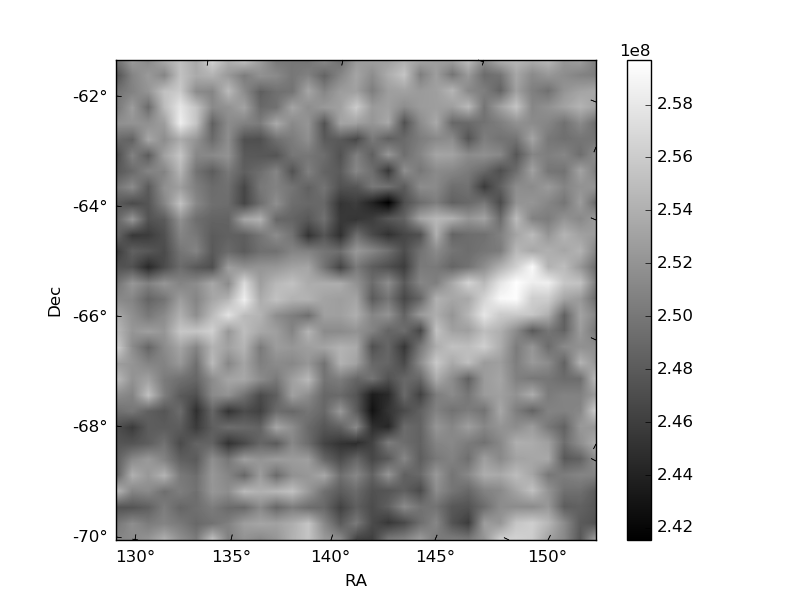
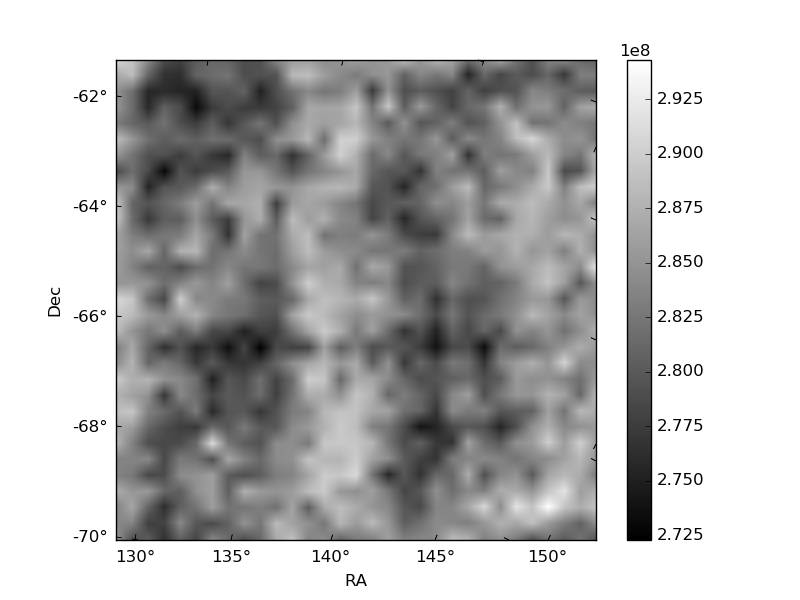
Histogram calculated using DETX and DETY for each event in the final _common_clean file
| Quadrant A | 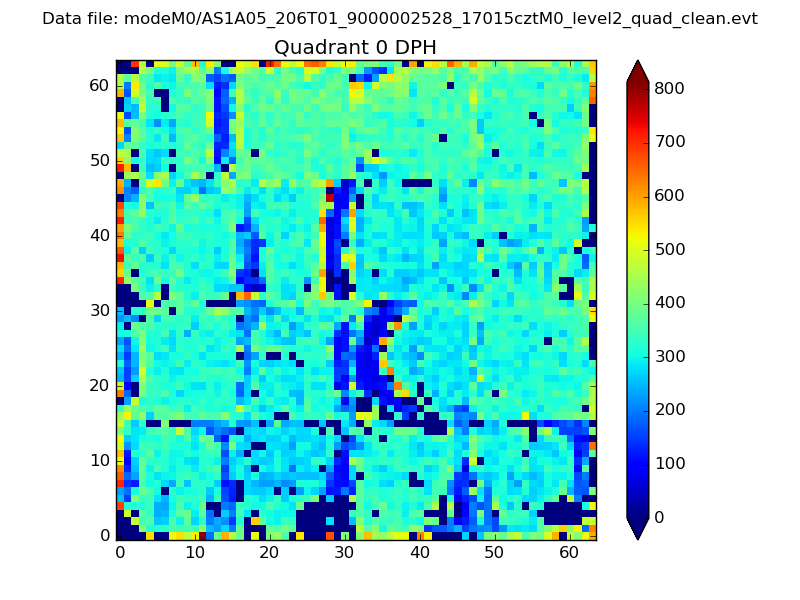 |
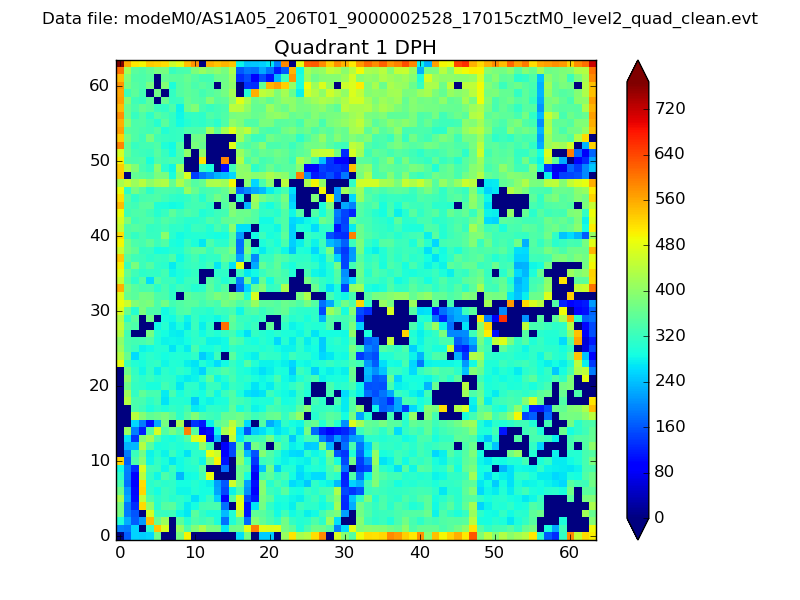 |
Quadrant B |
|---|---|---|---|
| Quadrant D | 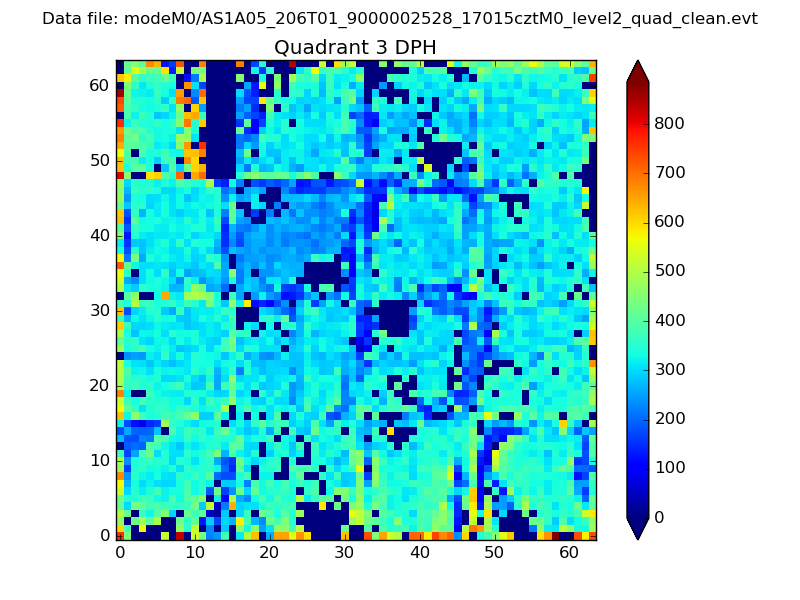 |
 |
Quadrant C |
| Plot type | Count rate plots | Images |
|---|---|---|
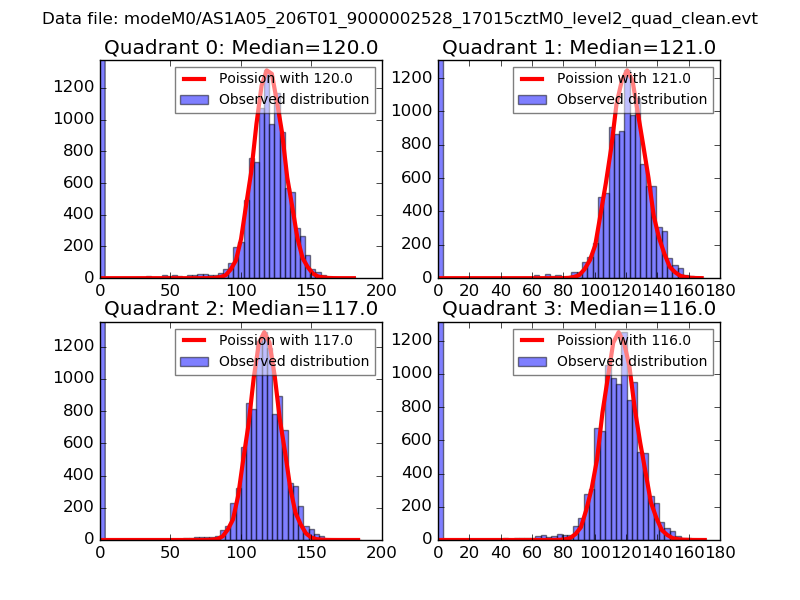
| Comparison with Poisson distribution Blue bars denote a histogram of data divided into 1 sec bins. Red curve is a Poisson curve with rate = median count rate of data. |
 |
 |
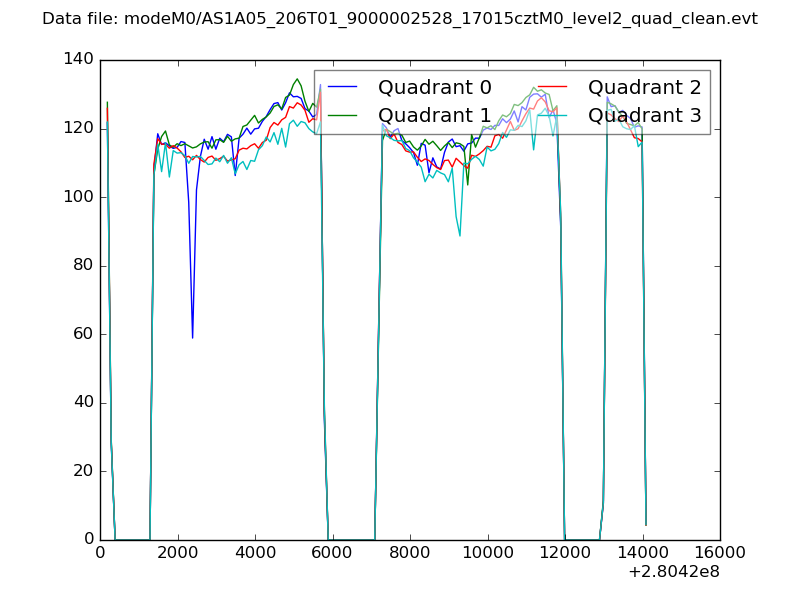
| Quadrant-wise count rates Data is divided into 100 sec bins |
 |
|
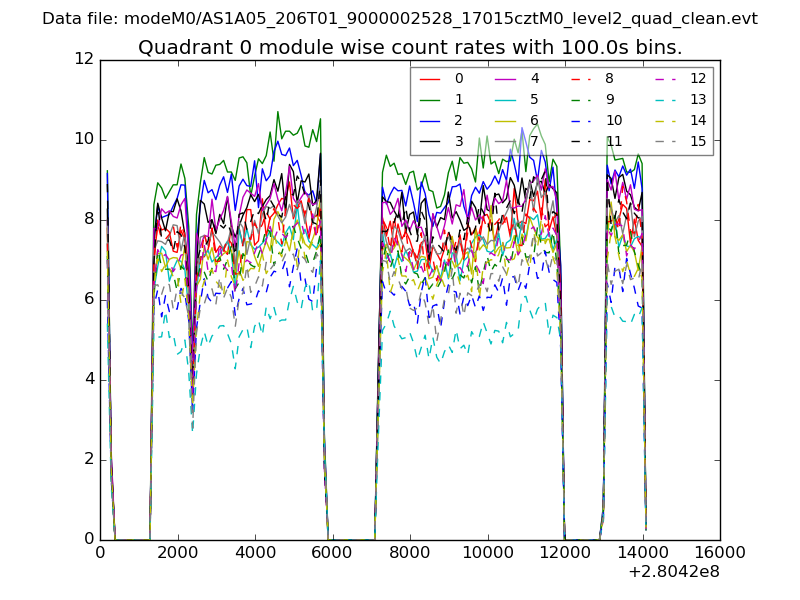
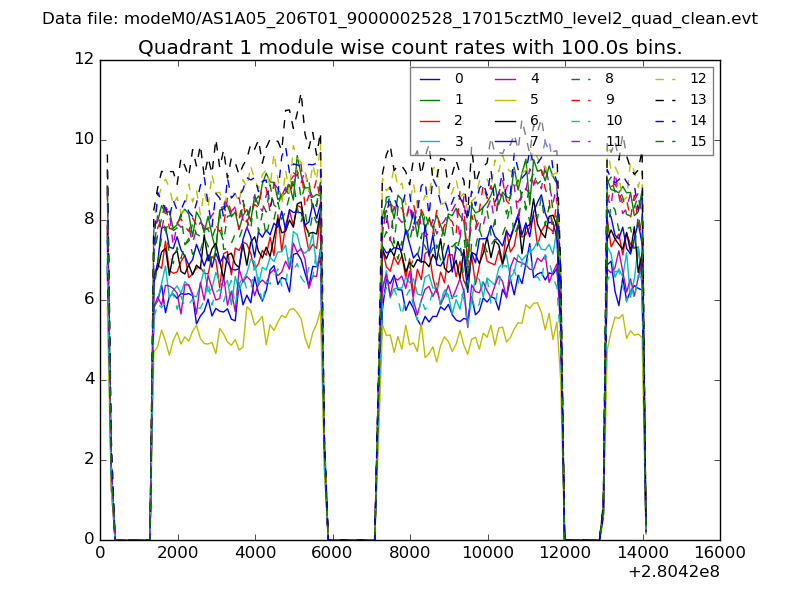
| Module-wise count rates for Quadrant A Data is divided into 100 sec bins |
 |
 |
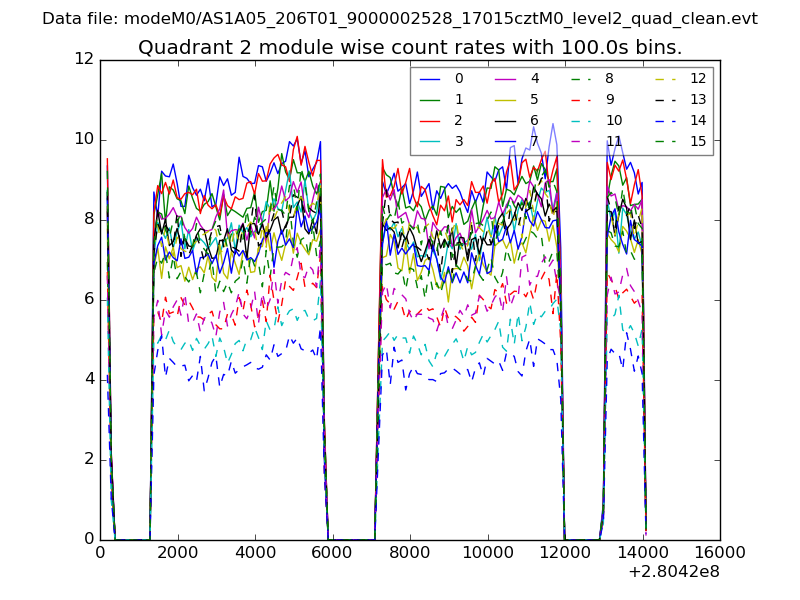
| Module-wise count rates for Quadrant B Data is divided into 100 sec bins |
 |
 |
| Module-wise count rates for Quadrant C Data is divided into 100 sec bins |
 |
 |
| Module-wise count rates for Quadrant D Data is divided into 100 sec bins |
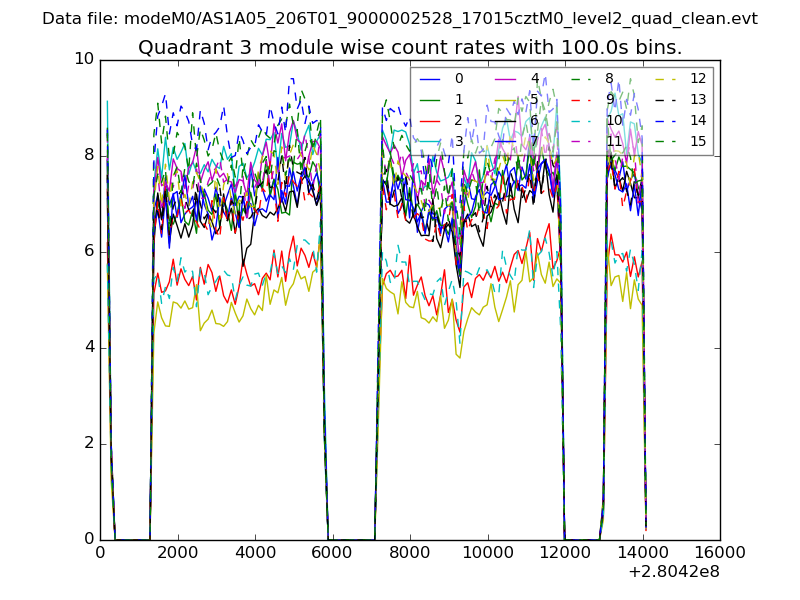 |
 |
| Parameter | Plot |
|---|---|
| CZT HV Monitor | 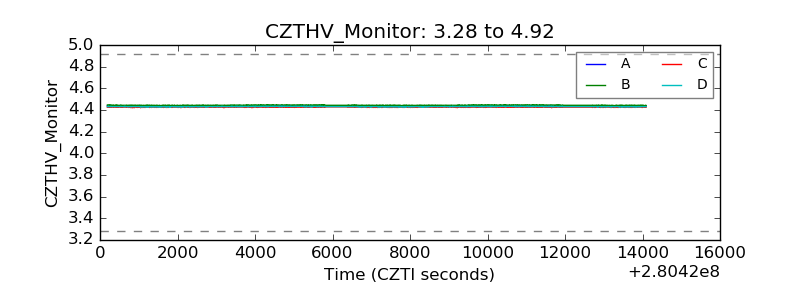 |
| D_VDD | 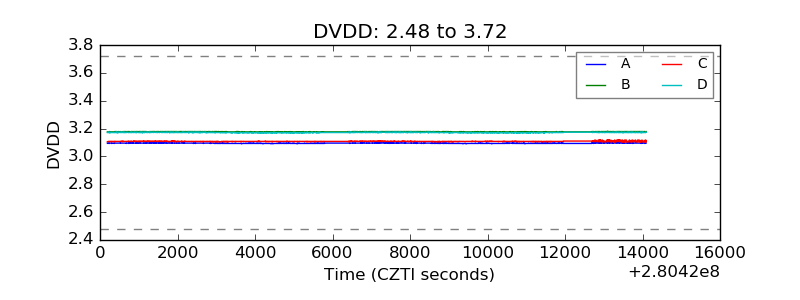 |
| Temperature 1 | 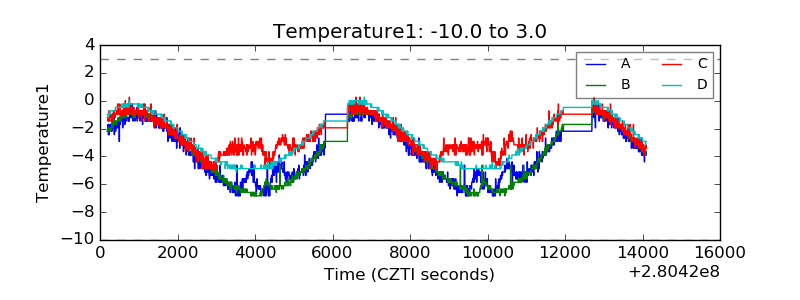 |
| Veto HV Monitor | 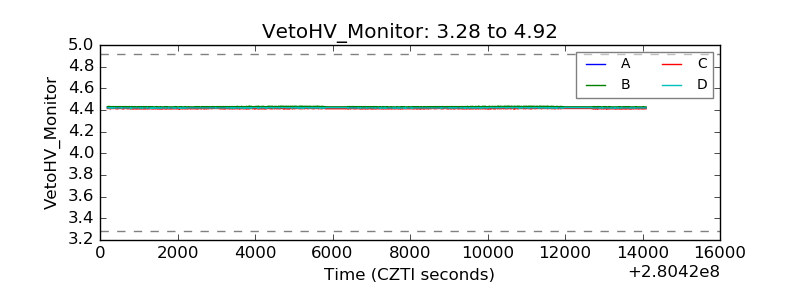 |
| Veto LLD | 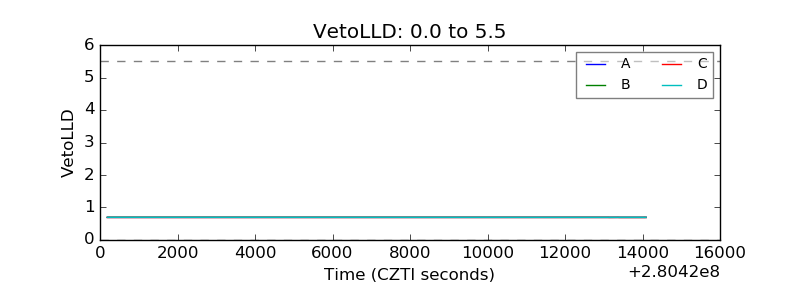 |
| Alpha Counter | 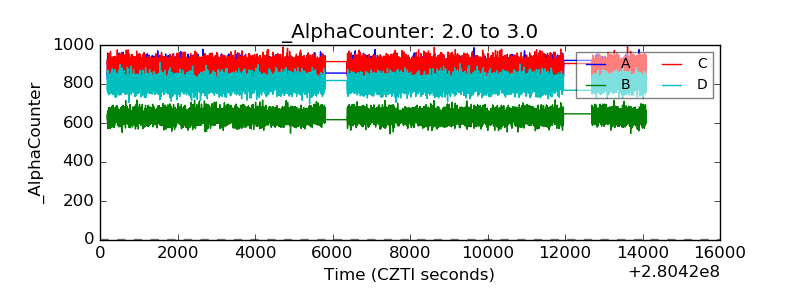 |
| _CPM_Rate | 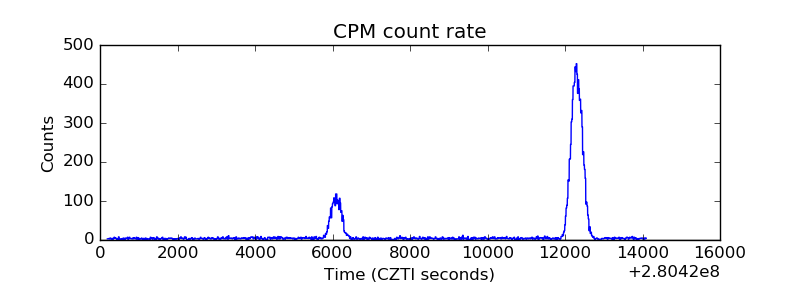 |
| CZT Counter |  |
| +2.5 Volts monitor | 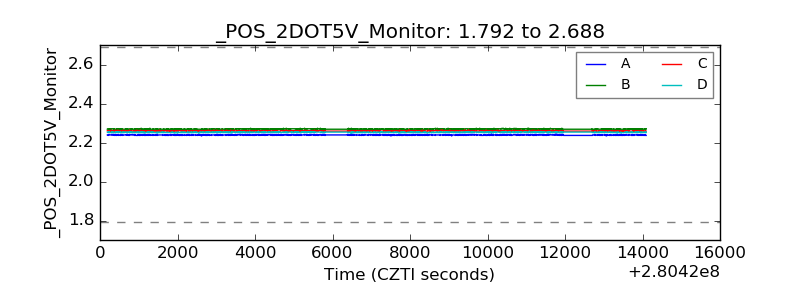 |
| +5 Volts monitor | 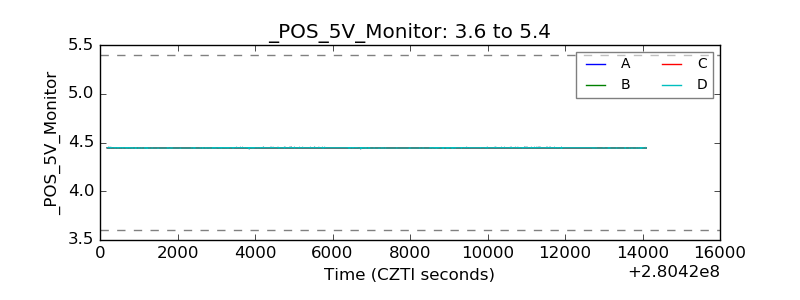 |
| _ROLL_ROT | 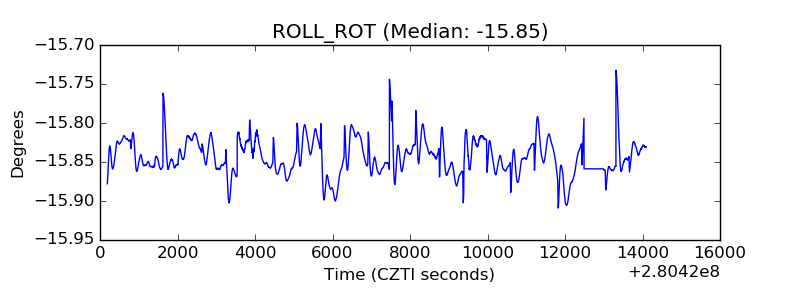 |
| _Roll_DEC | 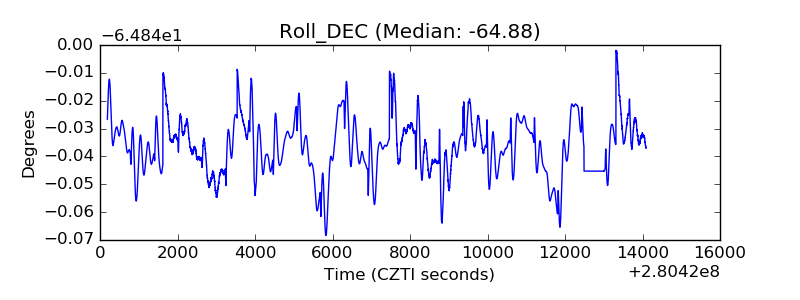 |
| _Roll_RA | 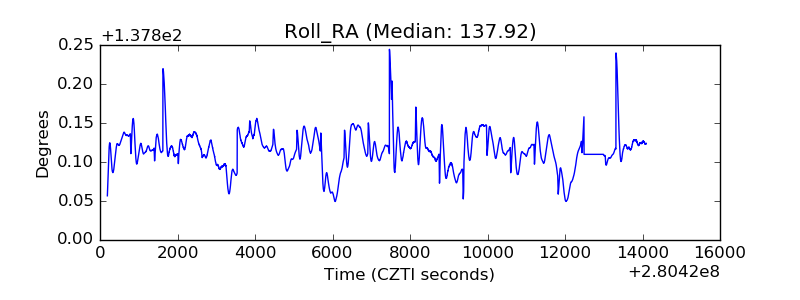 |
| Veto Counter | 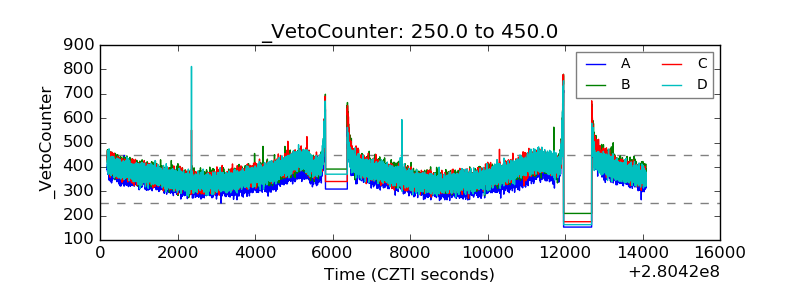 |