| Param | Original file | Final file |
|---|---|---|
| Filename | modeM0/AS1A05_206T01_9000002528_17016cztM0_level2.evt | modeM0/AS1A05_206T01_9000002528_17016cztM0_level2_quad_clean.evt |
| Size (bytes) | 518,129,280 | 112,849,920 |
| Size | 494.1 MB | 107.6 MB |
| Events in quadrant A | 3,949,729 | 745,328 |
| Events in quadrant B | 3,691,477 | 763,448 |
| Events in quadrant C | 3,213,337 | 732,376 |
| Events in quadrant D | 4,378,596 | 705,835 |
| Mode M9 | |||
|---|---|---|---|
| Quadrant | BADHDUFLAG | Total packets | Discarded packets |
| A | 0 | 12 | 0 |
| B | 0 | 13 | 0 |
| C | 0 | 13 | 0 |
| D | 0 | 13 | 0 |
| Mode SS | |||
|---|---|---|---|
| Quadrant | BADHDUFLAG | Total packets | Discarded packets |
| A | 0 | 136 | 0 |
| B | 0 | 136 | 0 |
| C | 0 | 136 | 0 |
| D | 0 | 136 | 0 |
| Mode M0 | |||
|---|---|---|---|
| Quadrant | BADHDUFLAG | Total packets | Discarded packets |
| A | 0 | 16284 | 2 |
| B | 0 | 15524 | 2 |
| C | 0 | 13896 | 2 |
| D | 0 | 17613 | 2 |
| Quadrant | Total seconds | Saturated seconds | Saturation percentage |
|---|---|---|---|
| A | 6757 | 182 | 2.693503% |
| B | 6757 | 129 | 1.909131% |
| C | 6757 | 45 | 0.665976% |
| D | 6757 | 346 | 5.120616% |
Noise dominated data is calculated using 1-second bins in cleaned event files. If a bin has >2000 counts, and if more than 50% of those come from <1% of pixels, then it is considered to be noise-dominated and hence unusable.
| Quadrant | # 1 sec bins | Bins with >0 counts | Bins with >2000 counts | High rate bins dominated by noise | Noise dominated (total time) | Noise dominated (detector-on time) | Marked lightcurve |
|---|---|---|---|---|---|---|---|
| A | 7673 | 6759 | 103 | 103 | 1.34% | 1.52% | 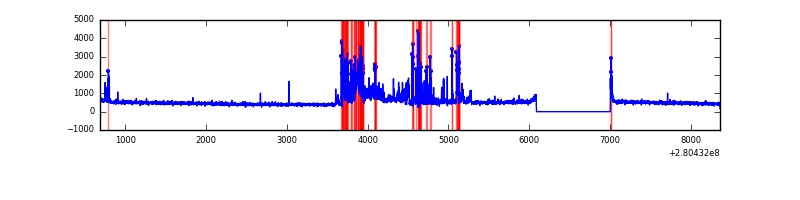 |
| B | 7673 | 6759 | 34 | 34 | 0.44% | 0.50% | 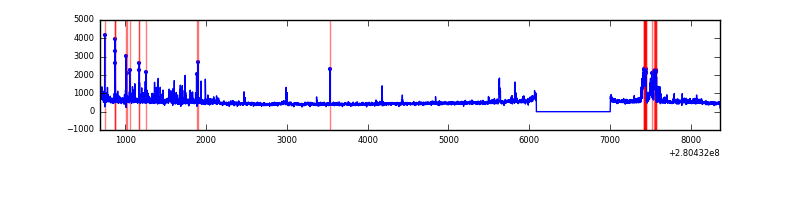 |
| C | 7673 | 6759 | 0 | 0 | 0.00% | 0.00% | 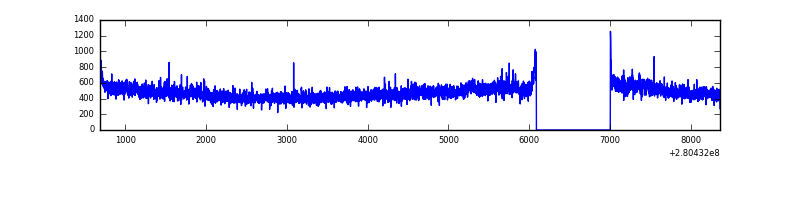 |
| D | 7673 | 6759 | 276 | 276 | 3.60% | 4.08% | 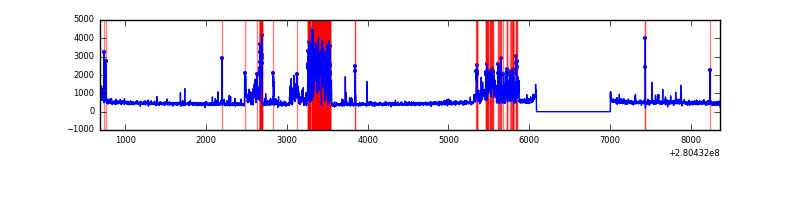 |
Top three noisy pixels from each quadrant. If the there are fewer than three noisy pixels in the level2.evt file, extra rows are filled as -1
| Pixel properties | Quadrant properties | ||||||
|---|---|---|---|---|---|---|---|
| Quadrant | DetID | PixID | Counts | Sigma | Mean | Median | Sigma |
| A | 15 | 174 | 892402 | 5628.13 | 788 | 769 | 158.4 |
| A | 14 | 250 | 20752 | 126.13 | 788 | 769 | 158.4 |
| A | 0 | 226 | 6970 | 39.14 | 788 | 769 | 158.4 |
| B | 15 | 35 | 198770 | 1301.85 | 794 | 773 | 152.1 |
| B | 7 | 220 | 170432 | 1115.52 | 794 | 773 | 152.1 |
| B | 0 | 219 | 66093 | 429.49 | 794 | 773 | 152.1 |
| C | 3 | 233 | 117993 | 661.03 | 757 | 760 | 177.3 |
| C | 14 | 238 | 117987 | 660.99 | 757 | 760 | 177.3 |
| C | 8 | 128 | 10964 | 57.54 | 757 | 760 | 177.3 |
| D | 1 | 52 | 1334677 | 7192.26 | 757 | 732 | 185.5 |
| D | 5 | 222 | 55484 | 295.21 | 757 | 732 | 185.5 |
| D | 10 | 70 | 35906 | 189.65 | 757 | 732 | 185.5 |
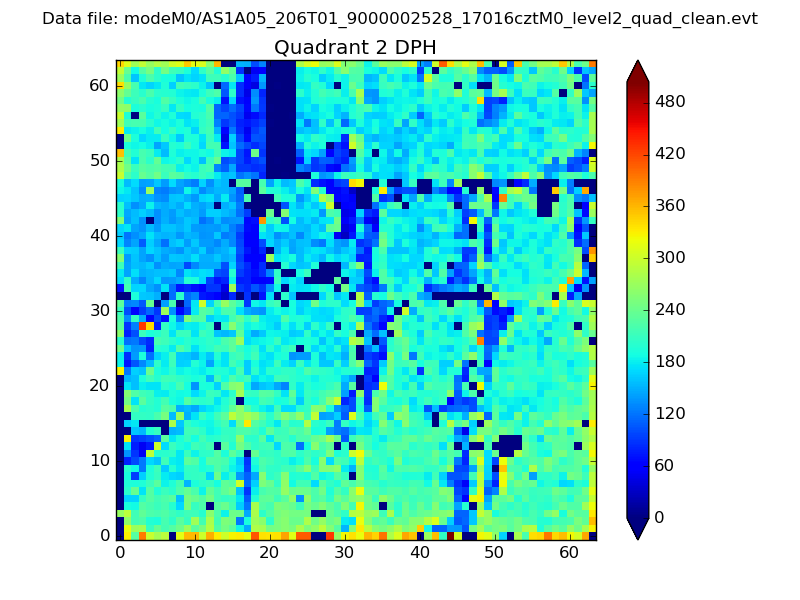
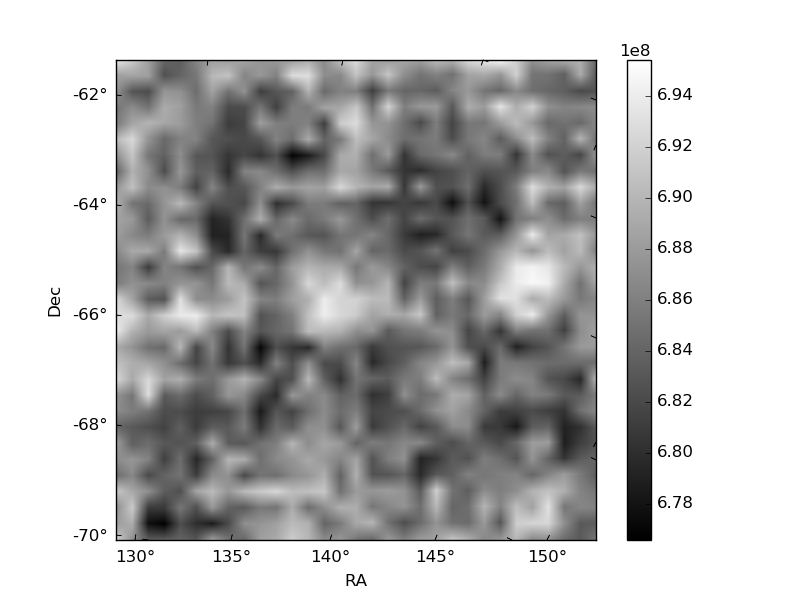
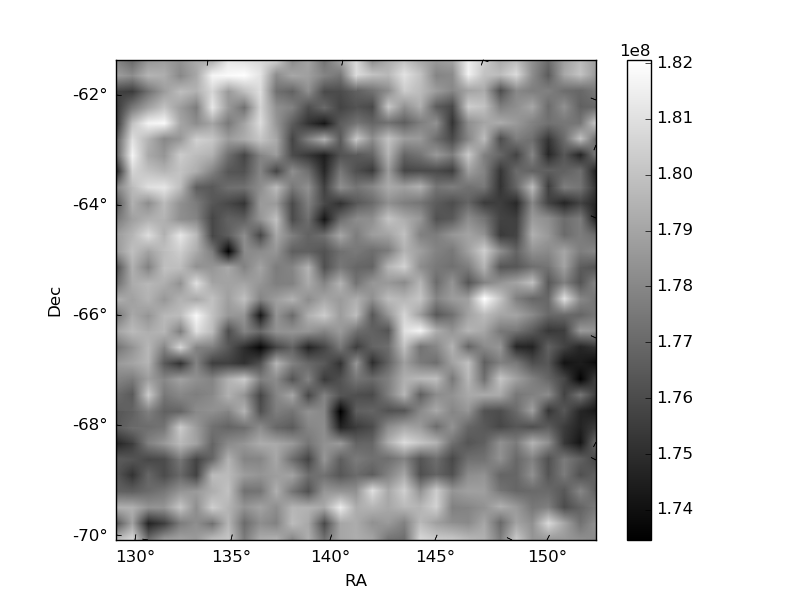
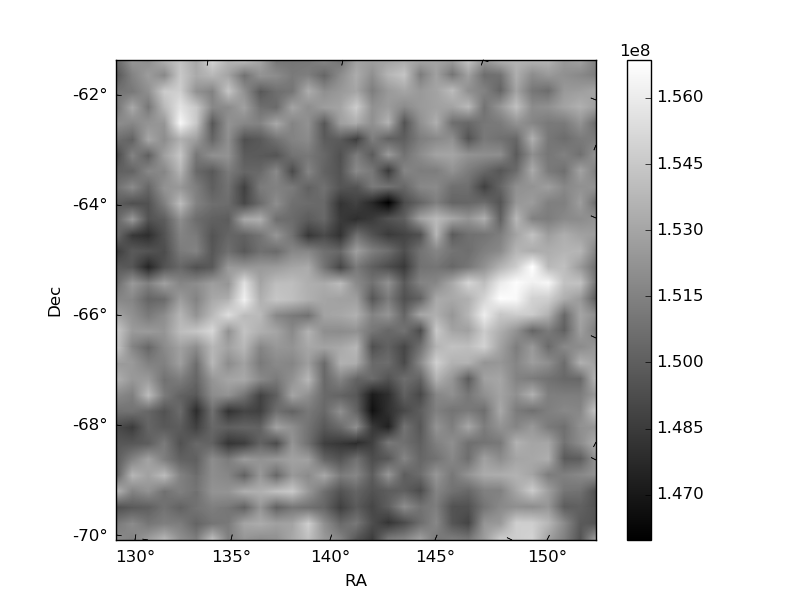
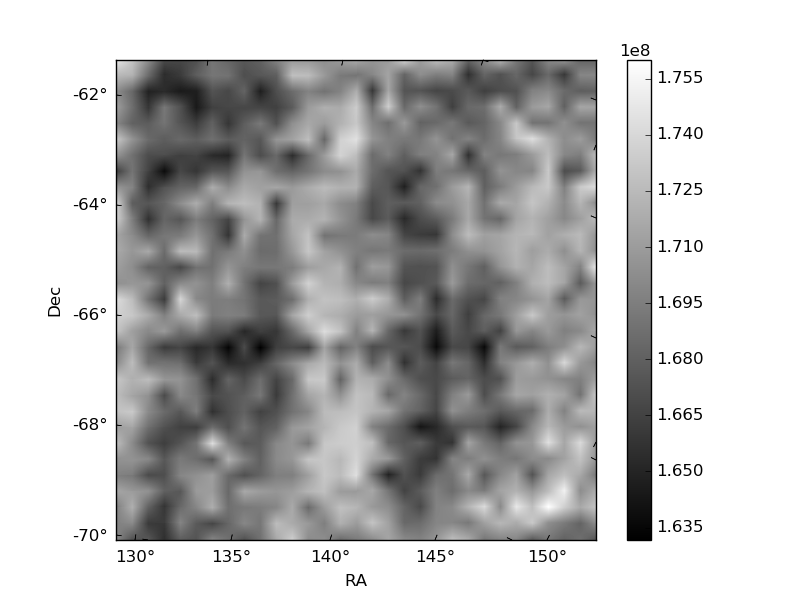
Histogram calculated using DETX and DETY for each event in the final _common_clean file
| Quadrant A | 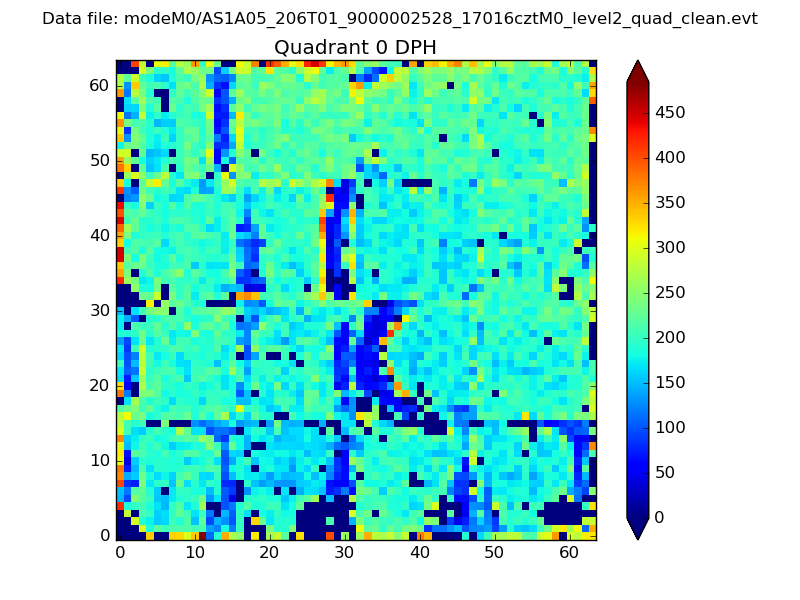 |
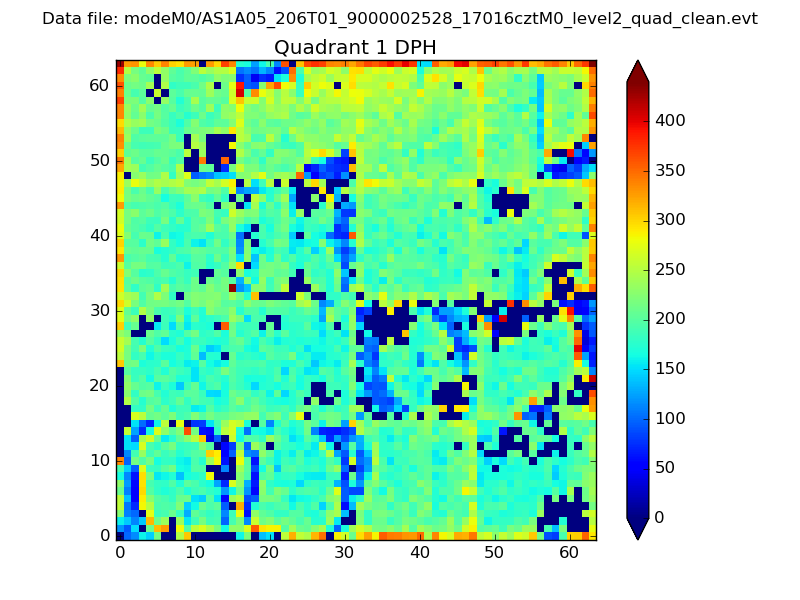 |
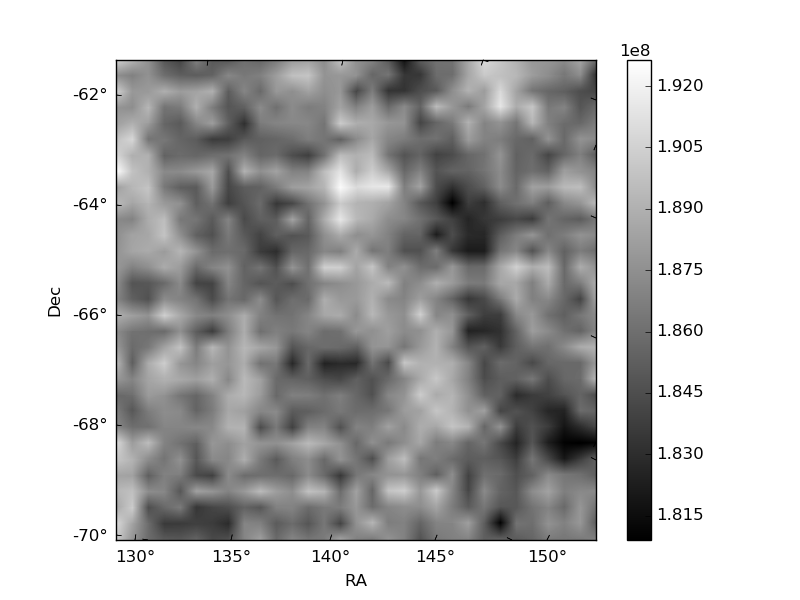
Quadrant B |
|---|---|---|---|
| Quadrant D | 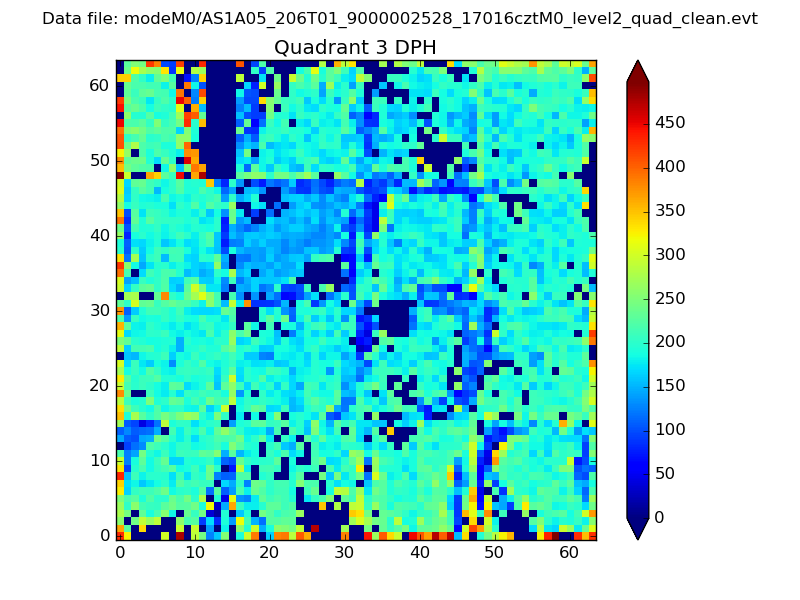 |
 |
Quadrant C |
| Plot type | Count rate plots | Images |
|---|---|---|
| Comparison with Poisson distribution Blue bars denote a histogram of data divided into 1 sec bins. Red curve is a Poisson curve with rate = median count rate of data. |
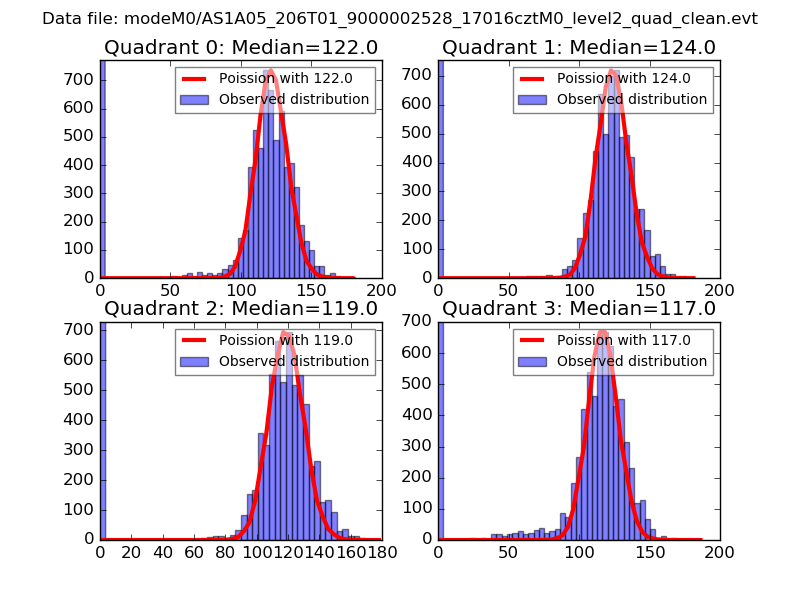 |
 |
| Quadrant-wise count rates Data is divided into 100 sec bins |
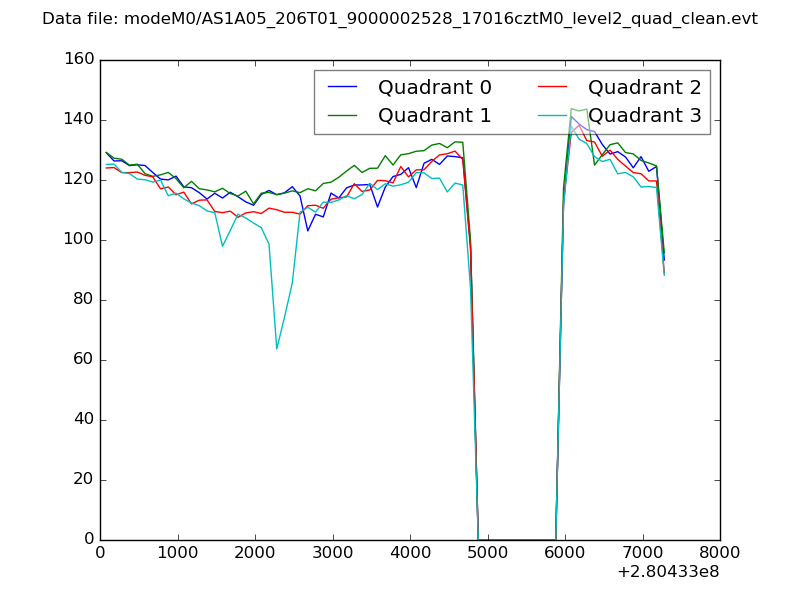 |
|
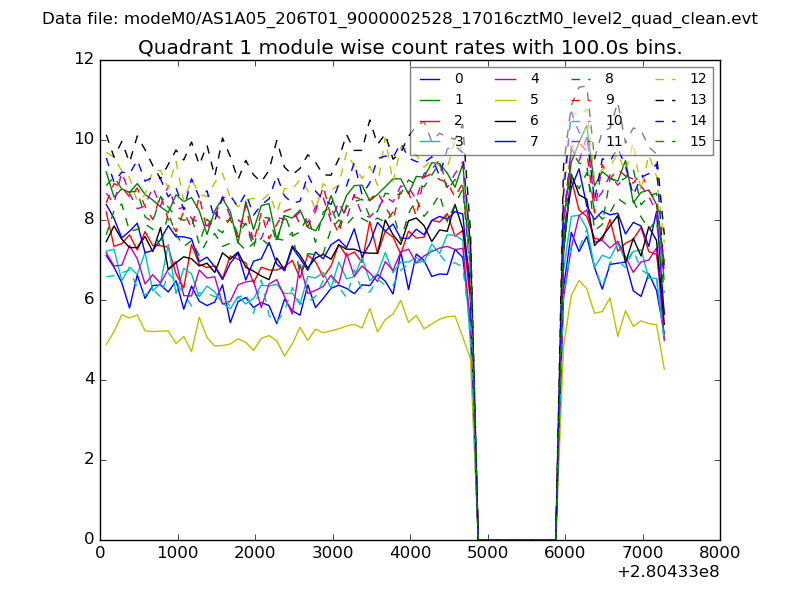
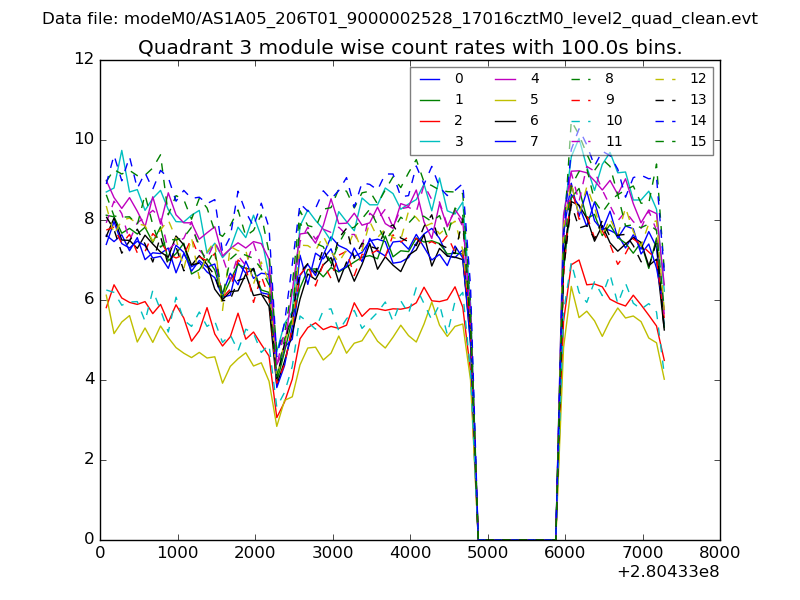
| Module-wise count rates for Quadrant A Data is divided into 100 sec bins |
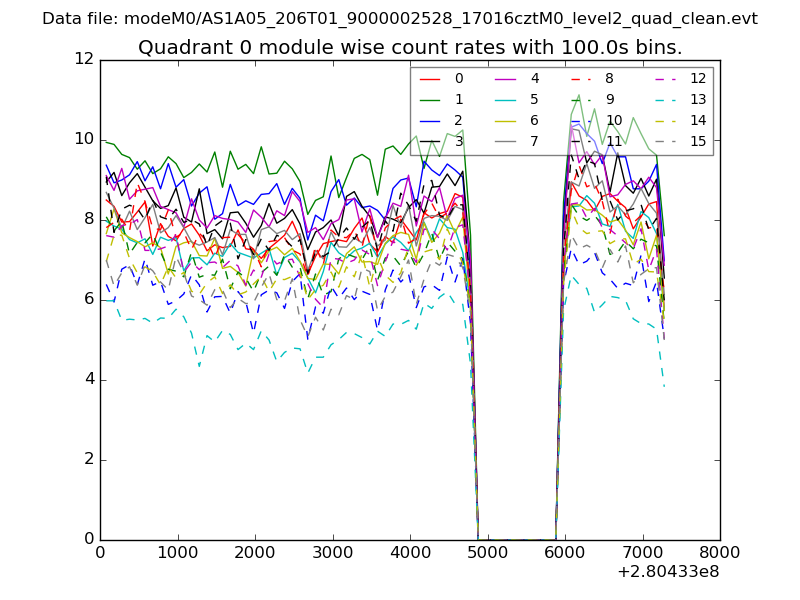 |
 |
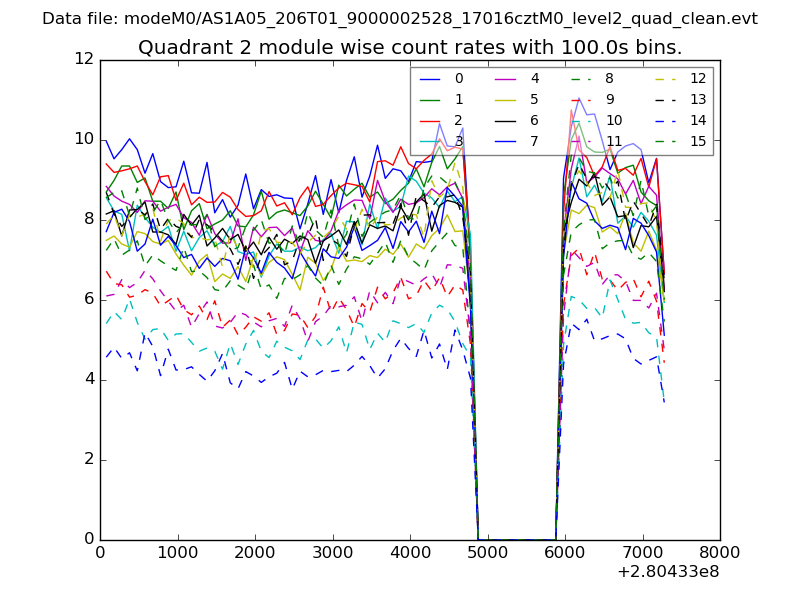
| Module-wise count rates for Quadrant B Data is divided into 100 sec bins |
 |
 |
| Module-wise count rates for Quadrant C Data is divided into 100 sec bins |
 |
 |
| Module-wise count rates for Quadrant D Data is divided into 100 sec bins |
 |
 |
| Parameter | Plot |
|---|---|
| CZT HV Monitor | 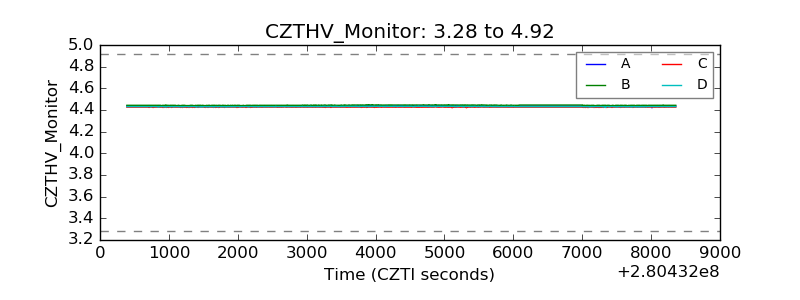 |
| D_VDD | 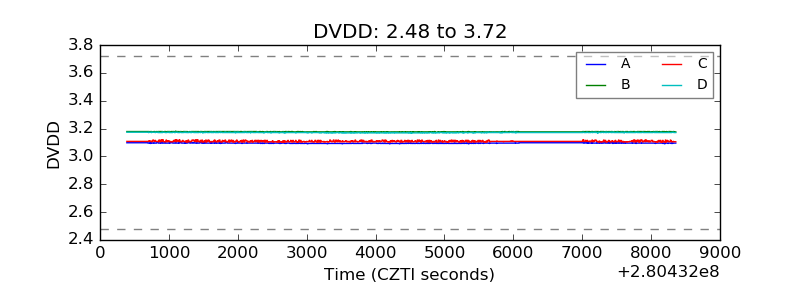 |
| Temperature 1 | 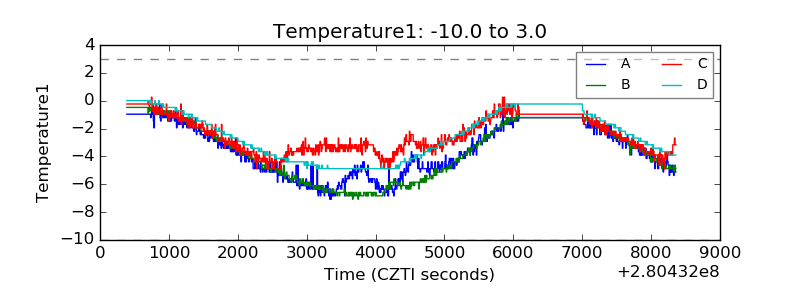 |
| Veto HV Monitor |  |
| Veto LLD | 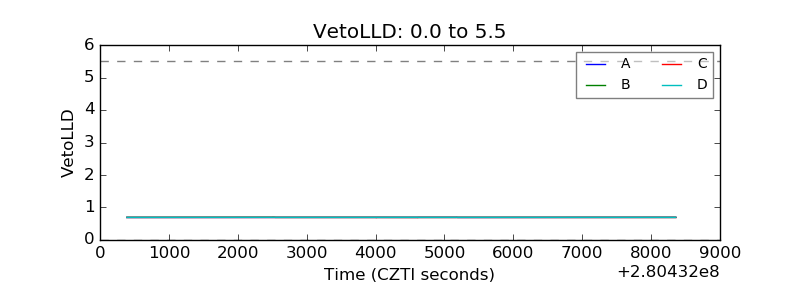 |
| Alpha Counter |  |
| _CPM_Rate |  |
| CZT Counter | 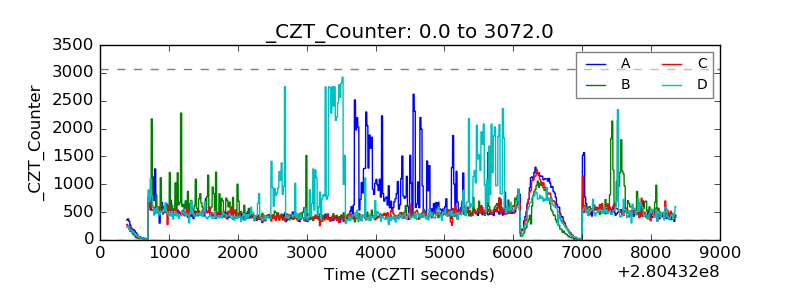 |
| +2.5 Volts monitor |  |
| +5 Volts monitor |  |
| _ROLL_ROT | 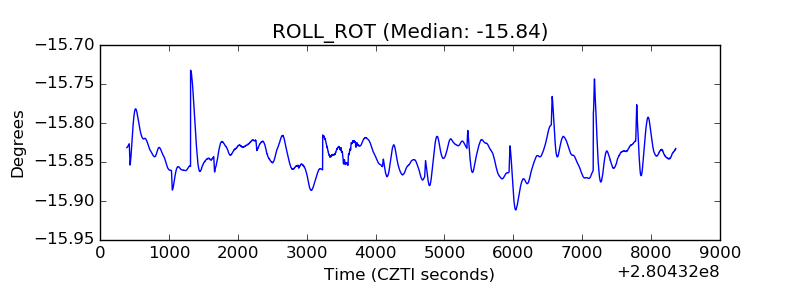 |
| _Roll_DEC | 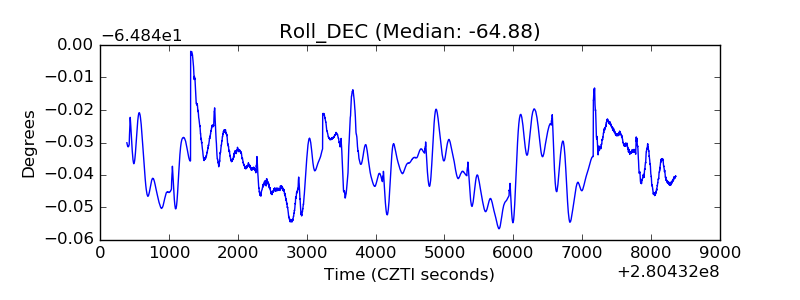 |
| _Roll_RA | 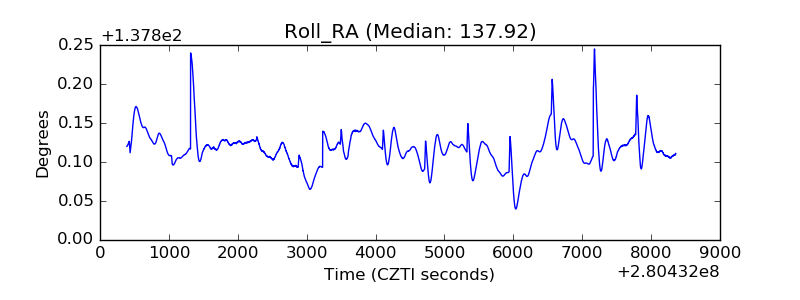 |
| Veto Counter | 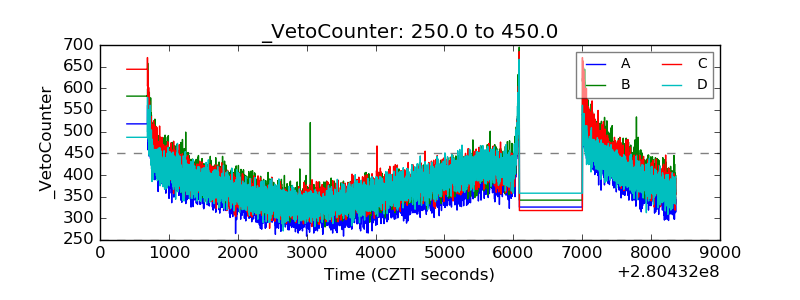 |