| Param | Original file | Final file |
|---|---|---|
| Filename | modeM0/AS1A05_206T01_9000002528_17019cztM0_level2.evt | modeM0/AS1A05_206T01_9000002528_17019cztM0_level2_quad_clean.evt |
| Size (bytes) | 476,095,680 | 117,504,000 |
| Size | 454.0 MB | 112.1 MB |
| Events in quadrant A | 3,361,118 | 779,466 |
| Events in quadrant B | 3,529,462 | 806,400 |
| Events in quadrant C | 3,279,707 | 766,840 |
| Events in quadrant D | 3,796,701 | 742,438 |
| Mode M9 | |||
|---|---|---|---|
| Quadrant | BADHDUFLAG | Total packets | Discarded packets |
| A | 0 | 15 | 0 |
| B | 0 | 16 | 0 |
| C | 0 | 16 | 0 |
| D | 0 | 16 | 0 |
| Mode SS | |||
|---|---|---|---|
| Quadrant | BADHDUFLAG | Total packets | Discarded packets |
| A | 0 | 134 | 0 |
| B | 0 | 134 | 0 |
| C | 0 | 134 | 0 |
| D | 0 | 134 | 0 |
| Mode M0 | |||
|---|---|---|---|
| Quadrant | BADHDUFLAG | Total packets | Discarded packets |
| A | 0 | 14455 | 2 |
| B | 0 | 14919 | 2 |
| C | 0 | 13868 | 2 |
| D | 0 | 15831 | 2 |
| Quadrant | Total seconds | Saturated seconds | Saturation percentage |
|---|---|---|---|
| A | 6656 | 90 | 1.352163% |
| B | 6656 | 82 | 1.231971% |
| C | 6656 | 41 | 0.615986% |
| D | 6656 | 91 | 1.367188% |
Noise dominated data is calculated using 1-second bins in cleaned event files. If a bin has >2000 counts, and if more than 50% of those come from <1% of pixels, then it is considered to be noise-dominated and hence unusable.
| Quadrant | # 1 sec bins | Bins with >0 counts | Bins with >2000 counts | High rate bins dominated by noise | Noise dominated (total time) | Noise dominated (detector-on time) | Marked lightcurve |
|---|---|---|---|---|---|---|---|
| A | 7847 | 6658 | 36 | 36 | 0.46% | 0.54% | 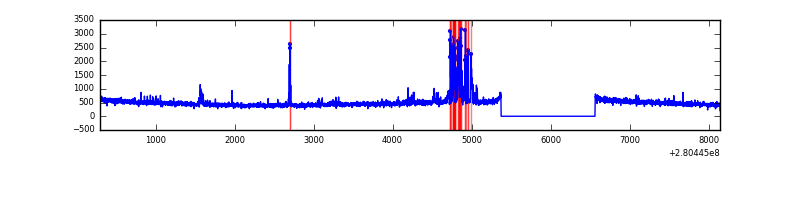 |
| B | 7847 | 6658 | 23 | 23 | 0.29% | 0.35% | 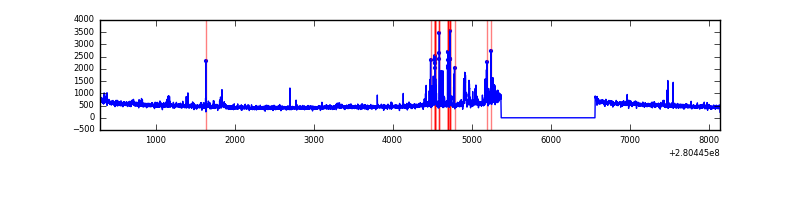 |
| C | 7847 | 6658 | 0 | 0 | 0.00% | 0.00% | 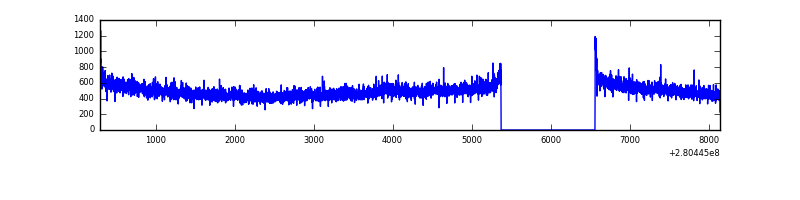 |
| D | 7847 | 6658 | 72 | 72 | 0.92% | 1.08% | 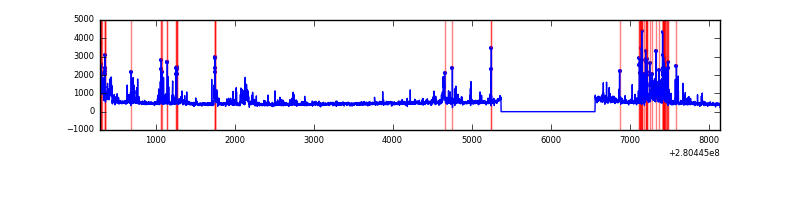 |
Top three noisy pixels from each quadrant. If the there are fewer than three noisy pixels in the level2.evt file, extra rows are filled as -1
| Pixel properties | Quadrant properties | ||||||
|---|---|---|---|---|---|---|---|
| Quadrant | DetID | PixID | Counts | Sigma | Mean | Median | Sigma |
| A | 15 | 174 | 276002 | 1707.58 | 798 | 779 | 161.2 |
| A | 4 | 2 | 13094 | 76.4 | 798 | 779 | 161.2 |
| A | 0 | 226 | 7054 | 38.93 | 798 | 779 | 161.2 |
| B | 3 | 64 | 178372 | 1159.07 | 812 | 789 | 153.2 |
| B | 7 | 220 | 48230 | 309.64 | 812 | 789 | 153.2 |
| B | 0 | 219 | 43409 | 278.18 | 812 | 789 | 153.2 |
| C | 14 | 238 | 120938 | 660.33 | 779 | 782 | 182.0 |
| C | 3 | 233 | 95148 | 518.6 | 779 | 782 | 182.0 |
| C | 7 | 247 | 10415 | 52.94 | 779 | 782 | 182.0 |
| D | 1 | 52 | 684229 | 3628.3 | 776 | 754 | 188.4 |
| D | 10 | 70 | 103632 | 546.14 | 776 | 754 | 188.4 |
| D | 12 | 235 | 46497 | 242.83 | 776 | 754 | 188.4 |
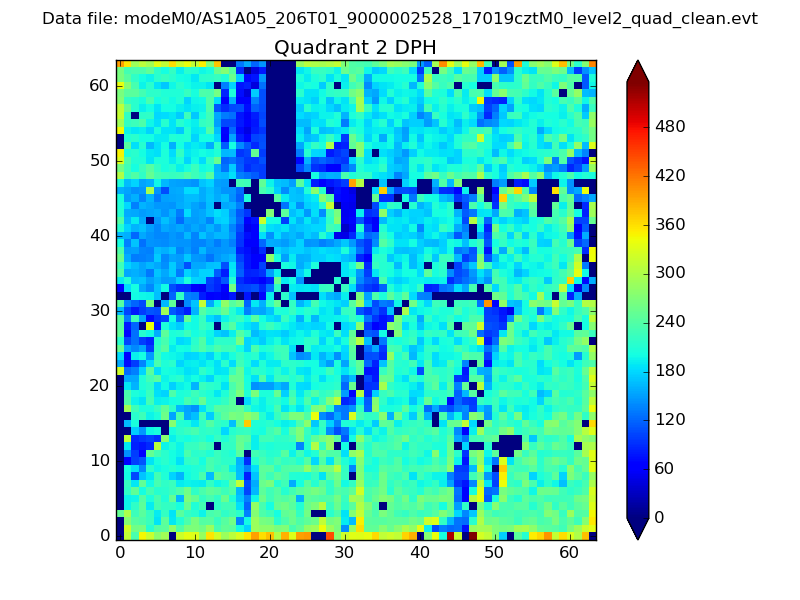
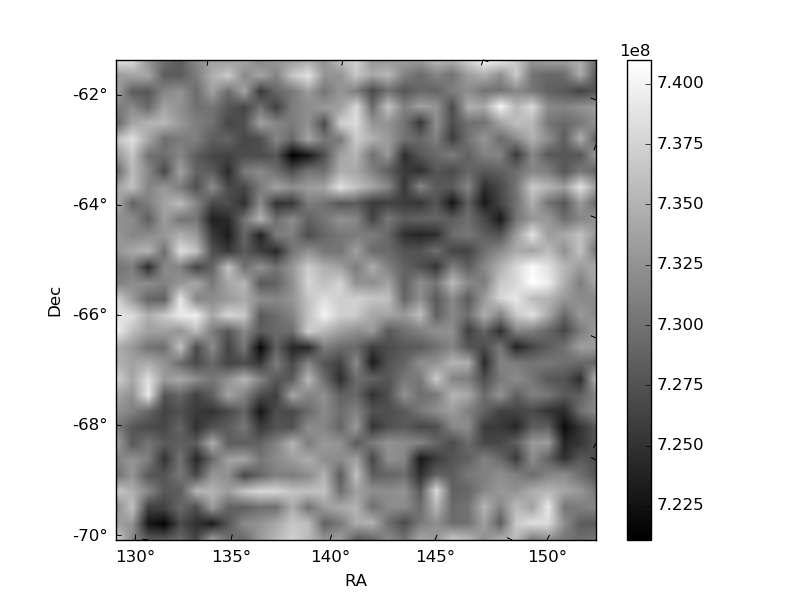
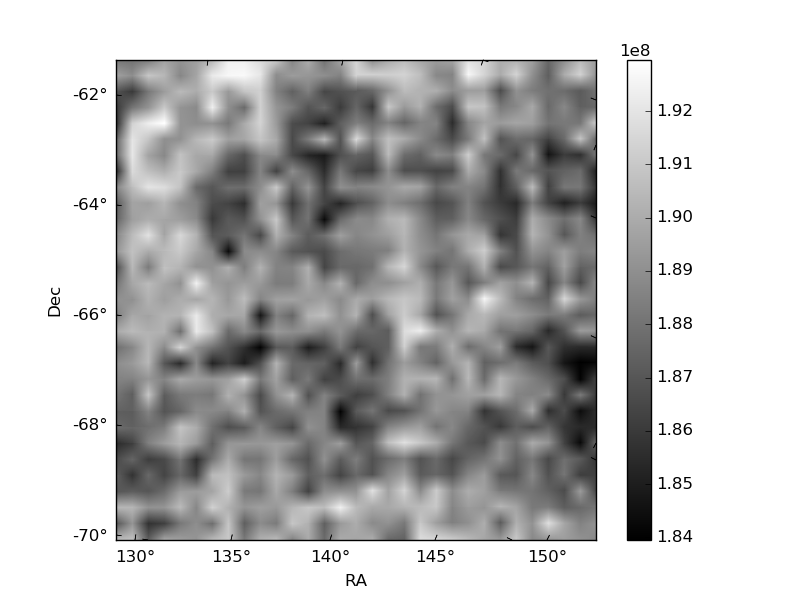
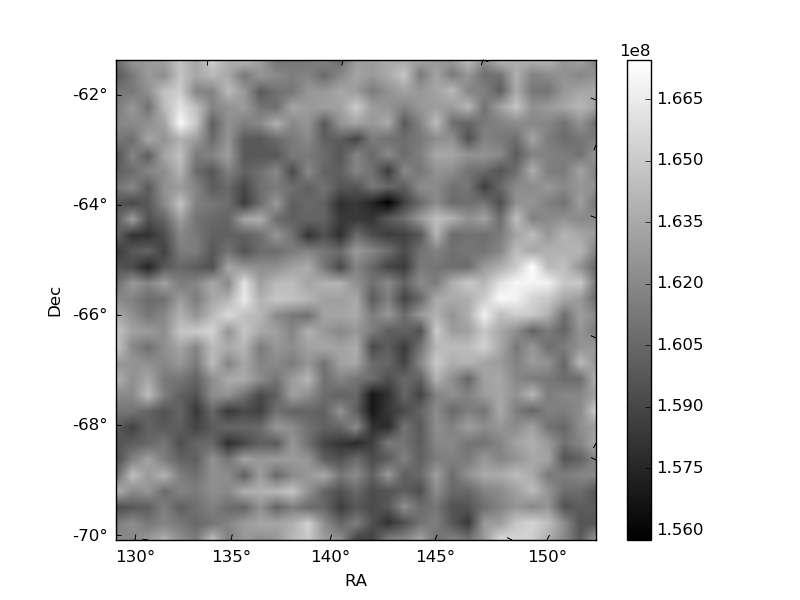
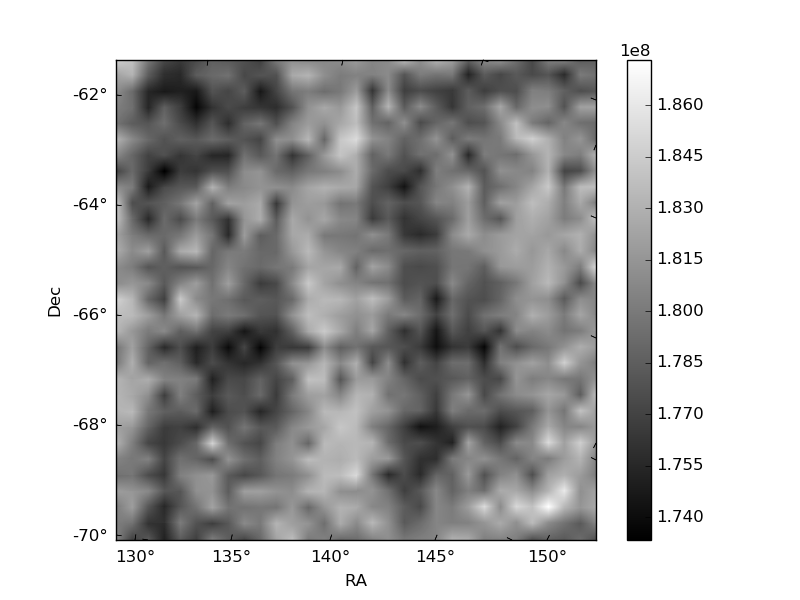
Histogram calculated using DETX and DETY for each event in the final _common_clean file
| Quadrant A | 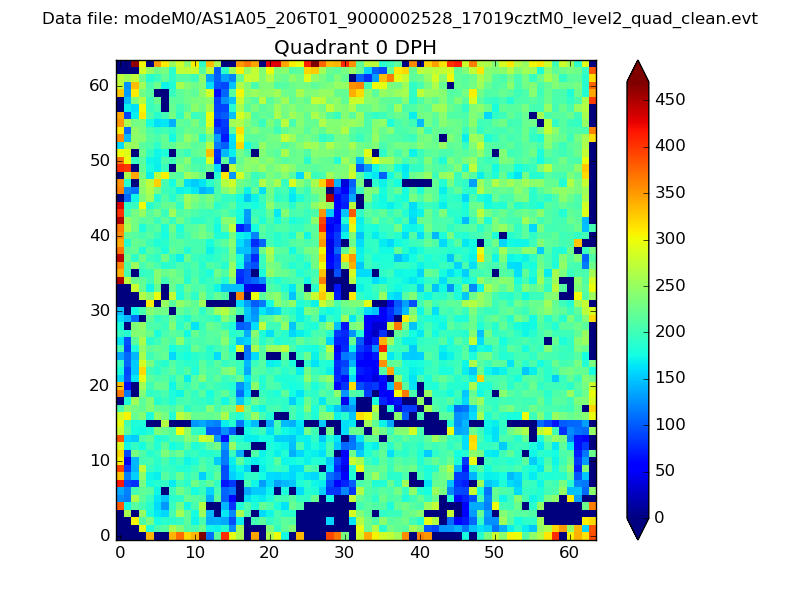 |
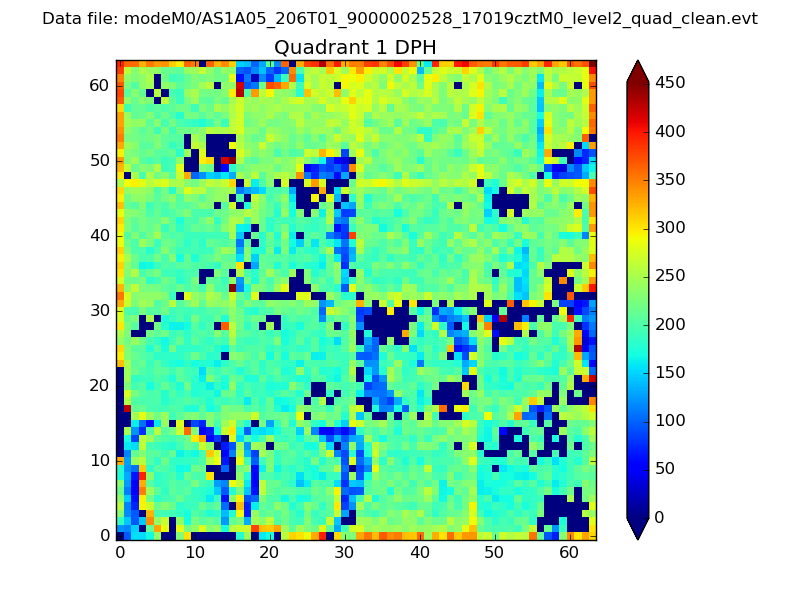 |
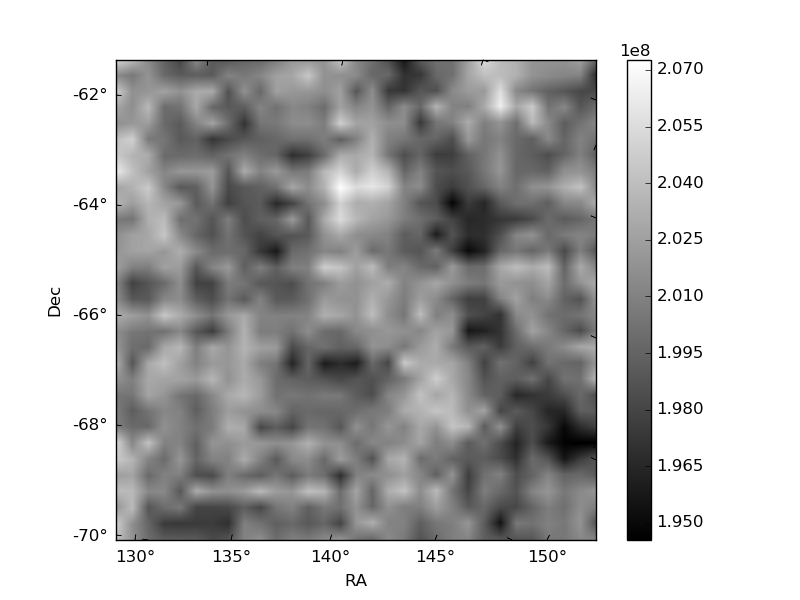
Quadrant B |
|---|---|---|---|
| Quadrant D | 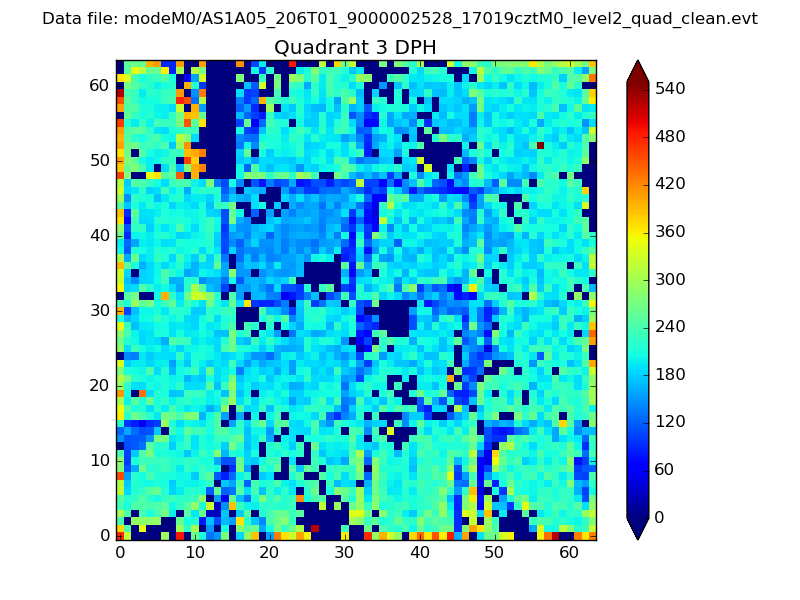 |
 |
Quadrant C |
| Plot type | Count rate plots | Images |
|---|---|---|
| Comparison with Poisson distribution Blue bars denote a histogram of data divided into 1 sec bins. Red curve is a Poisson curve with rate = median count rate of data. |
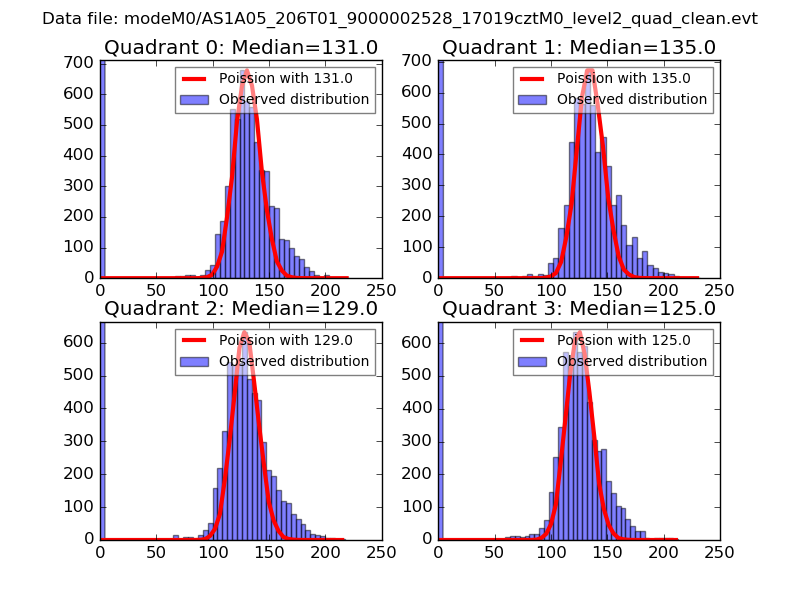 |
 |
| Quadrant-wise count rates Data is divided into 100 sec bins |
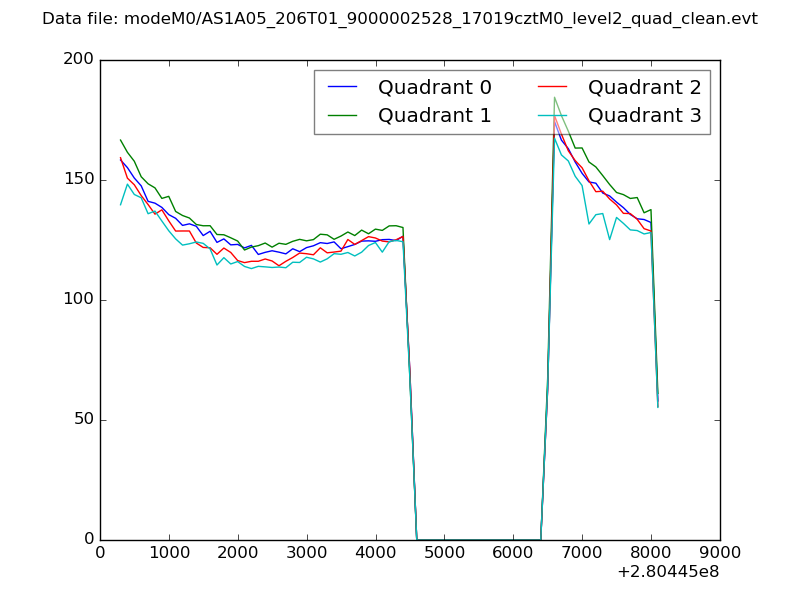 |
|
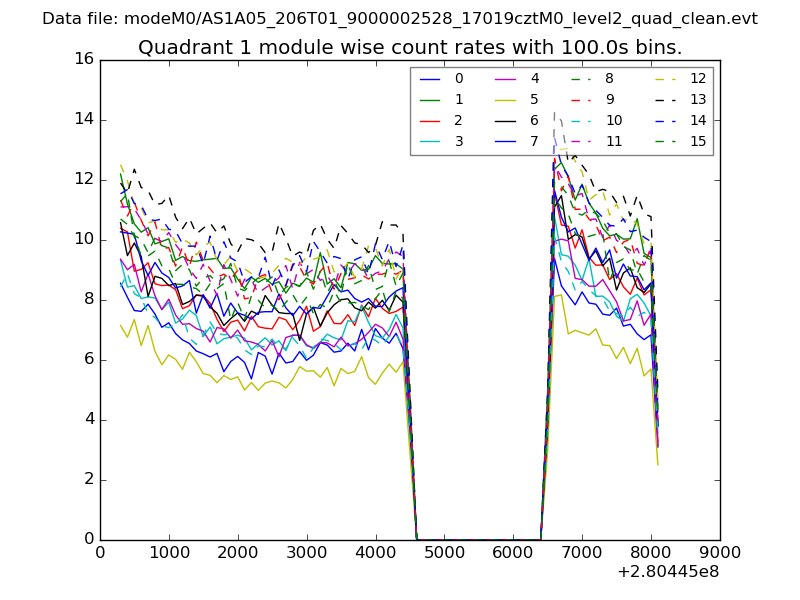
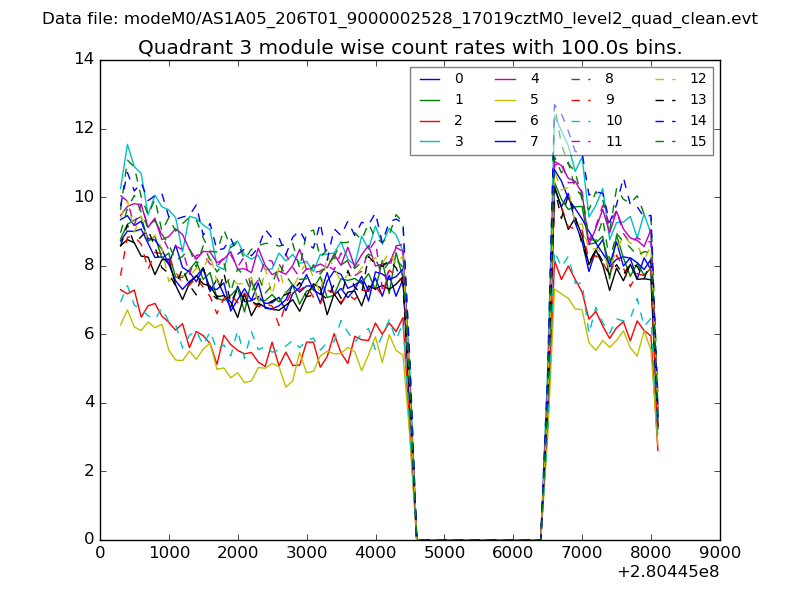
| Module-wise count rates for Quadrant A Data is divided into 100 sec bins |
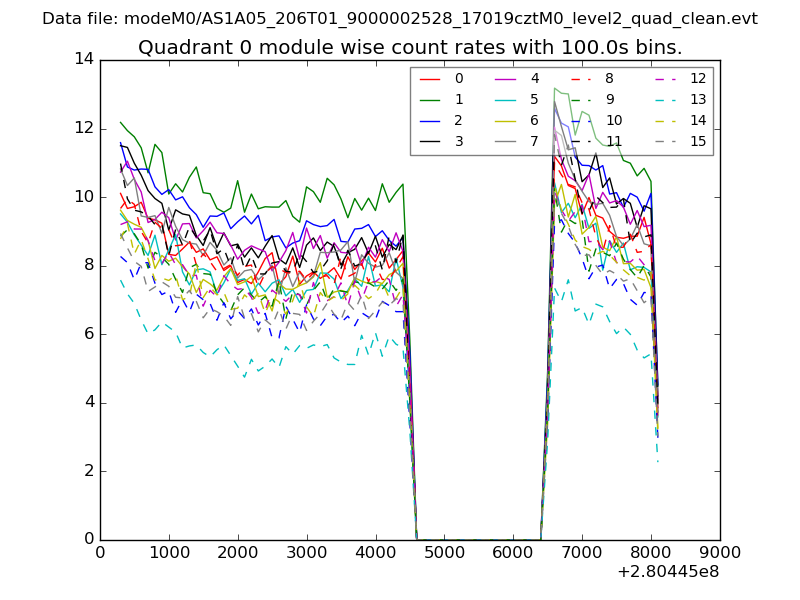 |
 |
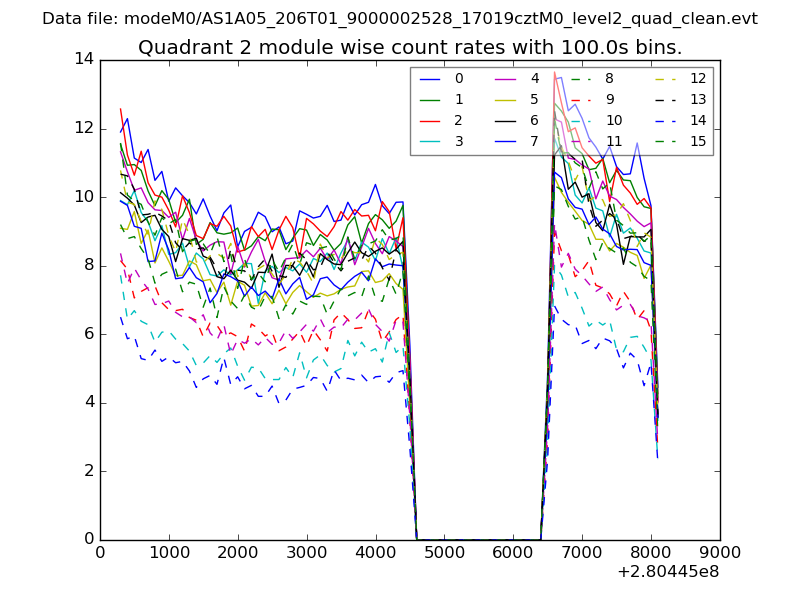
| Module-wise count rates for Quadrant B Data is divided into 100 sec bins |
 |
 |
| Module-wise count rates for Quadrant C Data is divided into 100 sec bins |
 |
 |
| Module-wise count rates for Quadrant D Data is divided into 100 sec bins |
 |
 |
| Parameter | Plot |
|---|---|
| CZT HV Monitor | 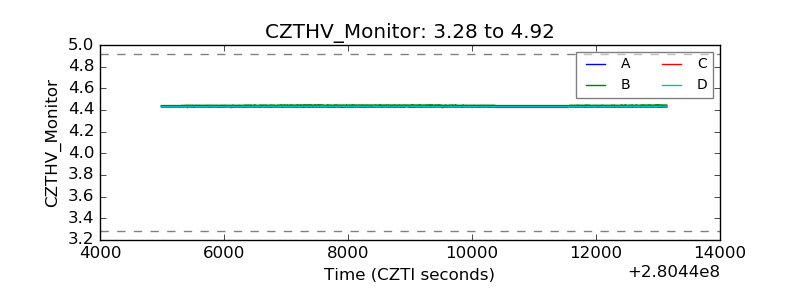 |
| D_VDD | 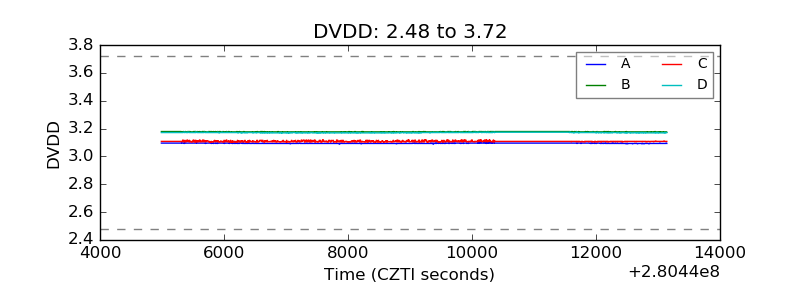 |
| Temperature 1 | 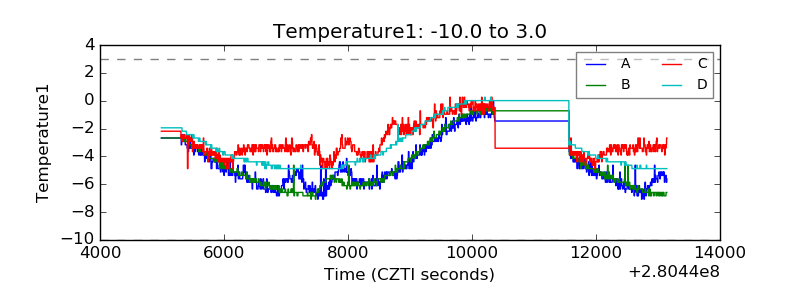 |
| Veto HV Monitor |  |
| Veto LLD | 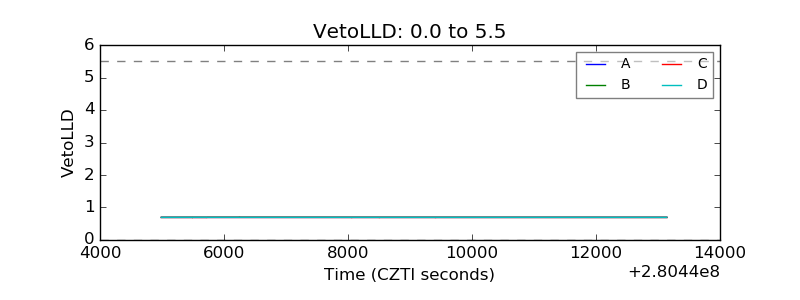 |
| Alpha Counter |  |
| _CPM_Rate | 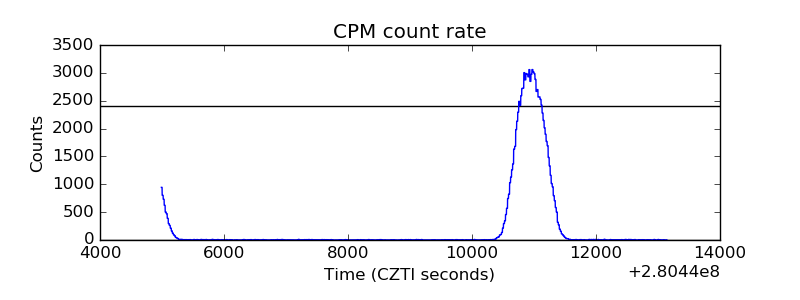 |
| CZT Counter | 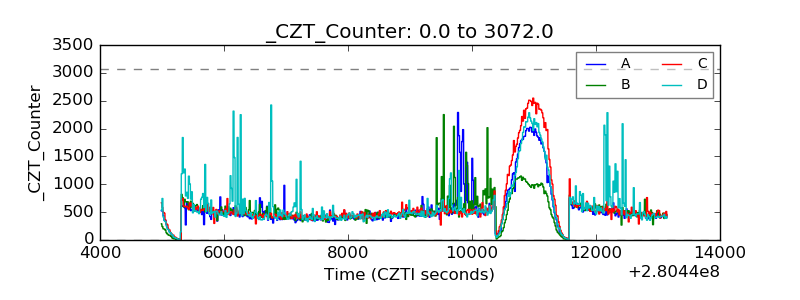 |
| +2.5 Volts monitor | 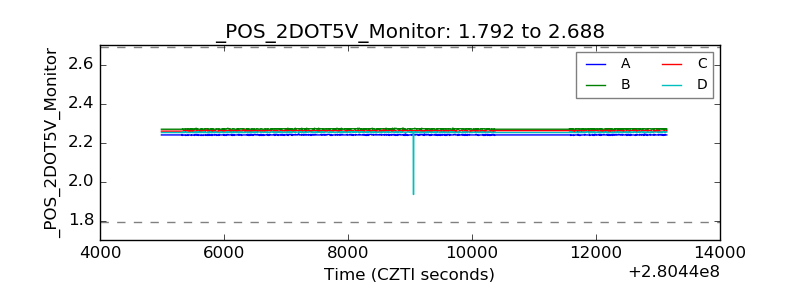 |
| +5 Volts monitor |  |
| _ROLL_ROT | 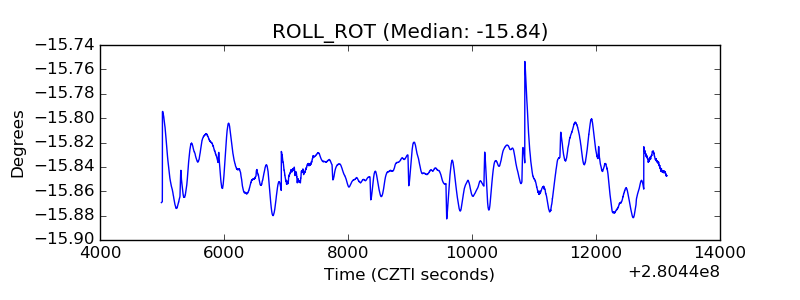 |
| _Roll_DEC | 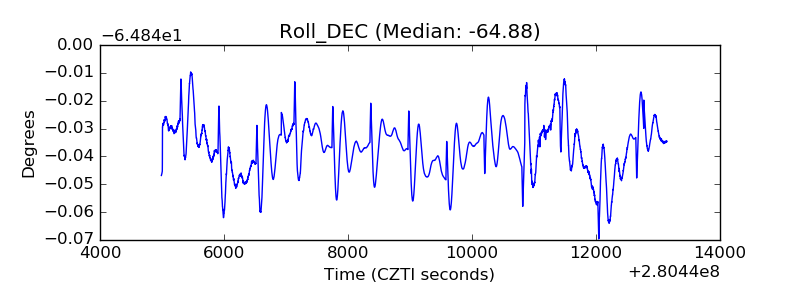 |
| _Roll_RA | 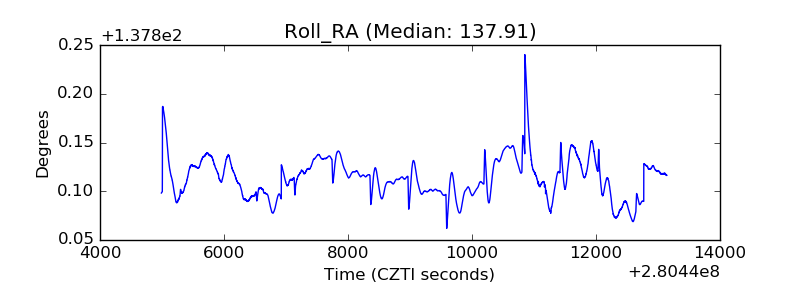 |
| Veto Counter | 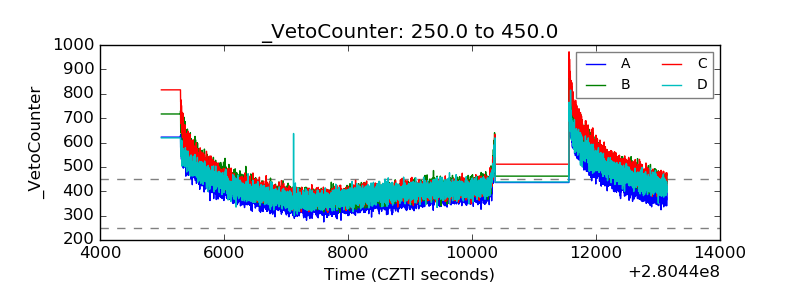 |