| Param | Original file | Final file |
|---|---|---|
| Filename | modeM0/AS1A05_206T01_9000002528_17021cztM0_level2.evt | modeM0/AS1A05_206T01_9000002528_17021cztM0_level2_quad_clean.evt |
| Size (bytes) | 506,926,080 | 119,646,720 |
| Size | 483.4 MB | 114.1 MB |
| Events in quadrant A | 4,222,389 | 772,155 |
| Events in quadrant B | 3,465,435 | 828,636 |
| Events in quadrant C | 3,352,072 | 805,496 |
| Events in quadrant D | 3,877,569 | 770,469 |
| Mode M9 | |||
|---|---|---|---|
| Quadrant | BADHDUFLAG | Total packets | Discarded packets |
| A | 0 | 21 | 0 |
| B | 0 | 22 | 0 |
| C | 0 | 22 | 0 |
| D | 0 | 22 | 0 |
| Mode SS | |||
|---|---|---|---|
| Quadrant | BADHDUFLAG | Total packets | Discarded packets |
| A | 0 | 130 | 0 |
| B | 0 | 130 | 0 |
| C | 0 | 130 | 0 |
| D | 0 | 130 | 0 |
| Mode M0 | |||
|---|---|---|---|
| Quadrant | BADHDUFLAG | Total packets | Discarded packets |
| A | 0 | 16764 | 2 |
| B | 0 | 14418 | 2 |
| C | 0 | 13740 | 2 |
| D | 0 | 15575 | 2 |
| Quadrant | Total seconds | Saturated seconds | Saturation percentage |
|---|---|---|---|
| A | 6407 | 315 | 4.916498% |
| B | 6407 | 63 | 0.983300% |
| C | 6407 | 51 | 0.796004% |
| D | 6407 | 147 | 2.294366% |
Noise dominated data is calculated using 1-second bins in cleaned event files. If a bin has >2000 counts, and if more than 50% of those come from <1% of pixels, then it is considered to be noise-dominated and hence unusable.
| Quadrant | # 1 sec bins | Bins with >0 counts | Bins with >2000 counts | High rate bins dominated by noise | Noise dominated (total time) | Noise dominated (detector-on time) | Marked lightcurve |
|---|---|---|---|---|---|---|---|
| A | 7783 | 6409 | 258 | 258 | 3.31% | 4.03% | 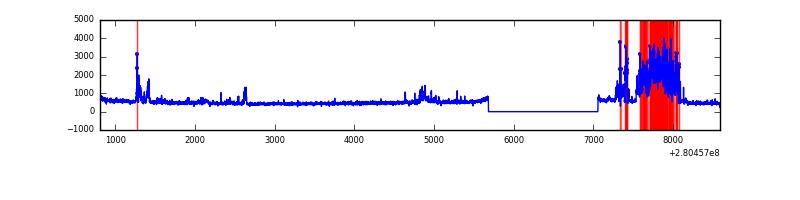 |
| B | 7783 | 6409 | 10 | 10 | 0.13% | 0.16% | 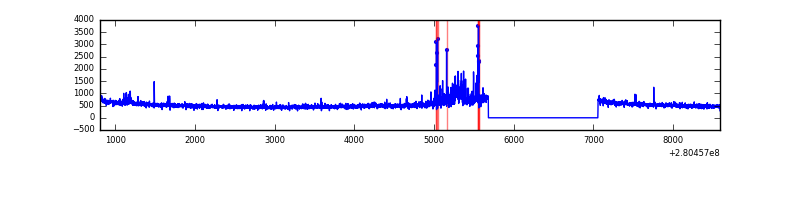 |
| C | 7783 | 6409 | 4 | 4 | 0.05% | 0.06% | 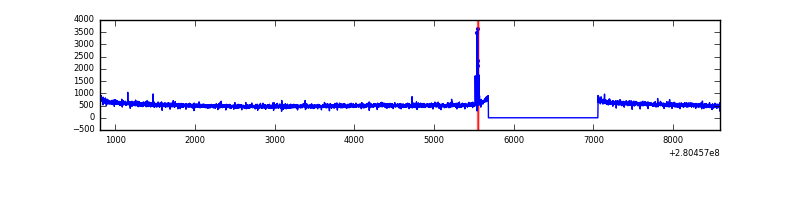 |
| D | 7783 | 6409 | 124 | 124 | 1.59% | 1.93% | 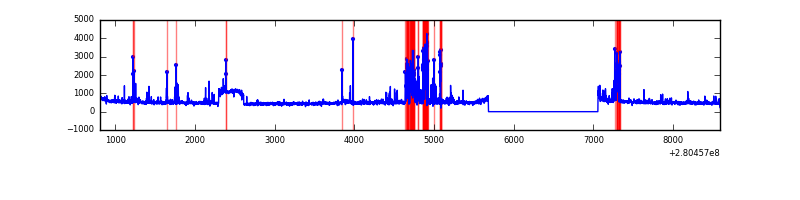 |
Top three noisy pixels from each quadrant. If the there are fewer than three noisy pixels in the level2.evt file, extra rows are filled as -1
| Pixel properties | Quadrant properties | ||||||
|---|---|---|---|---|---|---|---|
| Quadrant | DetID | PixID | Counts | Sigma | Mean | Median | Sigma |
| A | 15 | 174 | 1120533 | 7041.88 | 796 | 780 | 159.0 |
| A | 12 | 189 | 38818 | 239.21 | 796 | 780 | 159.0 |
| A | 0 | 226 | 7109 | 39.8 | 796 | 780 | 159.0 |
| B | 7 | 220 | 139162 | 918.64 | 823 | 802 | 150.6 |
| B | 4 | 216 | 51466 | 336.38 | 823 | 802 | 150.6 |
| B | 0 | 219 | 45866 | 299.2 | 823 | 802 | 150.6 |
| C | 14 | 238 | 127152 | 677.76 | 810 | 816 | 186.4 |
| C | 3 | 233 | 42691 | 224.65 | 810 | 816 | 186.4 |
| C | 0 | 207 | 20856 | 107.51 | 810 | 816 | 186.4 |
| D | 1 | 52 | 532405 | 2766.77 | 798 | 775 | 192.1 |
| D | 15 | 0 | 299721 | 1555.81 | 798 | 775 | 192.1 |
| D | 2 | 234 | 26345 | 133.07 | 798 | 775 | 192.1 |
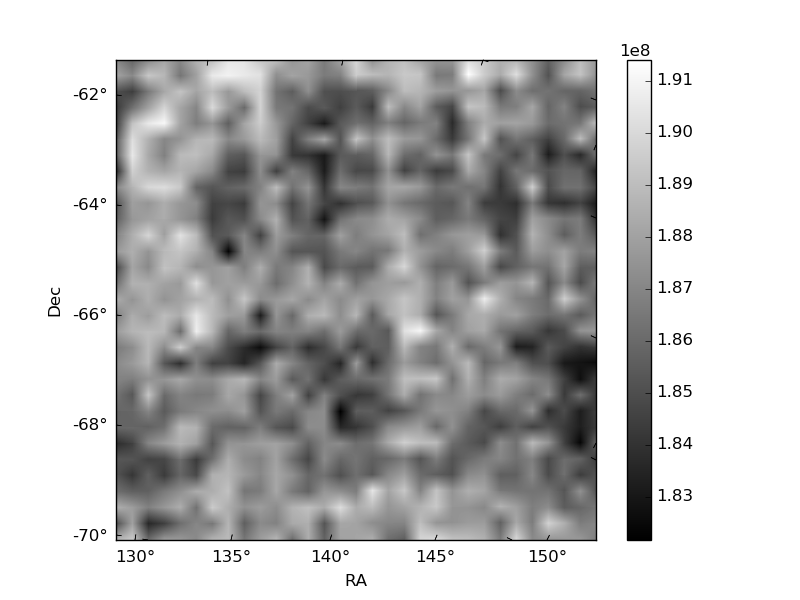
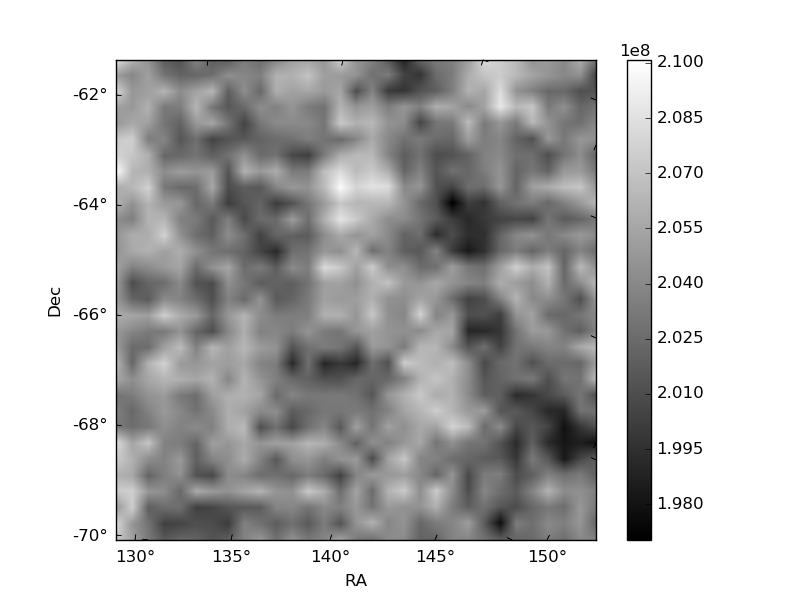
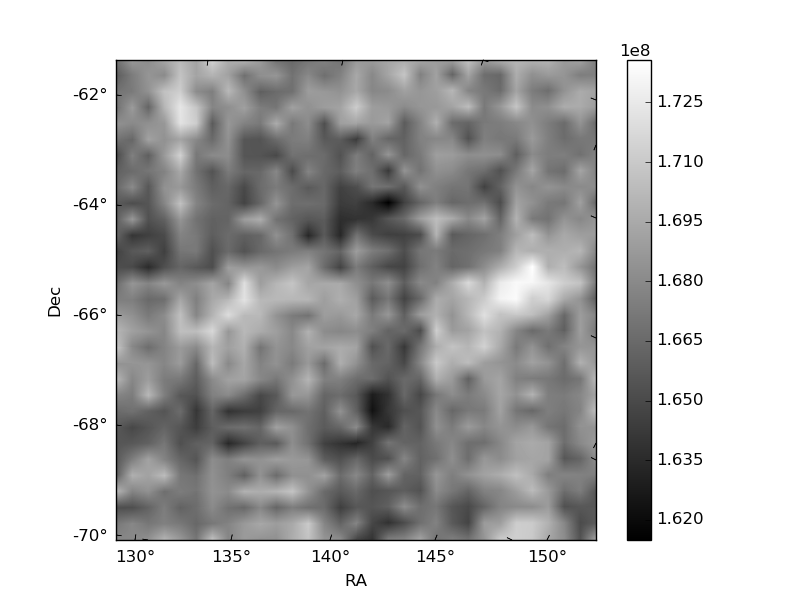
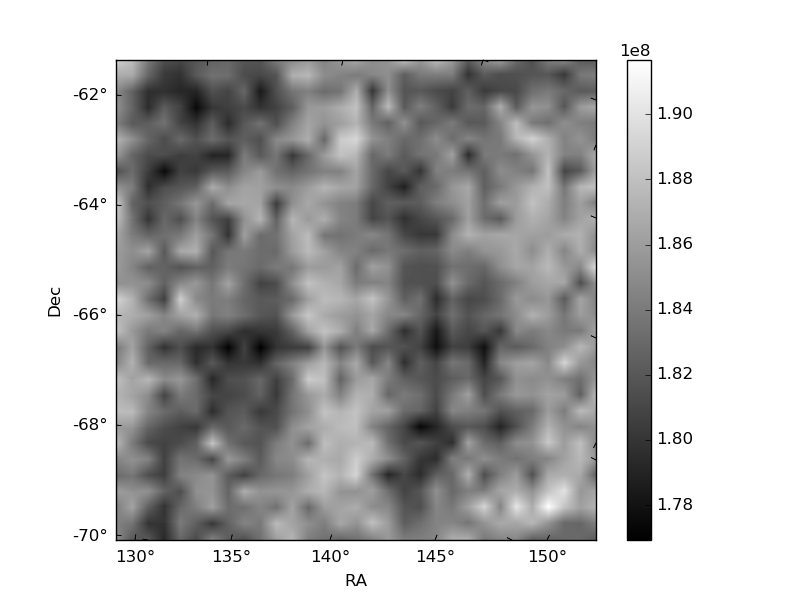
Histogram calculated using DETX and DETY for each event in the final _common_clean file
| Quadrant A | 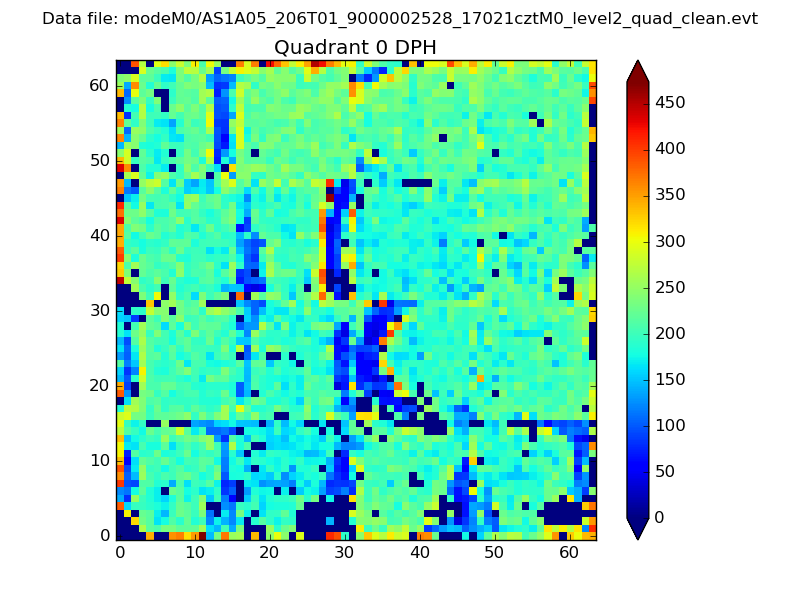 |
 |
Quadrant B |
|---|---|---|---|
| Quadrant D |  |
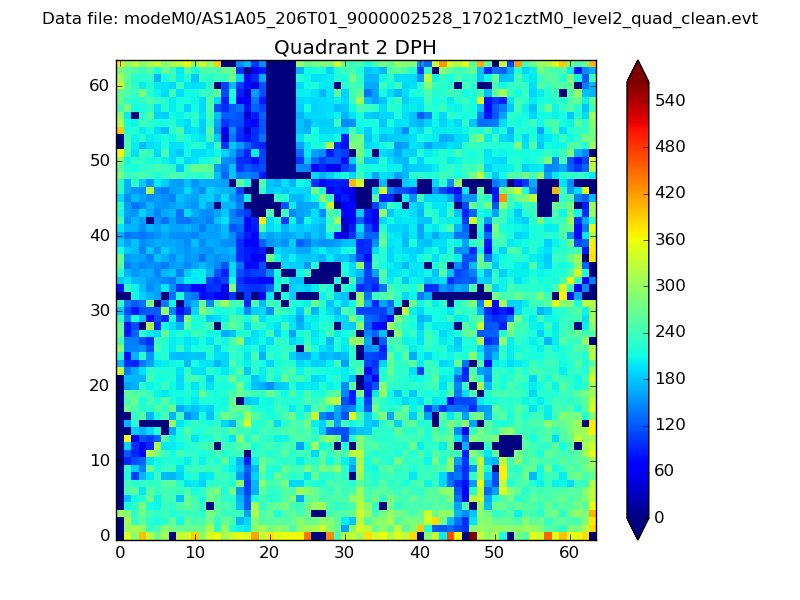 |
Quadrant C |
| Plot type | Count rate plots | Images |
|---|---|---|
| Comparison with Poisson distribution Blue bars denote a histogram of data divided into 1 sec bins. Red curve is a Poisson curve with rate = median count rate of data. |
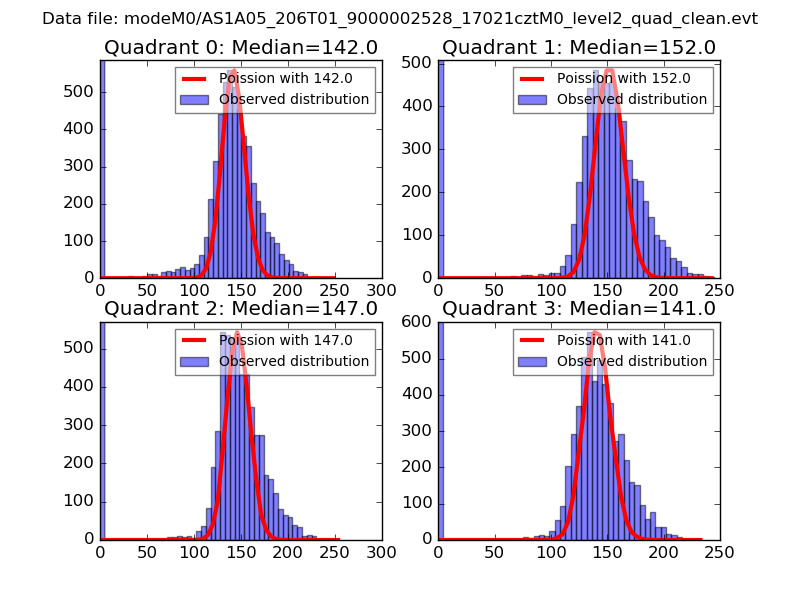 |
 |
| Quadrant-wise count rates Data is divided into 100 sec bins |
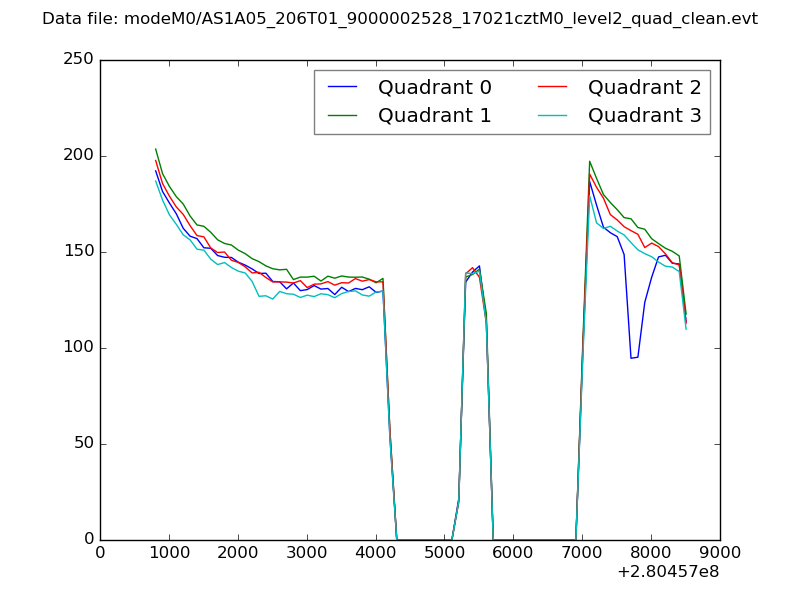 |
|
| Module-wise count rates for Quadrant A Data is divided into 100 sec bins |
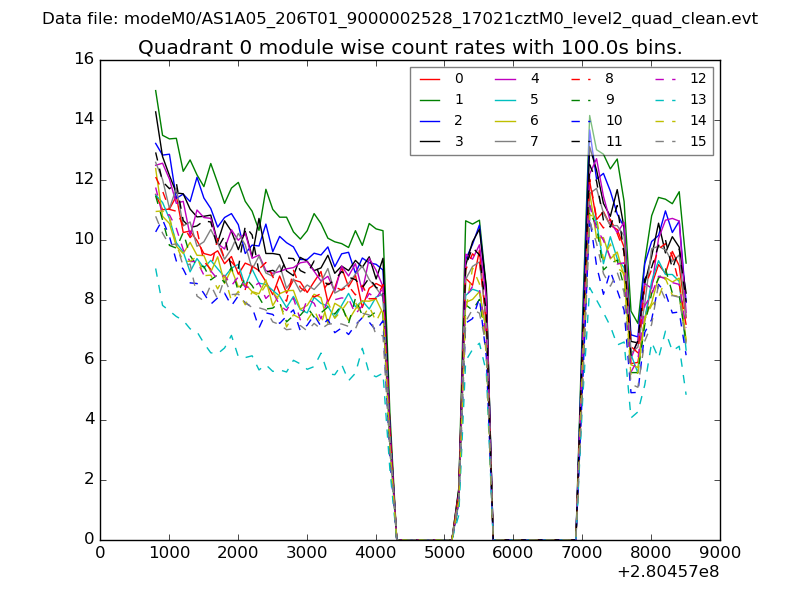 |
 |
| Module-wise count rates for Quadrant B Data is divided into 100 sec bins |
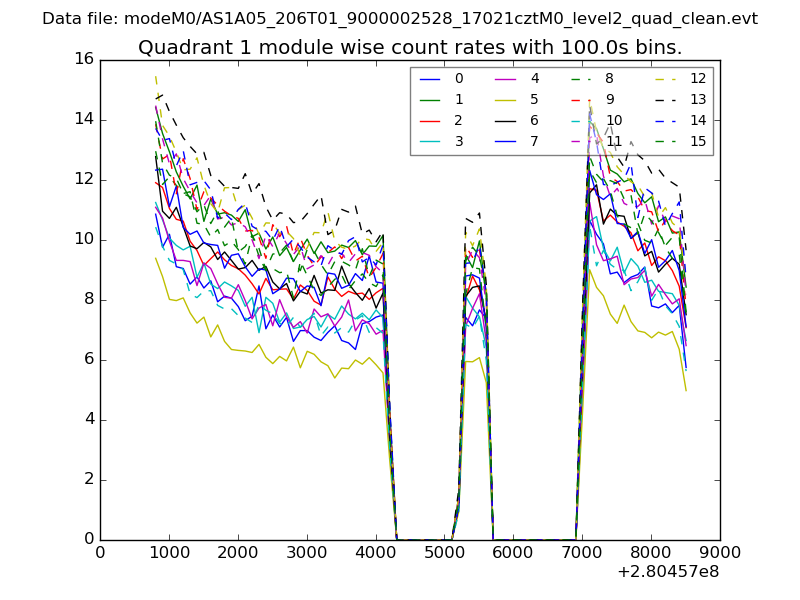 |
 |
| Module-wise count rates for Quadrant C Data is divided into 100 sec bins |
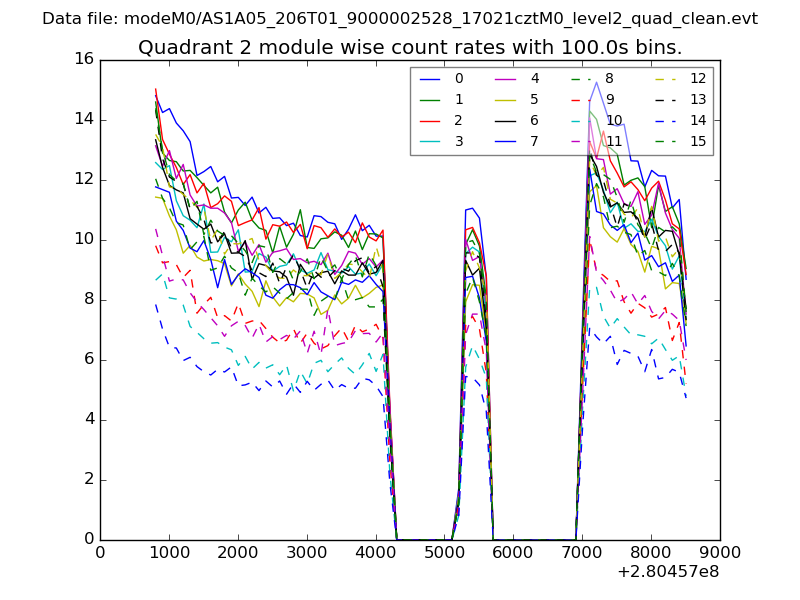 |
 |
| Module-wise count rates for Quadrant D Data is divided into 100 sec bins |
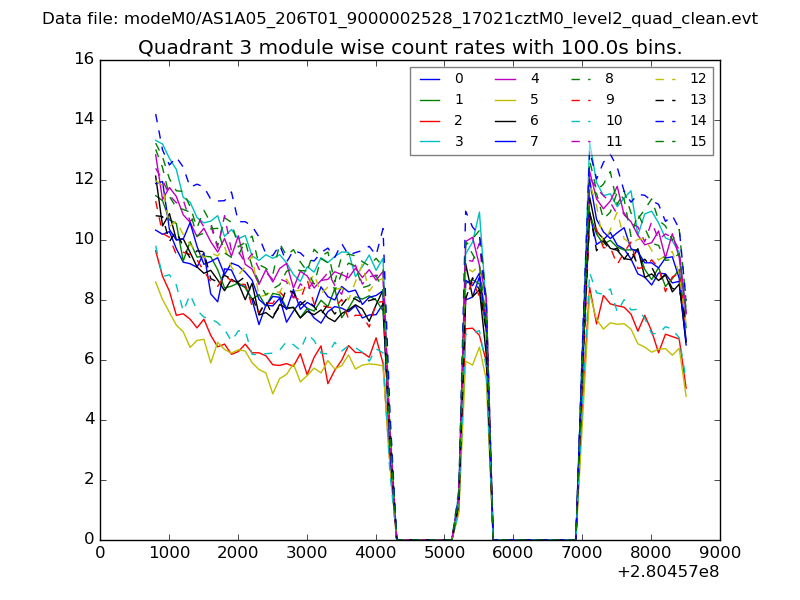 |
 |
| Parameter | Plot |
|---|---|
| CZT HV Monitor | 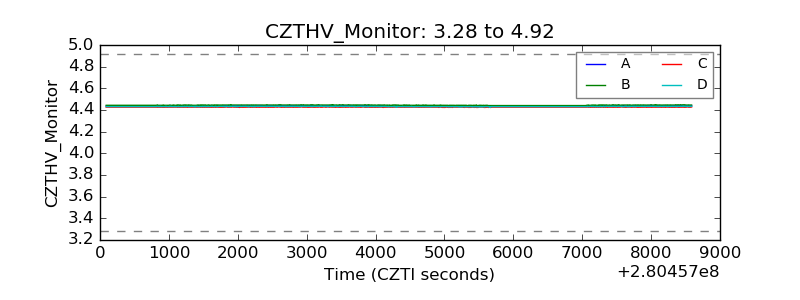 |
| D_VDD | 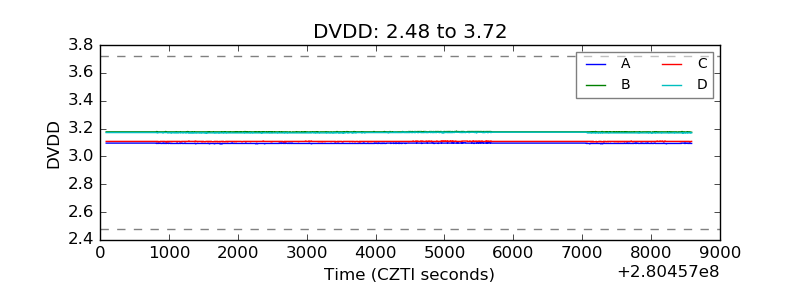 |
| Temperature 1 | 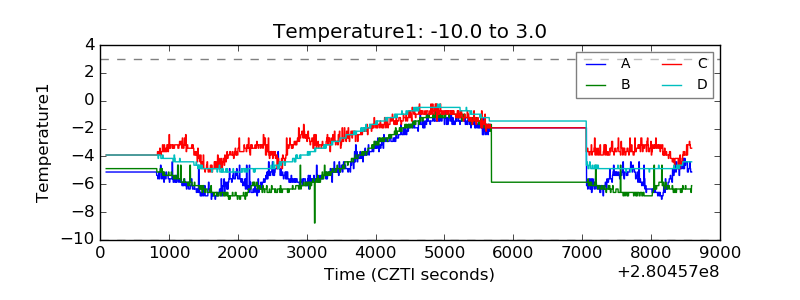 |
| Veto HV Monitor | 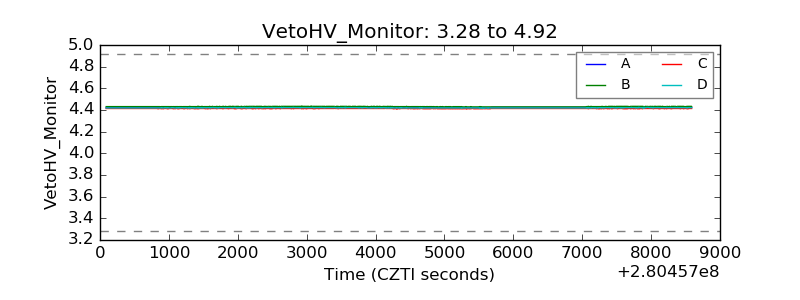 |
| Veto LLD | 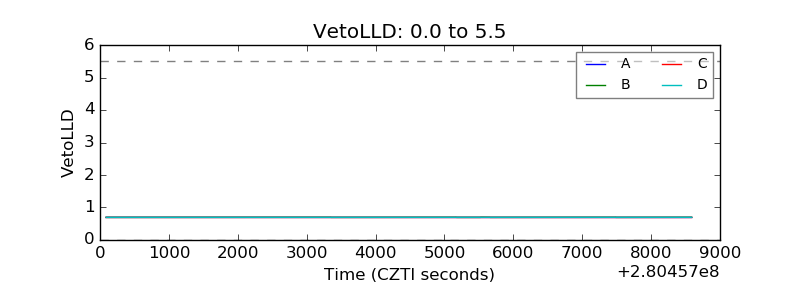 |
| Alpha Counter | 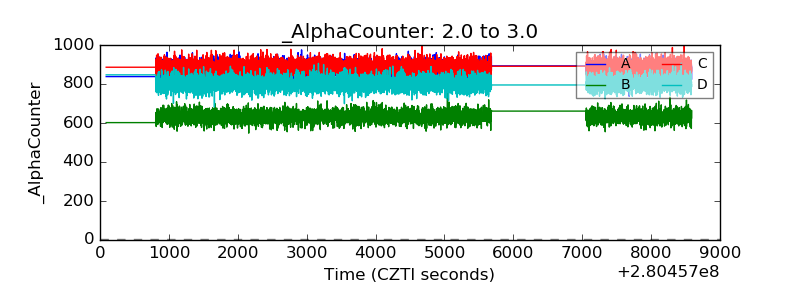 |
| _CPM_Rate | 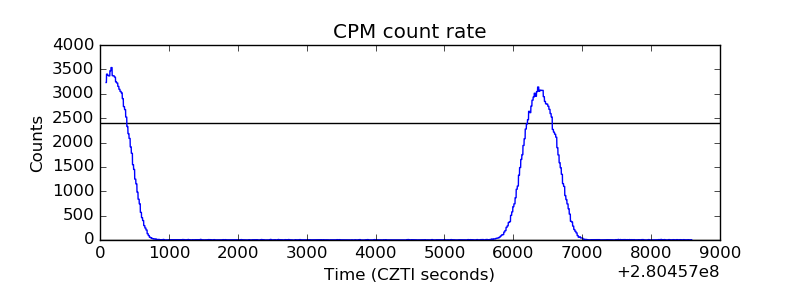 |
| CZT Counter | 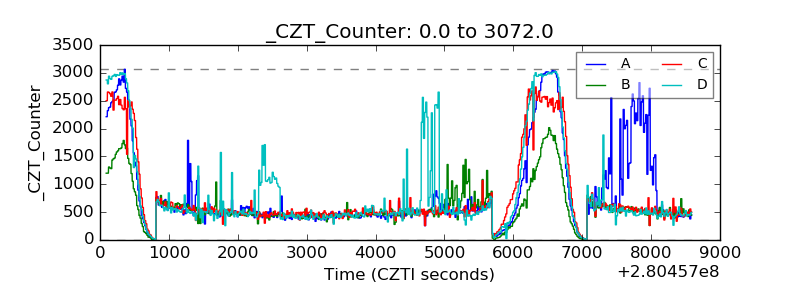 |
| +2.5 Volts monitor |  |
| +5 Volts monitor | 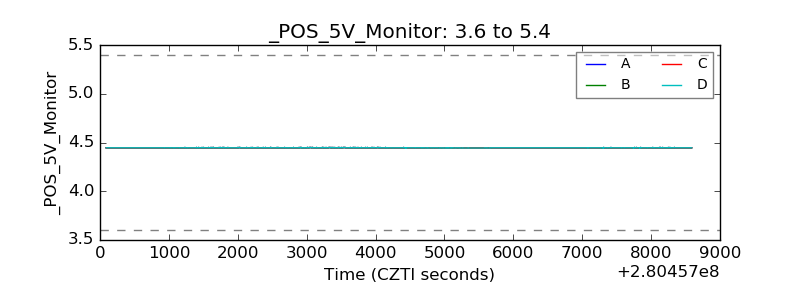 |
| _ROLL_ROT | 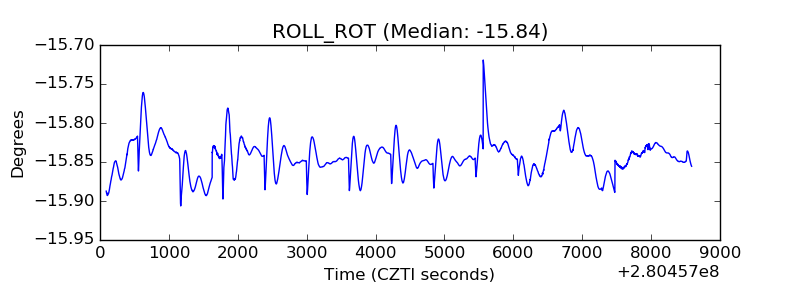 |
| _Roll_DEC | 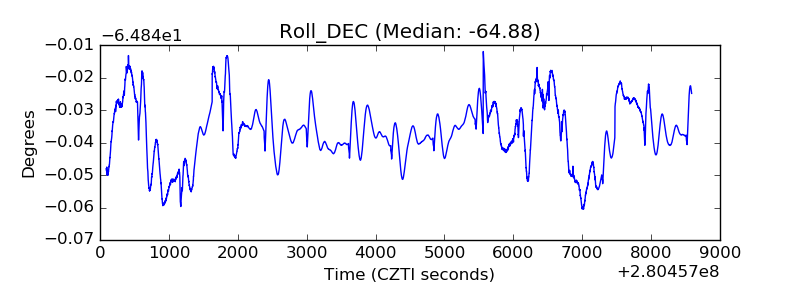 |
| _Roll_RA | 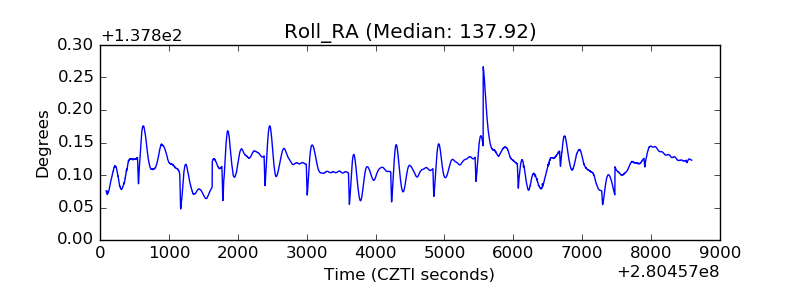 |
| Veto Counter | 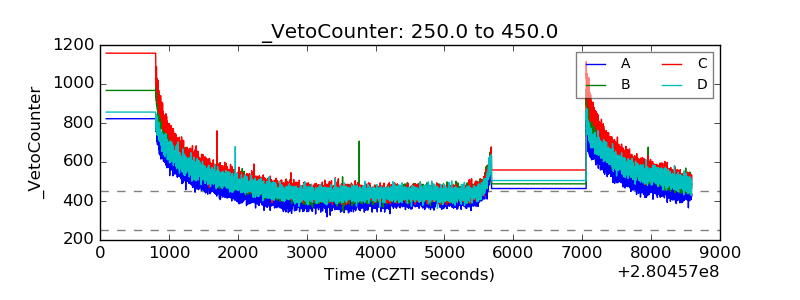 |