| Param | Original file | Final file |
|---|---|---|
| Filename | modeM0/AS1A05_206T01_9000002528_17022cztM0_level2.evt | modeM0/AS1A05_206T01_9000002528_17022cztM0_level2_quad_clean.evt |
| Size (bytes) | 515,142,720 | 118,431,360 |
| Size | 491.3 MB | 112.9 MB |
| Events in quadrant A | 4,542,994 | 767,010 |
| Events in quadrant B | 3,477,437 | 814,484 |
| Events in quadrant C | 3,327,164 | 797,110 |
| Events in quadrant D | 3,821,690 | 764,296 |
| Mode M9 | |||
|---|---|---|---|
| Quadrant | BADHDUFLAG | Total packets | Discarded packets |
| A | 0 | 14 | 0 |
| B | 0 | 15 | 0 |
| C | 0 | 15 | 0 |
| D | 0 | 15 | 0 |
| Mode SS | |||
|---|---|---|---|
| Quadrant | BADHDUFLAG | Total packets | Discarded packets |
| A | 0 | 130 | 0 |
| B | 0 | 130 | 0 |
| C | 0 | 130 | 0 |
| D | 0 | 130 | 0 |
| Mode M0 | |||
|---|---|---|---|
| Quadrant | BADHDUFLAG | Total packets | Discarded packets |
| A | 0 | 17600 | 2 |
| B | 0 | 14352 | 3 |
| C | 0 | 13550 | 2 |
| D | 0 | 15349 | 2 |
| Quadrant | Total seconds | Saturated seconds | Saturation percentage |
|---|---|---|---|
| A | 6361 | 506 | 7.954724% |
| B | 6360 | 80 | 1.257862% |
| C | 6360 | 71 | 1.116352% |
| D | 6360 | 145 | 2.279874% |
Noise dominated data is calculated using 1-second bins in cleaned event files. If a bin has >2000 counts, and if more than 50% of those come from <1% of pixels, then it is considered to be noise-dominated and hence unusable.
| Quadrant | # 1 sec bins | Bins with >0 counts | Bins with >2000 counts | High rate bins dominated by noise | Noise dominated (total time) | Noise dominated (detector-on time) | Marked lightcurve |
|---|---|---|---|---|---|---|---|
| A | 7712 | 6363 | 422 | 422 | 5.47% | 6.63% | 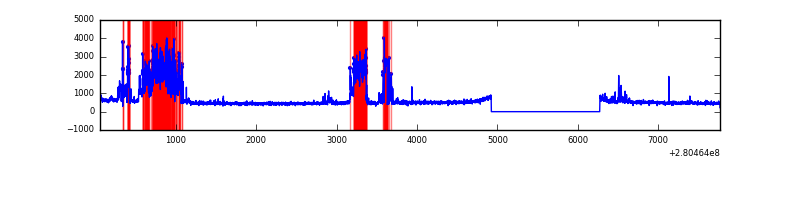 |
| B | 7711 | 6362 | 11 | 11 | 0.14% | 0.17% | 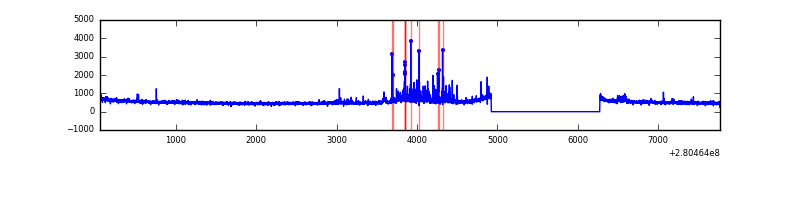 |
| C | 7711 | 6362 | 0 | 0 | 0.00% | 0.00% | 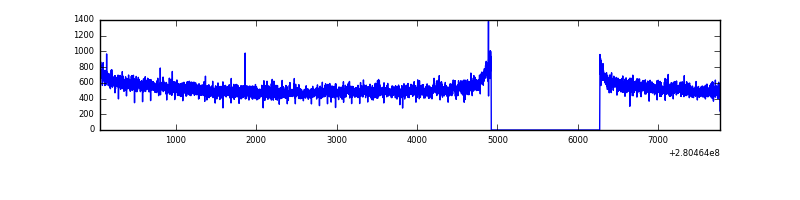 |
| D | 7711 | 6362 | 51 | 51 | 0.66% | 0.80% | 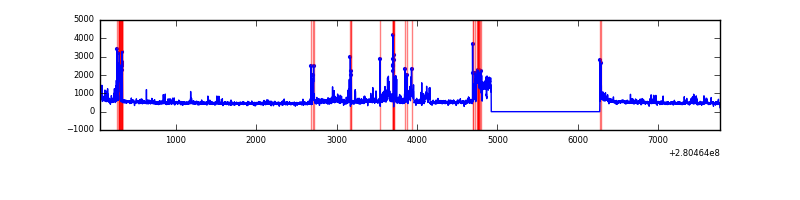 |
Top three noisy pixels from each quadrant. If the there are fewer than three noisy pixels in the level2.evt file, extra rows are filled as -1
| Pixel properties | Quadrant properties | ||||||
|---|---|---|---|---|---|---|---|
| Quadrant | DetID | PixID | Counts | Sigma | Mean | Median | Sigma |
| A | 15 | 174 | 1507226 | 9587.86 | 786 | 770 | 157.1 |
| A | 4 | 2 | 13883 | 83.46 | 786 | 770 | 157.1 |
| A | 0 | 226 | 7014 | 39.74 | 786 | 770 | 157.1 |
| B | 7 | 220 | 161369 | 1081.18 | 816 | 796 | 148.5 |
| B | 4 | 216 | 35265 | 232.09 | 816 | 796 | 148.5 |
| B | 0 | 219 | 21807 | 141.47 | 816 | 796 | 148.5 |
| C | 14 | 238 | 125855 | 672.87 | 808 | 815 | 185.8 |
| C | 3 | 233 | 45730 | 241.7 | 808 | 815 | 185.8 |
| C | 13 | 61 | 5697 | 26.27 | 808 | 815 | 185.8 |
| D | 5 | 222 | 347487 | 1803.9 | 802 | 780 | 192.2 |
| D | 1 | 52 | 265036 | 1374.91 | 802 | 780 | 192.2 |
| D | 15 | 0 | 80251 | 413.48 | 802 | 780 | 192.2 |
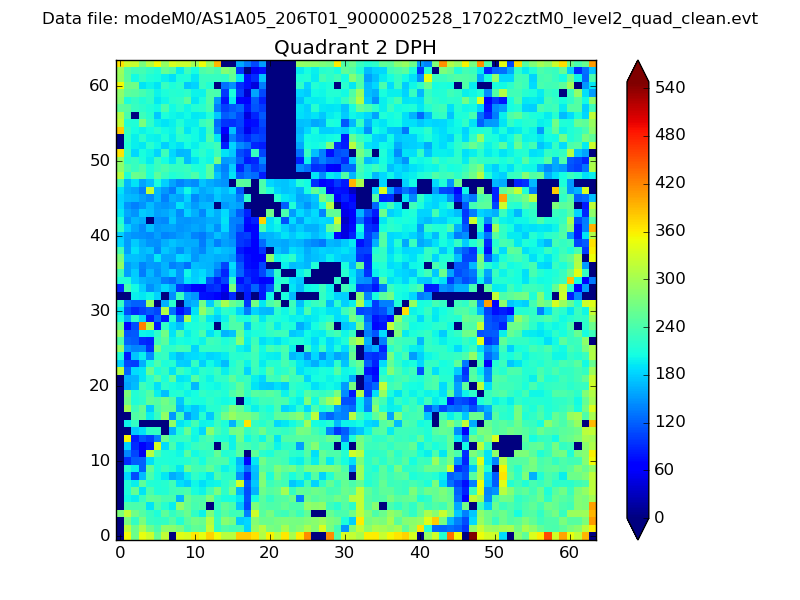
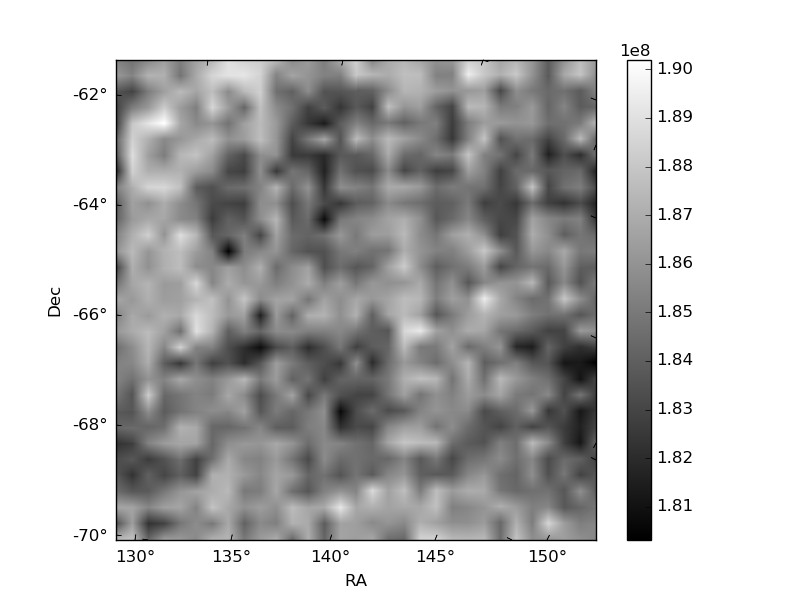
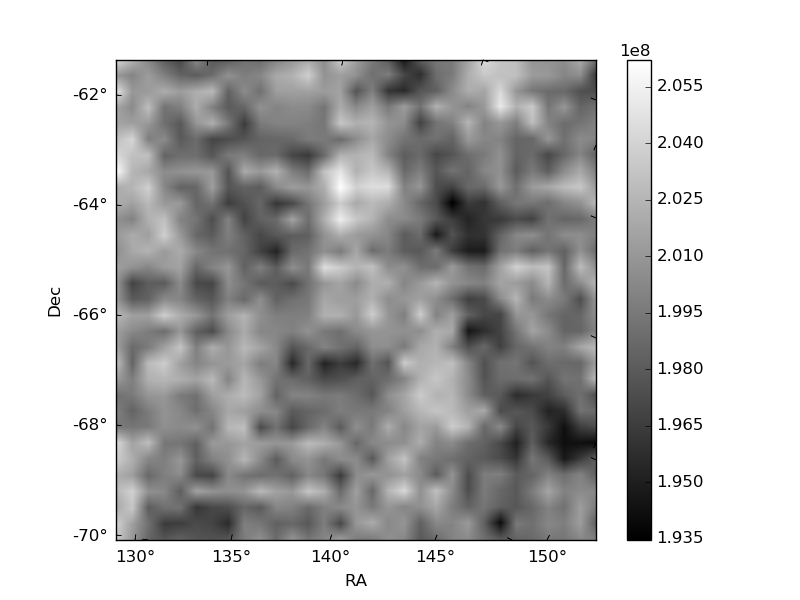
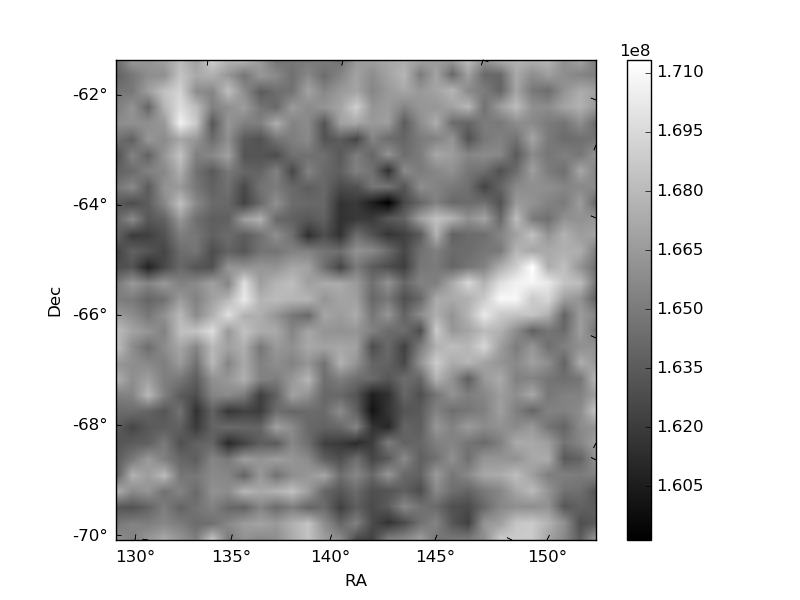
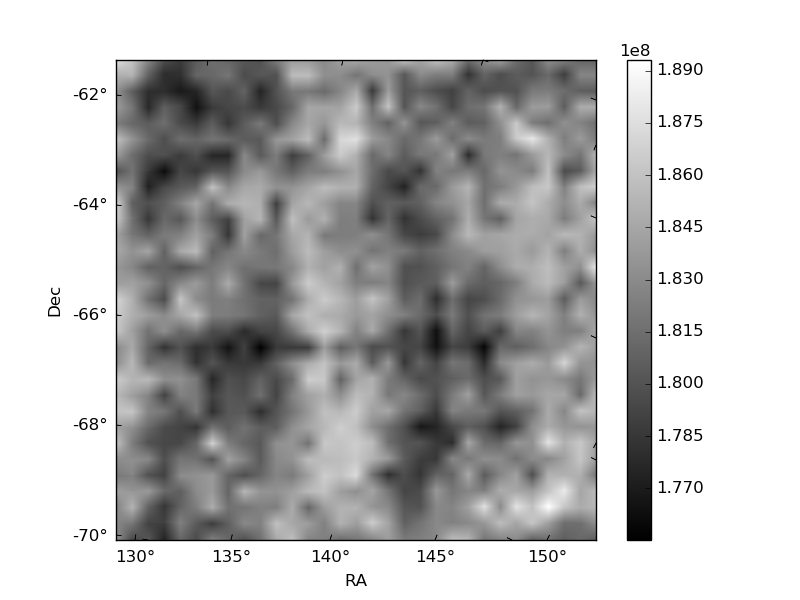
Histogram calculated using DETX and DETY for each event in the final _common_clean file
| Quadrant A | 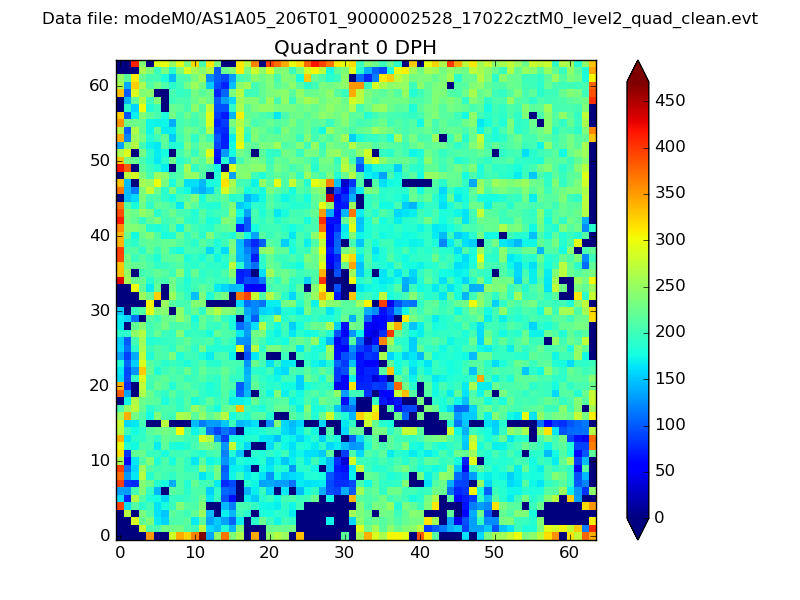 |
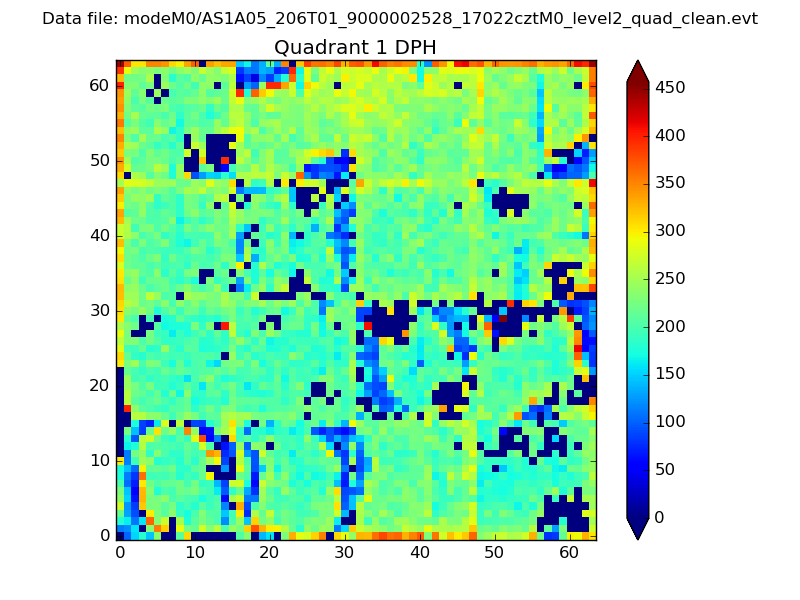 |
Quadrant B |
|---|---|---|---|
| Quadrant D | 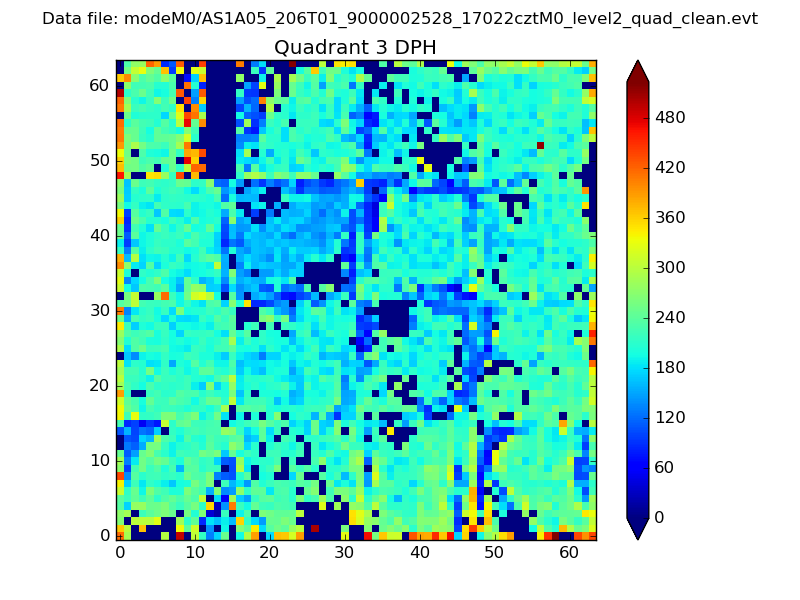 |
 |
Quadrant C |
| Plot type | Count rate plots | Images |
|---|---|---|
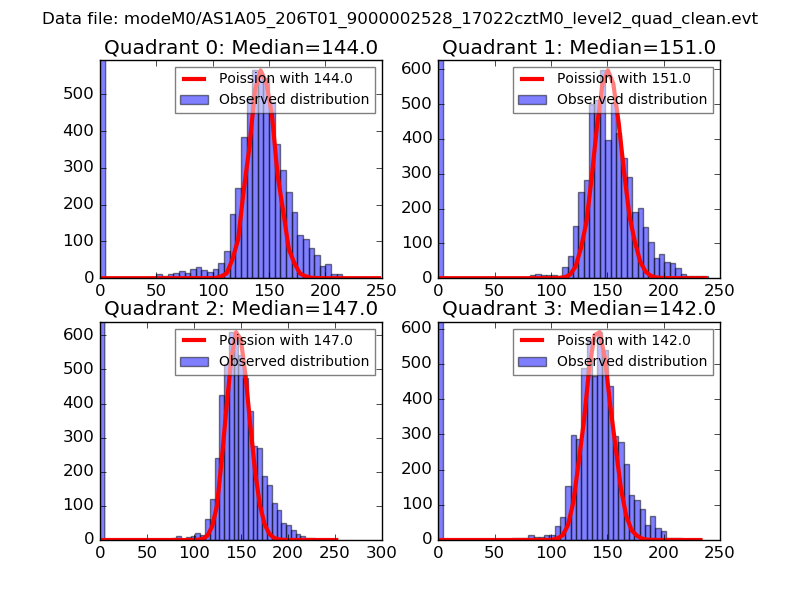
| Comparison with Poisson distribution Blue bars denote a histogram of data divided into 1 sec bins. Red curve is a Poisson curve with rate = median count rate of data. |
 |
 |
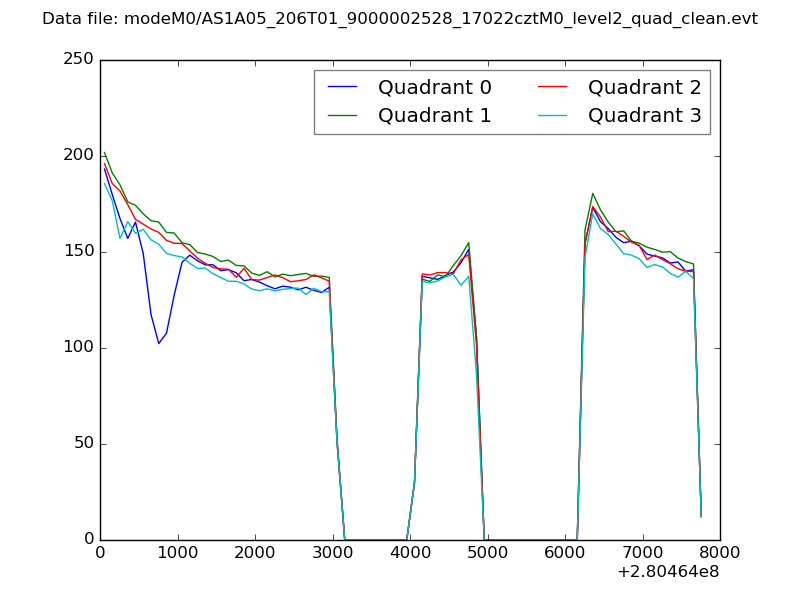
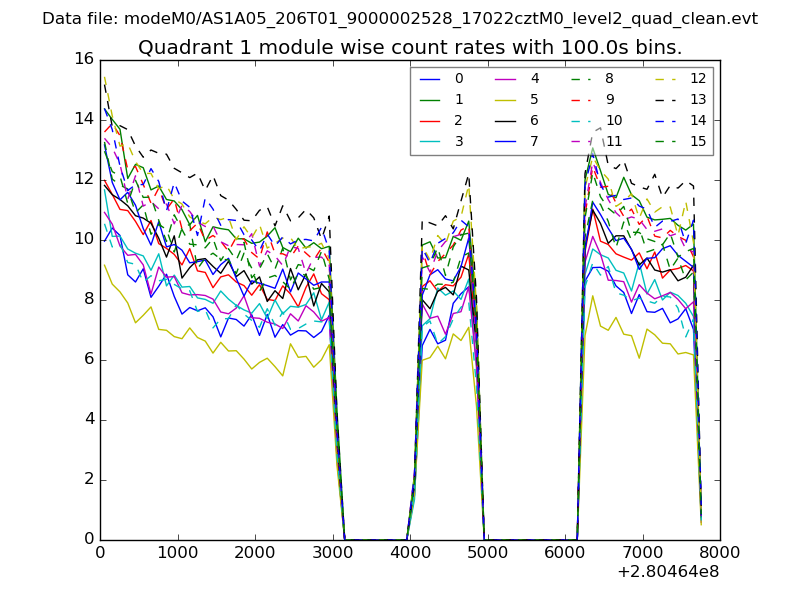
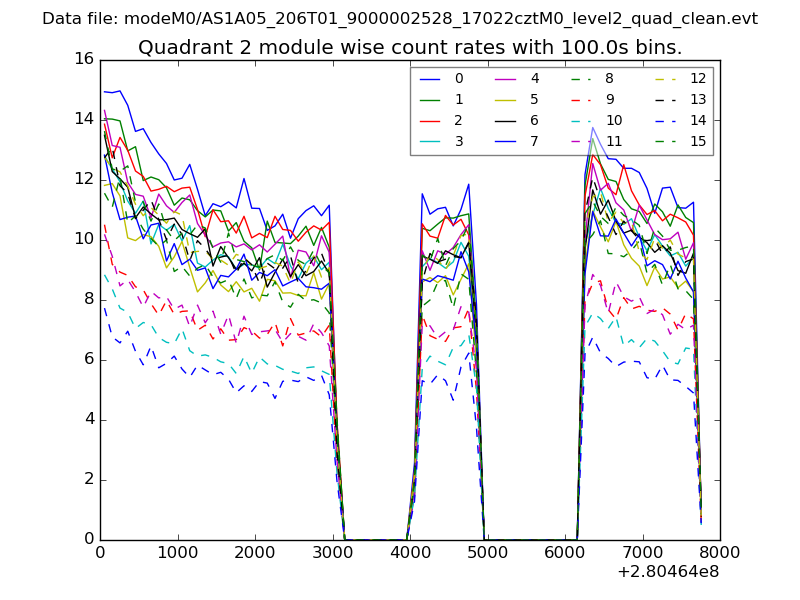
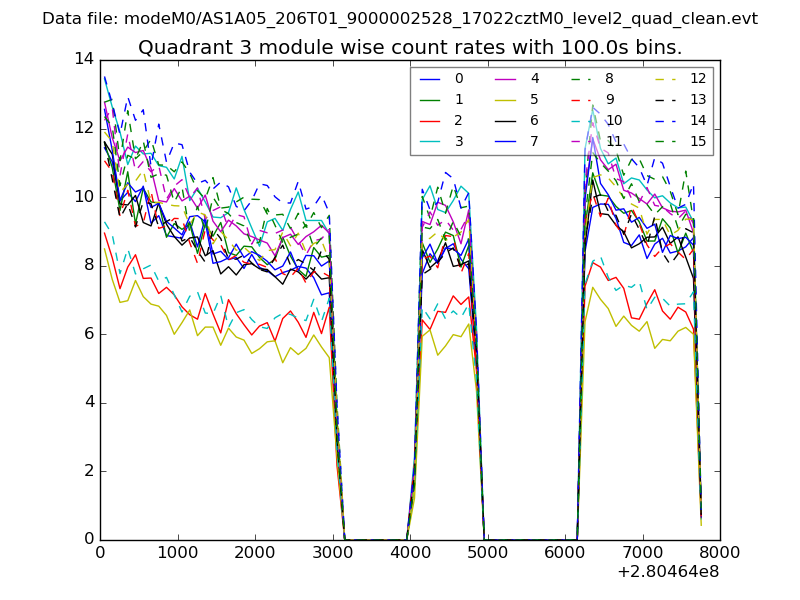
| Quadrant-wise count rates Data is divided into 100 sec bins |
 |
|
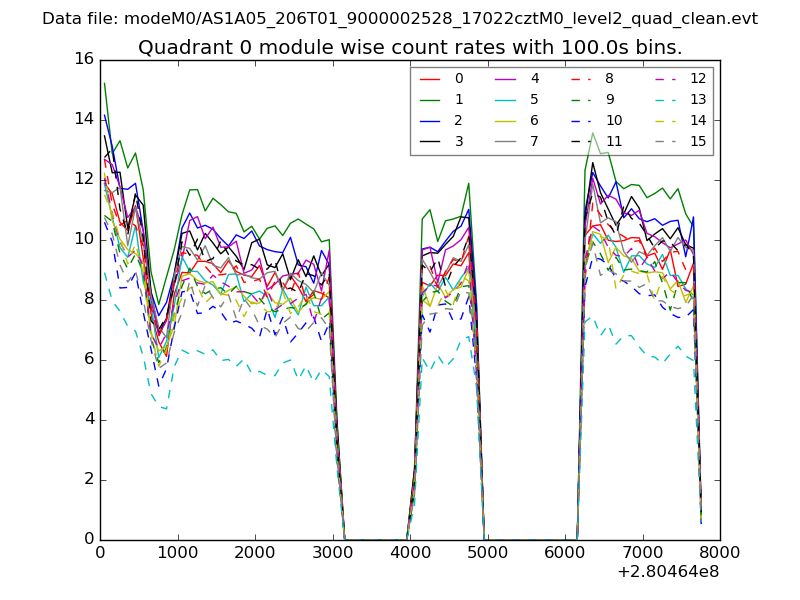
| Module-wise count rates for Quadrant A Data is divided into 100 sec bins |
 |
 |
| Module-wise count rates for Quadrant B Data is divided into 100 sec bins |
 |
 |
| Module-wise count rates for Quadrant C Data is divided into 100 sec bins |
 |
 |
| Module-wise count rates for Quadrant D Data is divided into 100 sec bins |
 |
 |
| Parameter | Plot |
|---|---|
| CZT HV Monitor |  |
| D_VDD | 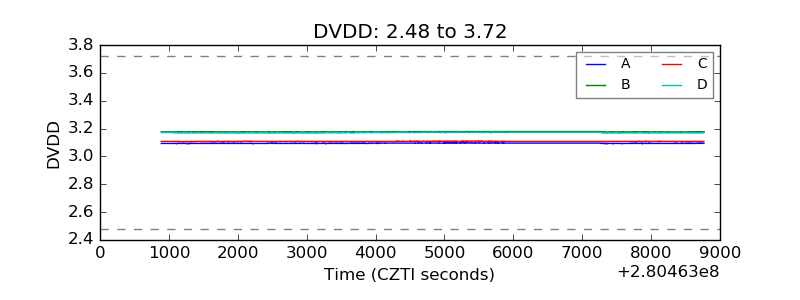 |
| Temperature 1 | 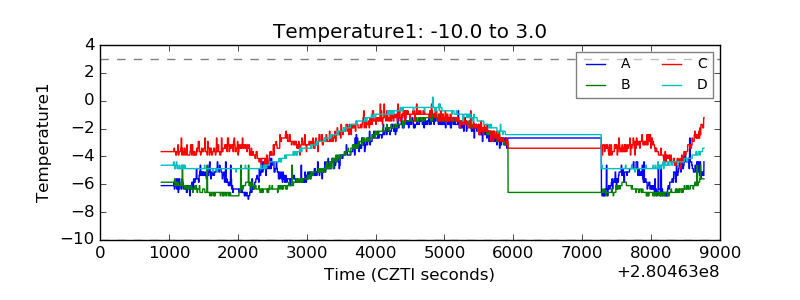 |
| Veto HV Monitor | 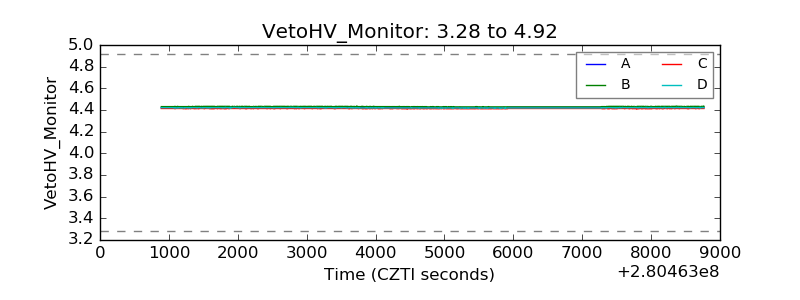 |
| Veto LLD | 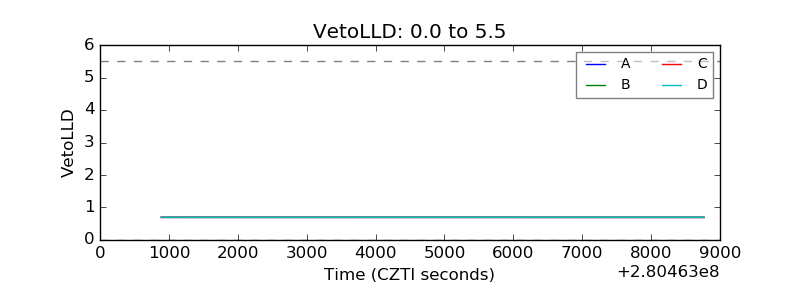 |
| Alpha Counter | 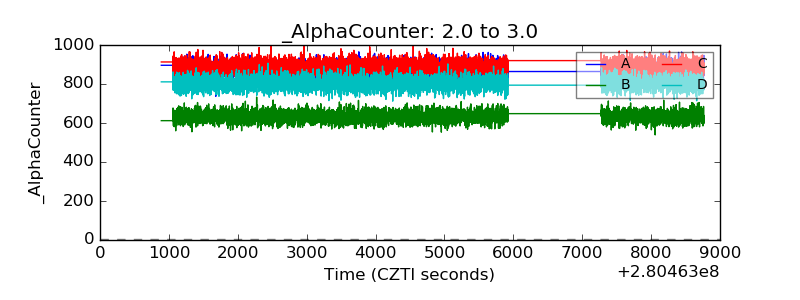 |
| _CPM_Rate | 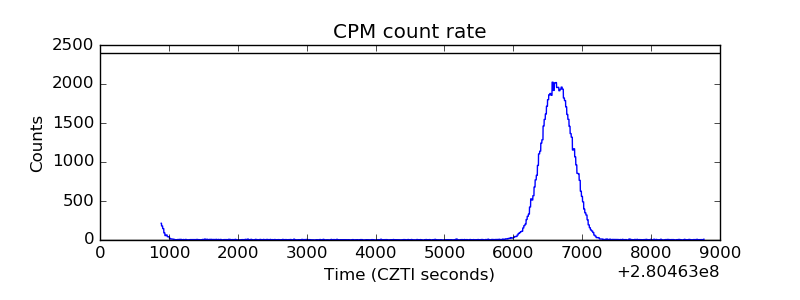 |
| CZT Counter | 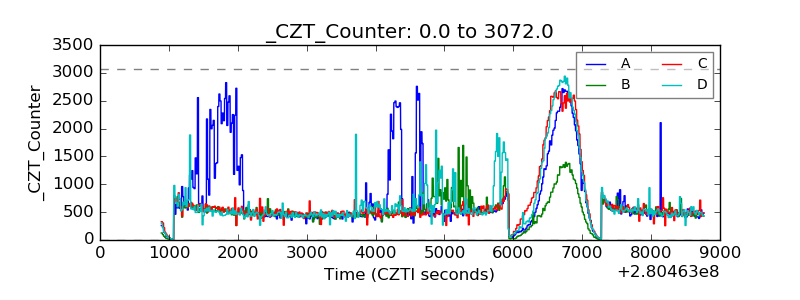 |
| +2.5 Volts monitor |  |
| +5 Volts monitor |  |
| _ROLL_ROT | 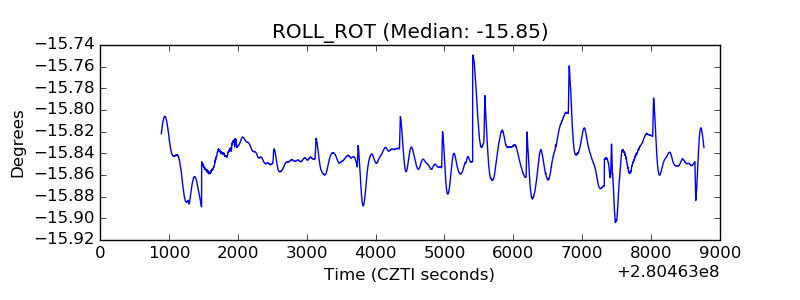 |
| _Roll_DEC | 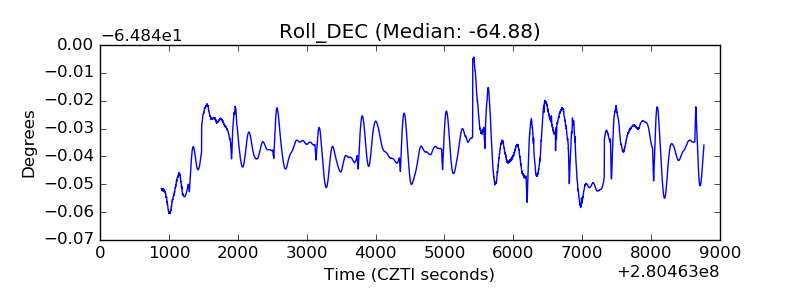 |
| _Roll_RA | 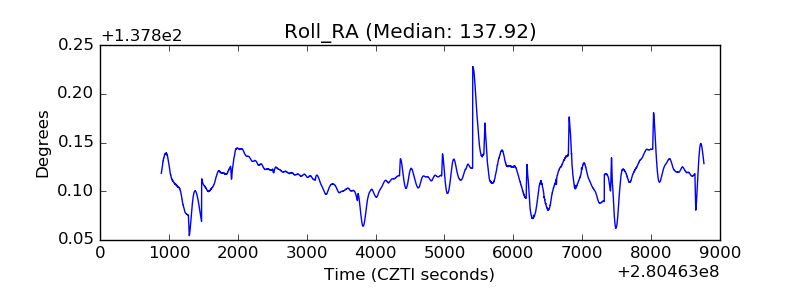 |
| Veto Counter | 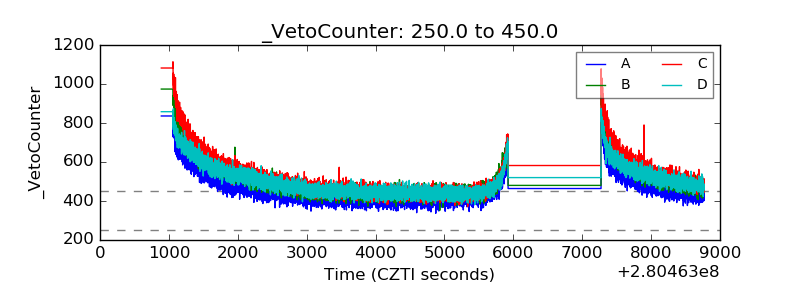 |