| Param | Original file | Final file |
|---|---|---|
| Filename | modeM0/AS1A05_206T01_9000002528_17023cztM0_level2.evt | modeM0/AS1A05_206T01_9000002528_17023cztM0_level2_quad_clean.evt |
| Size (bytes) | 420,007,680 | 100,440,000 |
| Size | 400.6 MB | 95.8 MB |
| Events in quadrant A | 3,076,243 | 659,995 |
| Events in quadrant B | 3,330,813 | 674,247 |
| Events in quadrant C | 2,990,379 | 660,328 |
| Events in quadrant D | 2,930,042 | 643,824 |
| Mode M9 | |||
|---|---|---|---|
| Quadrant | BADHDUFLAG | Total packets | Discarded packets |
| A | 0 | 13 | 0 |
| B | 0 | 13 | 0 |
| C | 0 | 13 | 0 |
| D | 0 | 13 | 0 |
| Mode SS | |||
|---|---|---|---|
| Quadrant | BADHDUFLAG | Total packets | Discarded packets |
| A | 0 | 116 | 0 |
| B | 0 | 116 | 0 |
| C | 0 | 116 | 0 |
| D | 0 | 116 | 0 |
| Mode M0 | |||
|---|---|---|---|
| Quadrant | BADHDUFLAG | Total packets | Discarded packets |
| A | 0 | 12782 | 1 |
| B | 0 | 13523 | 1 |
| C | 0 | 12241 | 1 |
| D | 0 | 12400 | 1 |
| Quadrant | Total seconds | Saturated seconds | Saturation percentage |
|---|---|---|---|
| A | 5777 | 130 | 2.250303% |
| B | 5777 | 121 | 2.094513% |
| C | 5777 | 79 | 1.367492% |
| D | 5778 | 42 | 0.726895% |
Noise dominated data is calculated using 1-second bins in cleaned event files. If a bin has >2000 counts, and if more than 50% of those come from <1% of pixels, then it is considered to be noise-dominated and hence unusable.
| Quadrant | # 1 sec bins | Bins with >0 counts | Bins with >2000 counts | High rate bins dominated by noise | Noise dominated (total time) | Noise dominated (detector-on time) | Marked lightcurve |
|---|---|---|---|---|---|---|---|
| A | 7038 | 5779 | 94 | 94 | 1.34% | 1.63% | 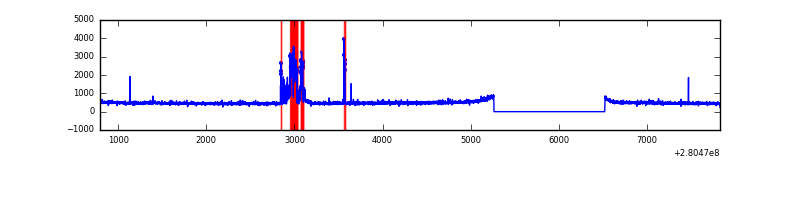 |
| B | 7038 | 5779 | 45 | 45 | 0.64% | 0.78% | 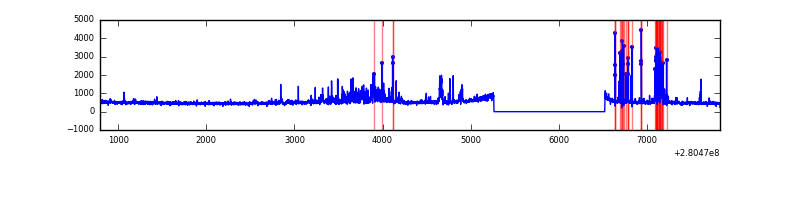 |
| C | 7038 | 5778 | 0 | 0 | 0.00% | 0.00% |  |
| D | 7039 | 5780 | 10 | 10 | 0.14% | 0.17% | 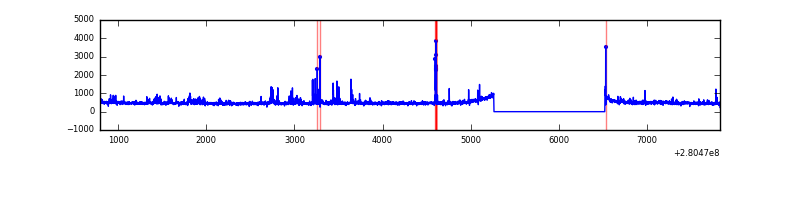 |
Top three noisy pixels from each quadrant. If the there are fewer than three noisy pixels in the level2.evt file, extra rows are filled as -1
| Pixel properties | Quadrant properties | ||||||
|---|---|---|---|---|---|---|---|
| Quadrant | DetID | PixID | Counts | Sigma | Mean | Median | Sigma |
| A | 15 | 174 | 322472 | 2257.34 | 707 | 692 | 142.5 |
| A | 4 | 2 | 30764 | 210.96 | 707 | 692 | 142.5 |
| A | 12 | 189 | 7475 | 47.58 | 707 | 692 | 142.5 |
| B | 3 | 64 | 210142 | 1582.1 | 712 | 693 | 132.4 |
| B | 7 | 220 | 136758 | 1027.79 | 712 | 693 | 132.4 |
| B | 0 | 189 | 65286 | 487.91 | 712 | 693 | 132.4 |
| C | 3 | 233 | 124395 | 760.27 | 704 | 708 | 162.7 |
| C | 14 | 238 | 110455 | 674.58 | 704 | 708 | 162.7 |
| C | 5 | 112 | 5397 | 28.82 | 704 | 708 | 162.7 |
| D | 1 | 52 | 116173 | 674.73 | 710 | 690 | 171.2 |
| D | 10 | 70 | 61295 | 354.1 | 710 | 690 | 171.2 |
| D | 12 | 110 | 27264 | 155.26 | 710 | 690 | 171.2 |
Histogram calculated using DETX and DETY for each event in the final _common_clean file
| Quadrant A |  |
 |
Quadrant B |
|---|---|---|---|
| Quadrant D |  |
 |
Quadrant C |
| Plot type | Count rate plots | Images |
|---|---|---|
| Comparison with Poisson distribution Blue bars denote a histogram of data divided into 1 sec bins. Red curve is a Poisson curve with rate = median count rate of data. |
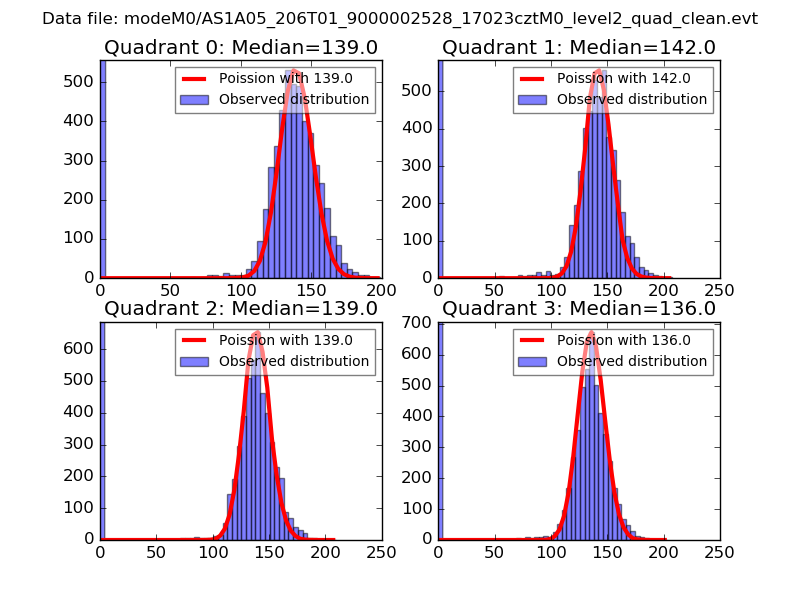 |
 |
| Quadrant-wise count rates Data is divided into 100 sec bins |
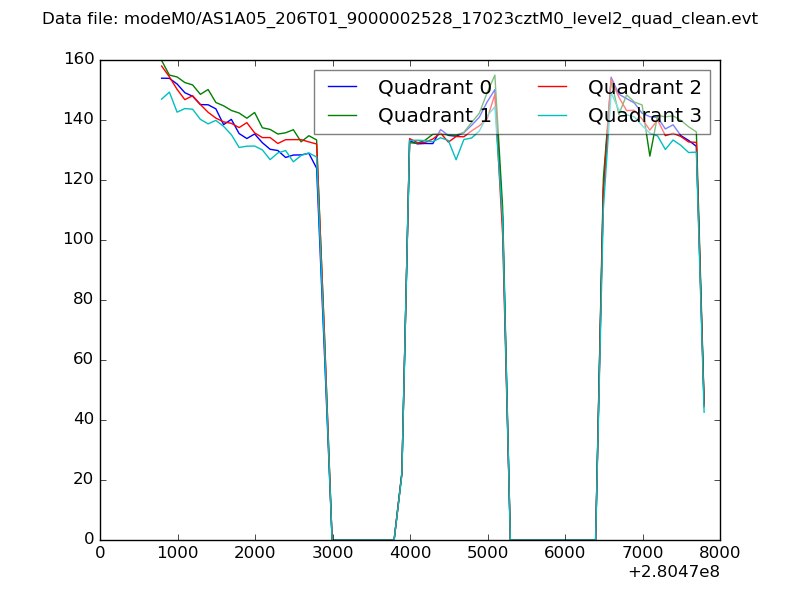 |
|
| Module-wise count rates for Quadrant A Data is divided into 100 sec bins |
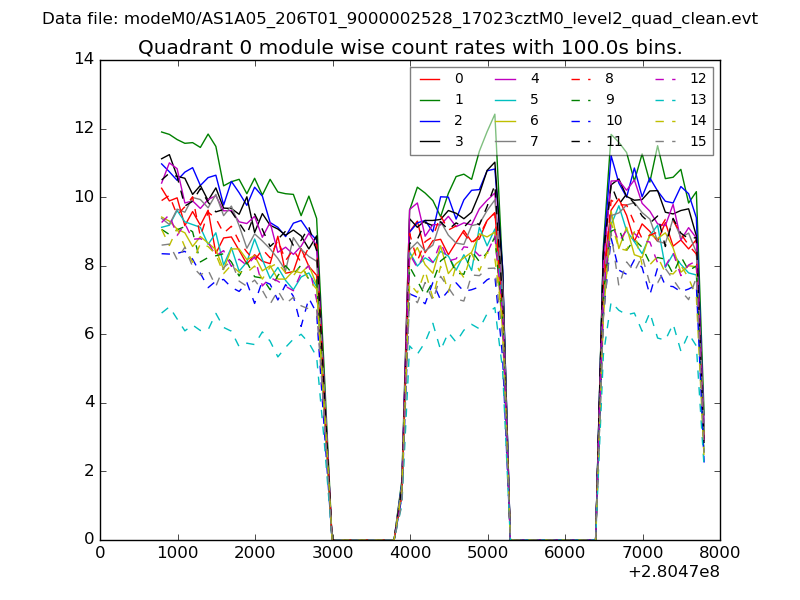 |
 |
| Module-wise count rates for Quadrant B Data is divided into 100 sec bins |
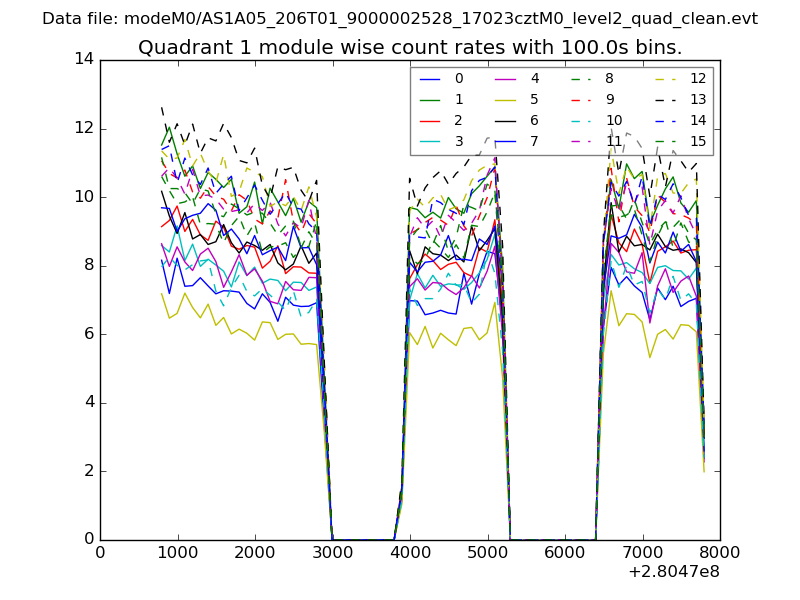 |
 |
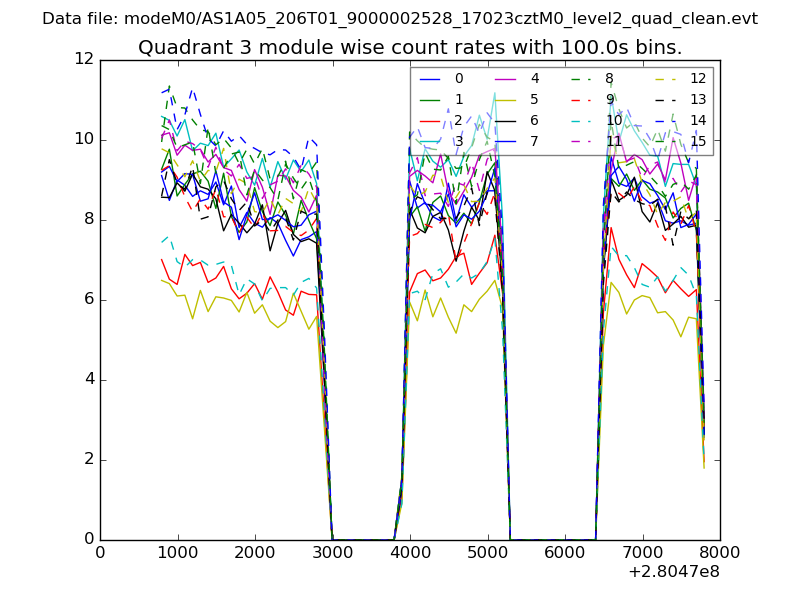
| Module-wise count rates for Quadrant C Data is divided into 100 sec bins |
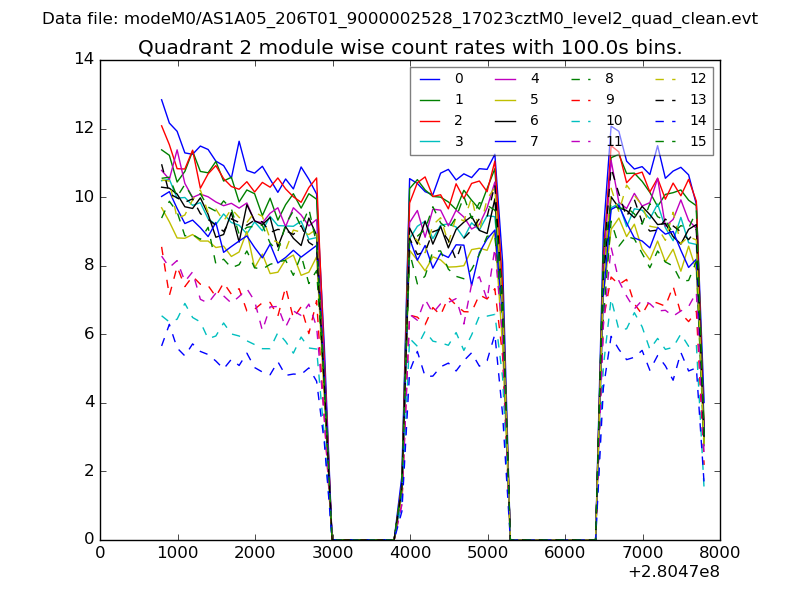 |
 |
| Module-wise count rates for Quadrant D Data is divided into 100 sec bins |
 |
 |
| Parameter | Plot |
|---|---|
| CZT HV Monitor | 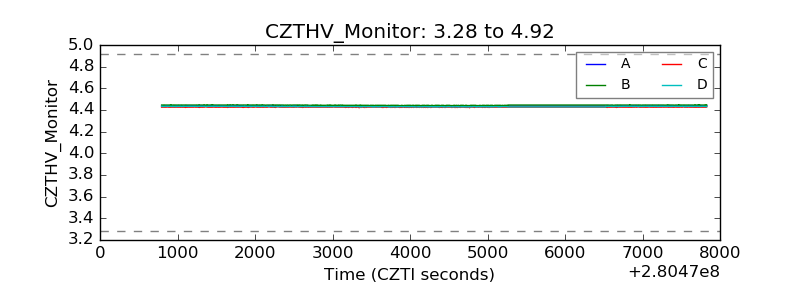 |
| D_VDD |  |
| Temperature 1 |  |
| Veto HV Monitor |  |
| Veto LLD |  |
| Alpha Counter | 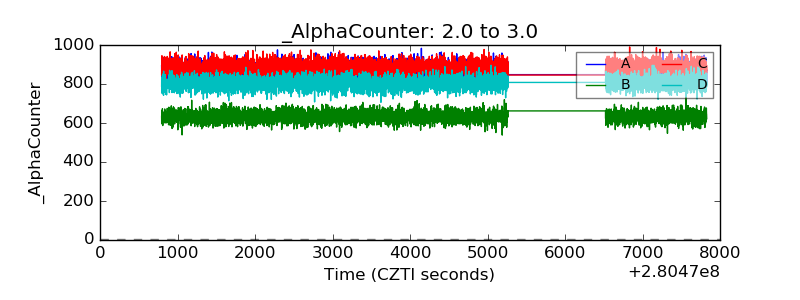 |
| _CPM_Rate | 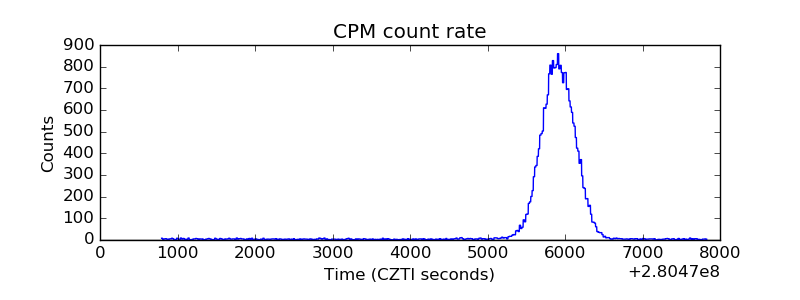 |
| CZT Counter |  |
| +2.5 Volts monitor |  |
| +5 Volts monitor |  |
| _ROLL_ROT | 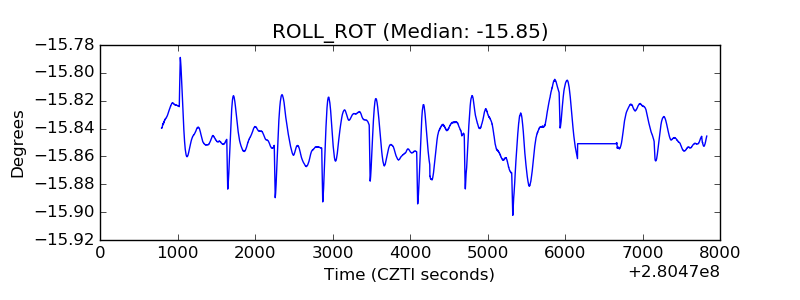 |
| _Roll_DEC |  |
| _Roll_RA |  |
| Veto Counter | 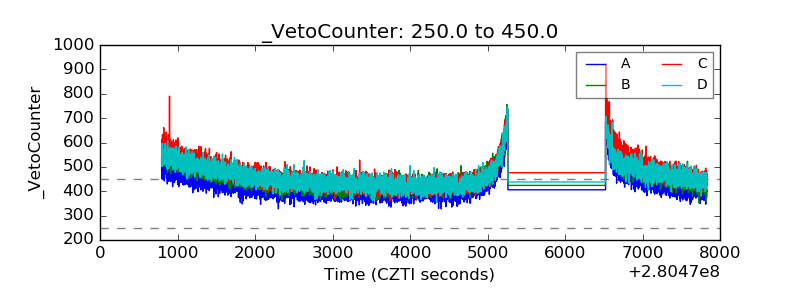 |