| Param | Original file | Final file |
|---|---|---|
| Filename | modeM0/AS1A05_206T01_9000002528_17025cztM0_level2.evt | modeM0/AS1A05_206T01_9000002528_17025cztM0_level2_quad_clean.evt |
| Size (bytes) | 502,816,320 | 120,170,880 |
| Size | 479.5 MB | 114.6 MB |
| Events in quadrant A | 3,403,351 | 788,755 |
| Events in quadrant B | 4,053,067 | 798,256 |
| Events in quadrant C | 3,656,057 | 780,591 |
| Events in quadrant D | 3,621,197 | 765,611 |
| Mode M9 | |||
|---|---|---|---|
| Quadrant | BADHDUFLAG | Total packets | Discarded packets |
| A | 0 | 5 | 0 |
| B | 0 | 6 | 0 |
| C | 0 | 6 | 0 |
| D | 0 | 6 | 0 |
| Mode SS | |||
|---|---|---|---|
| Quadrant | BADHDUFLAG | Total packets | Discarded packets |
| A | 0 | 146 | 0 |
| B | 0 | 146 | 0 |
| C | 0 | 146 | 0 |
| D | 0 | 146 | 0 |
| Mode M0 | |||
|---|---|---|---|
| Quadrant | BADHDUFLAG | Total packets | Discarded packets |
| A | 0 | 15148 | 2 |
| B | 0 | 16721 | 2 |
| C | 0 | 15455 | 2 |
| D | 0 | 15648 | 3 |
| Quadrant | Total seconds | Saturated seconds | Saturation percentage |
|---|---|---|---|
| A | 7276 | 175 | 2.405168% |
| B | 7276 | 324 | 4.452996% |
| C | 7276 | 220 | 3.023639% |
| D | 7275 | 168 | 2.309278% |
Noise dominated data is calculated using 1-second bins in cleaned event files. If a bin has >2000 counts, and if more than 50% of those come from <1% of pixels, then it is considered to be noise-dominated and hence unusable.
| Quadrant | # 1 sec bins | Bins with >0 counts | Bins with >2000 counts | High rate bins dominated by noise | Noise dominated (total time) | Noise dominated (detector-on time) | Marked lightcurve |
|---|---|---|---|---|---|---|---|
| A | 7707 | 7278 | 0 | 0 | 0.00% | 0.00% | 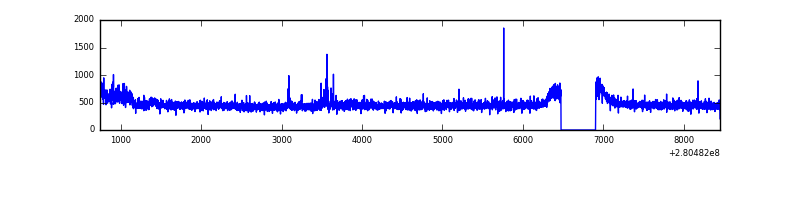 |
| B | 7707 | 7278 | 61 | 61 | 0.79% | 0.84% | 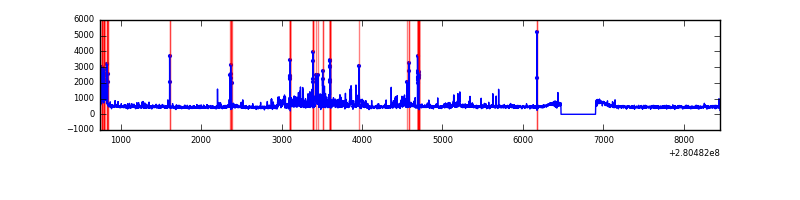 |
| C | 7707 | 7277 | 0 | 0 | 0.00% | 0.00% | 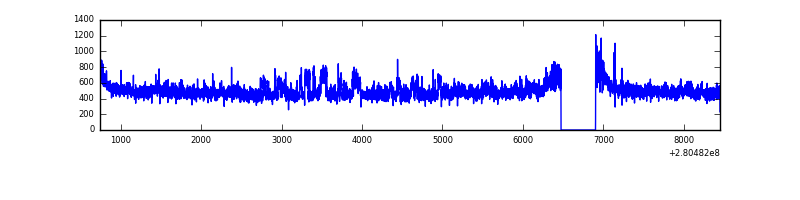 |
| D | 7706 | 7277 | 14 | 14 | 0.18% | 0.19% | 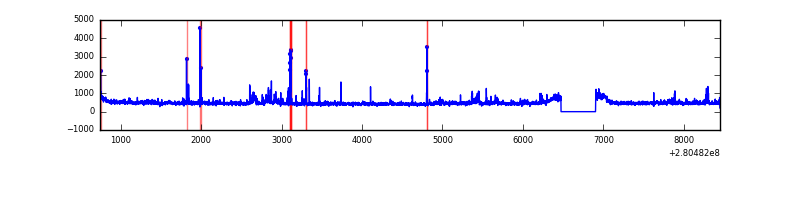 |
Top three noisy pixels from each quadrant. If the there are fewer than three noisy pixels in the level2.evt file, extra rows are filled as -1
| Pixel properties | Quadrant properties | ||||||
|---|---|---|---|---|---|---|---|
| Quadrant | DetID | PixID | Counts | Sigma | Mean | Median | Sigma |
| A | 15 | 174 | 76062 | 430.76 | 863 | 842 | 174.6 |
| A | 0 | 226 | 7492 | 38.08 | 863 | 842 | 174.6 |
| A | 12 | 194 | 6655 | 33.29 | 863 | 842 | 174.6 |
| B | 7 | 220 | 268415 | 1630.19 | 861 | 837 | 164.1 |
| B | 3 | 64 | 147725 | 894.9 | 861 | 837 | 164.1 |
| B | 0 | 229 | 88973 | 536.96 | 861 | 837 | 164.1 |
| C | 3 | 233 | 219531 | 1109.4 | 844 | 848 | 197.1 |
| C | 14 | 238 | 127527 | 642.66 | 844 | 848 | 197.1 |
| C | 7 | 247 | 13354 | 63.44 | 844 | 848 | 197.1 |
| D | 1 | 52 | 296965 | 1419.08 | 857 | 831 | 208.7 |
| D | 10 | 70 | 44130 | 207.49 | 857 | 831 | 208.7 |
| D | 2 | 234 | 34043 | 159.15 | 857 | 831 | 208.7 |
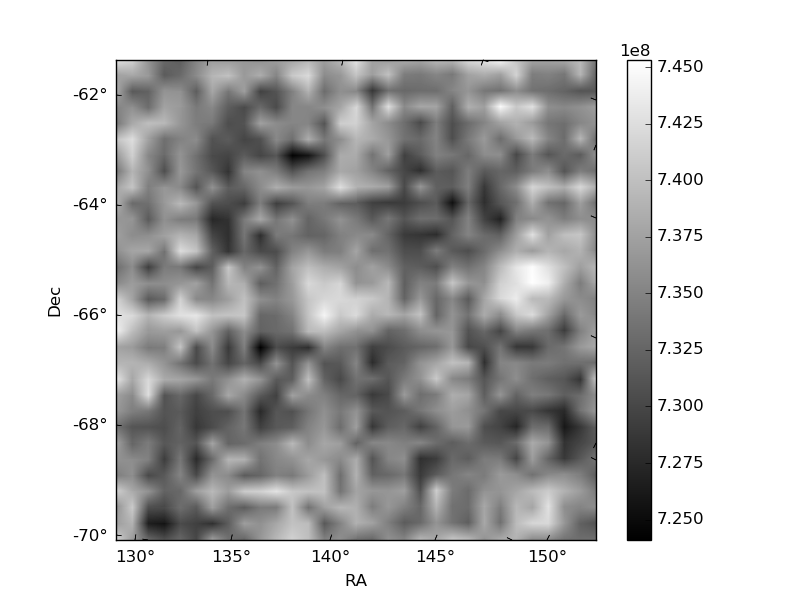
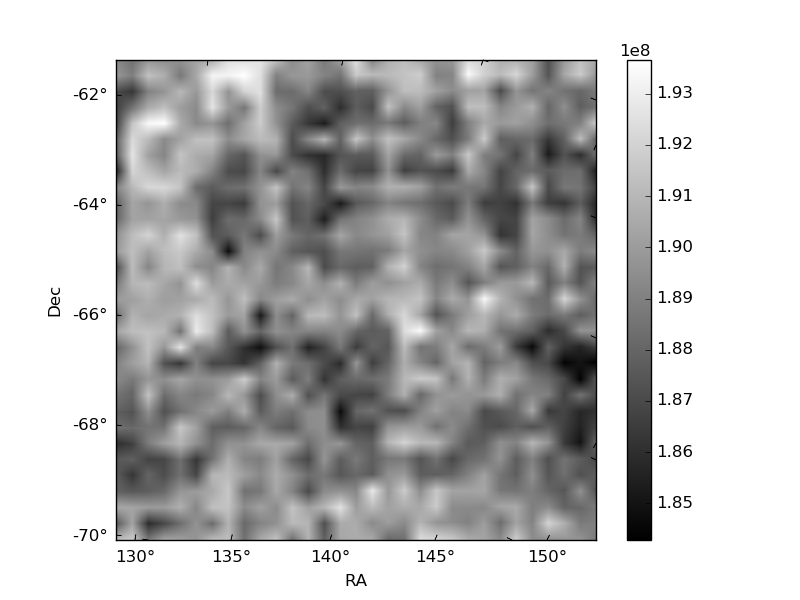
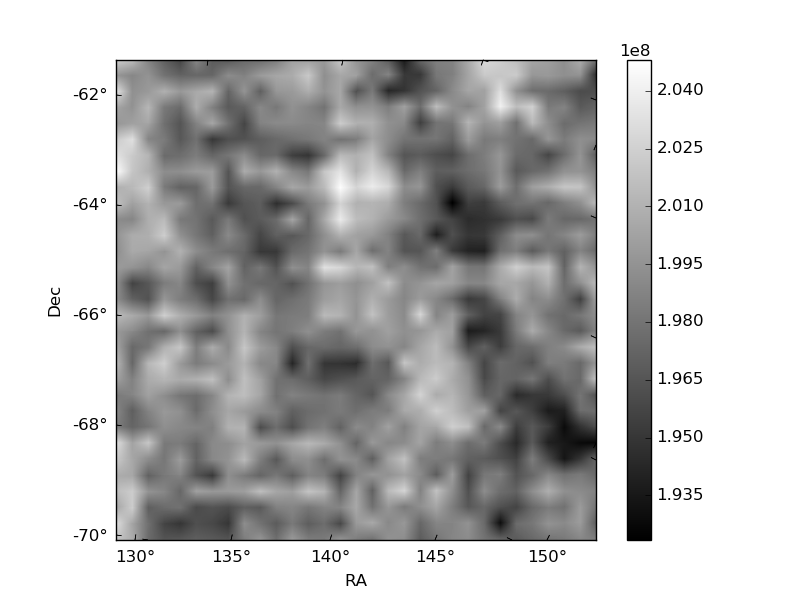
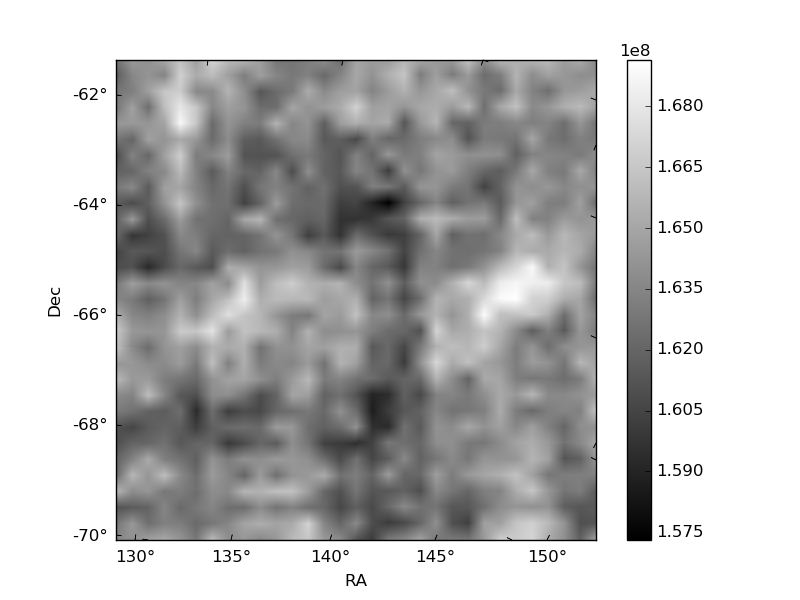
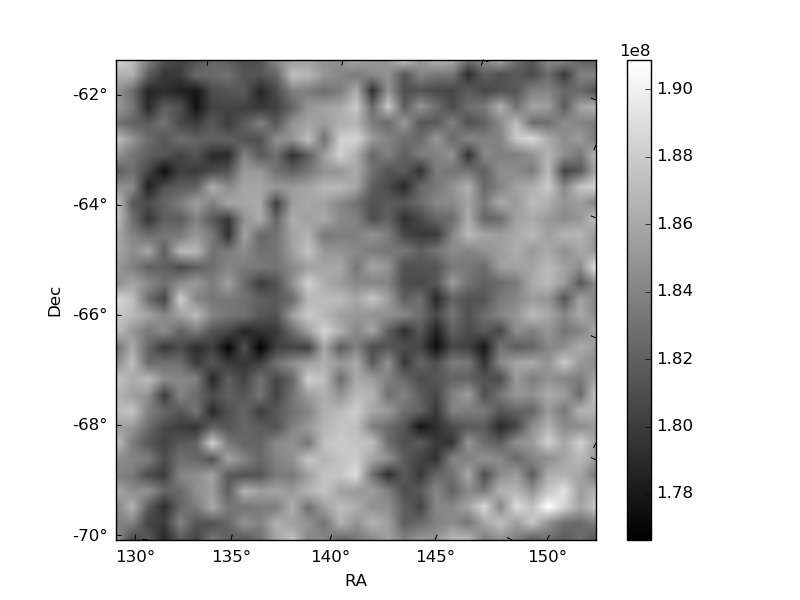
Histogram calculated using DETX and DETY for each event in the final _common_clean file
| Quadrant A | 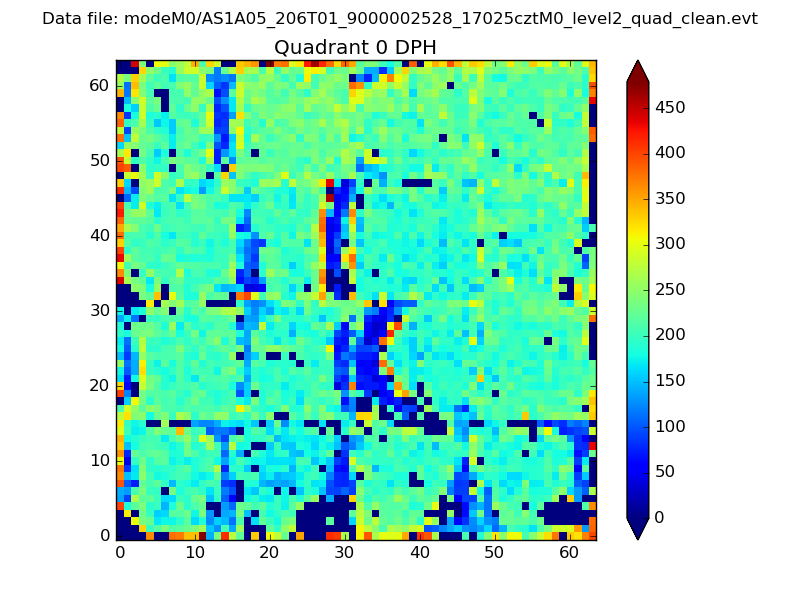 |
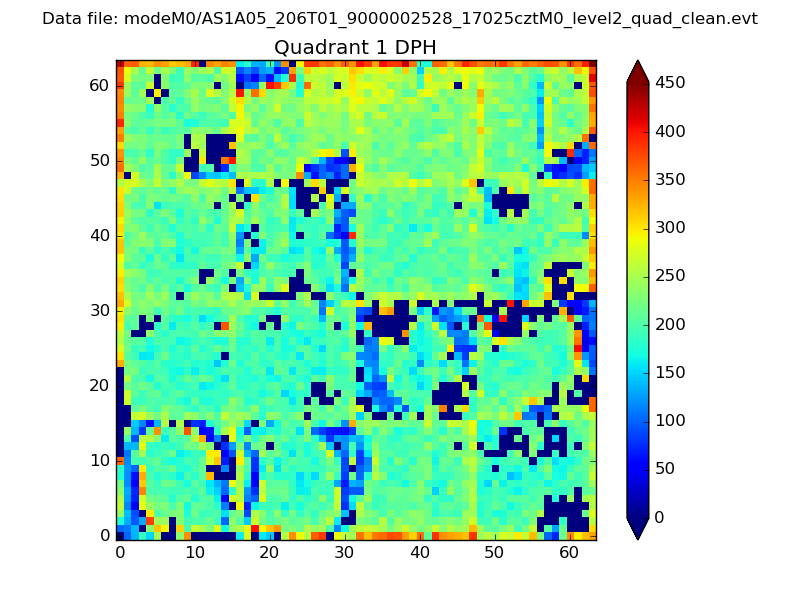 |
Quadrant B |
|---|---|---|---|
| Quadrant D | 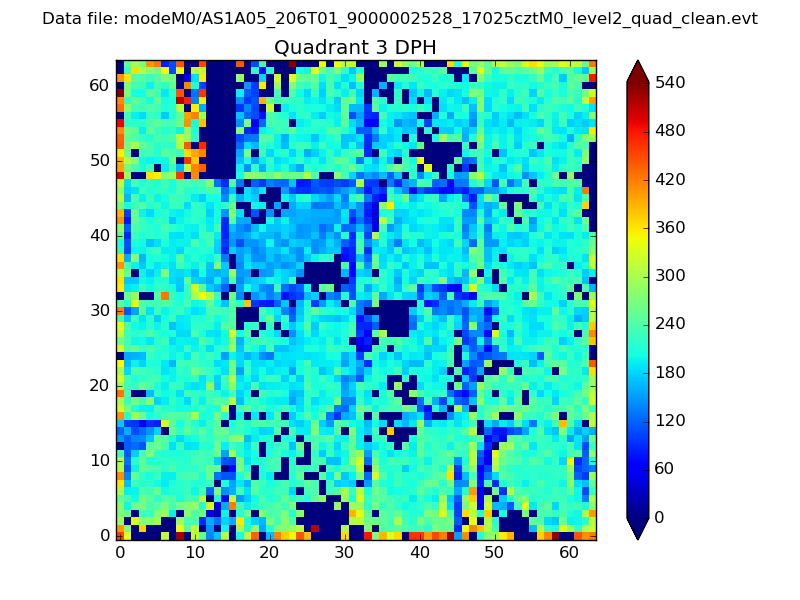 |
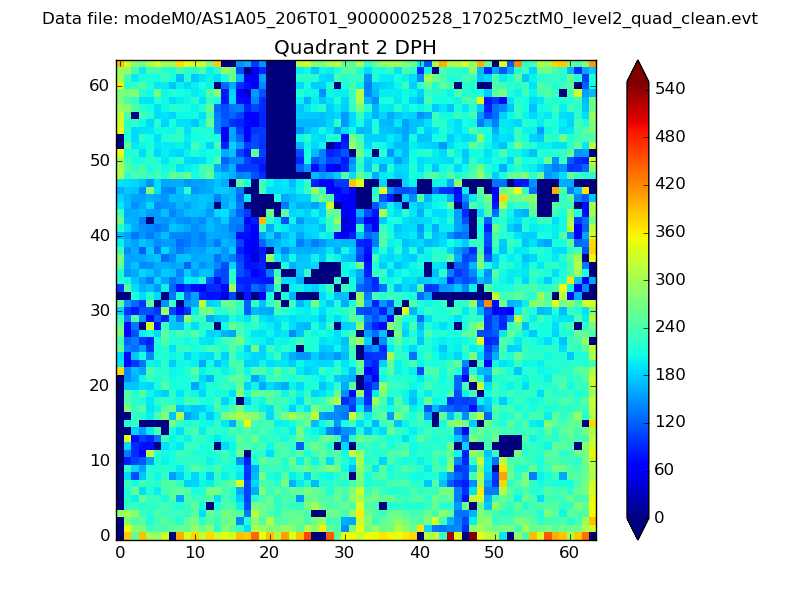 |
Quadrant C |
| Plot type | Count rate plots | Images |
|---|---|---|
| Comparison with Poisson distribution Blue bars denote a histogram of data divided into 1 sec bins. Red curve is a Poisson curve with rate = median count rate of data. |
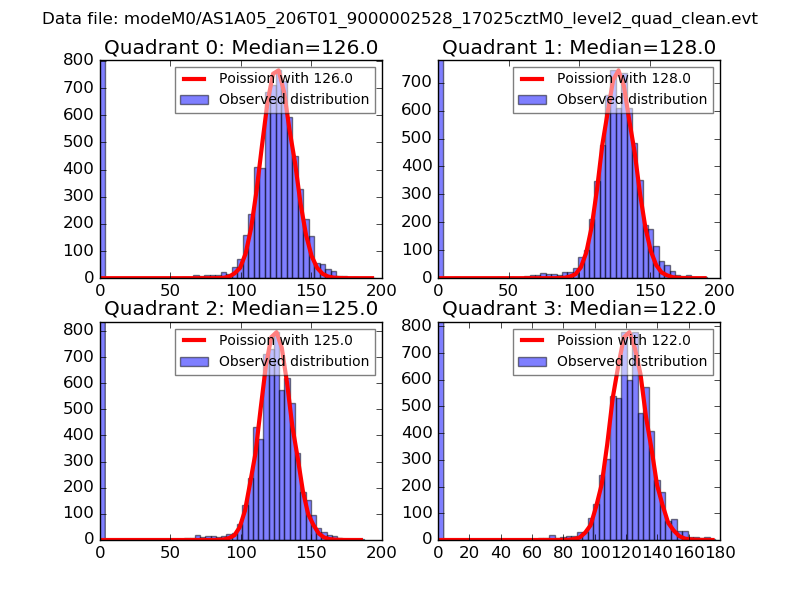 |
 |
| Quadrant-wise count rates Data is divided into 100 sec bins |
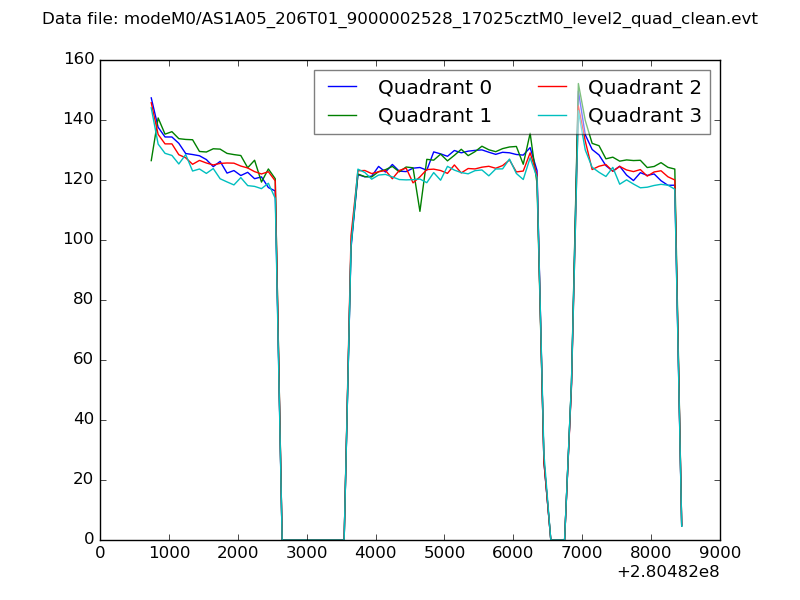 |
|
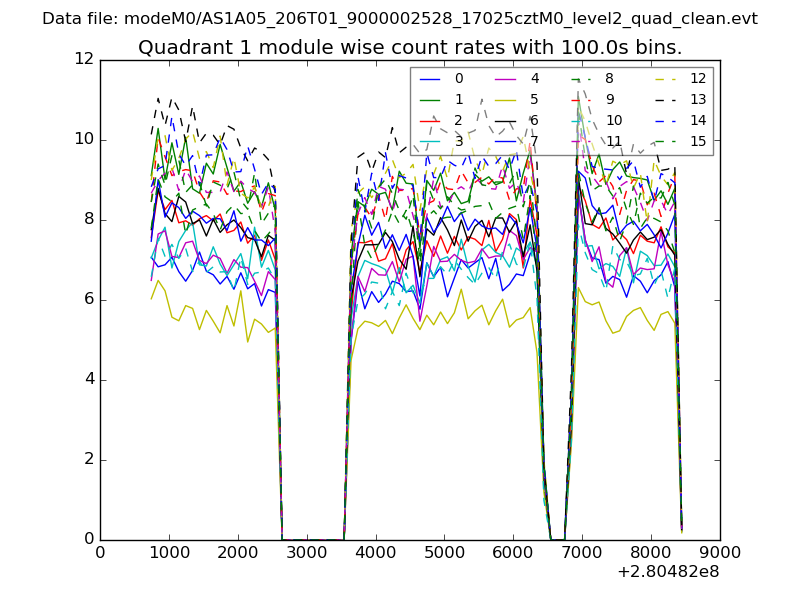
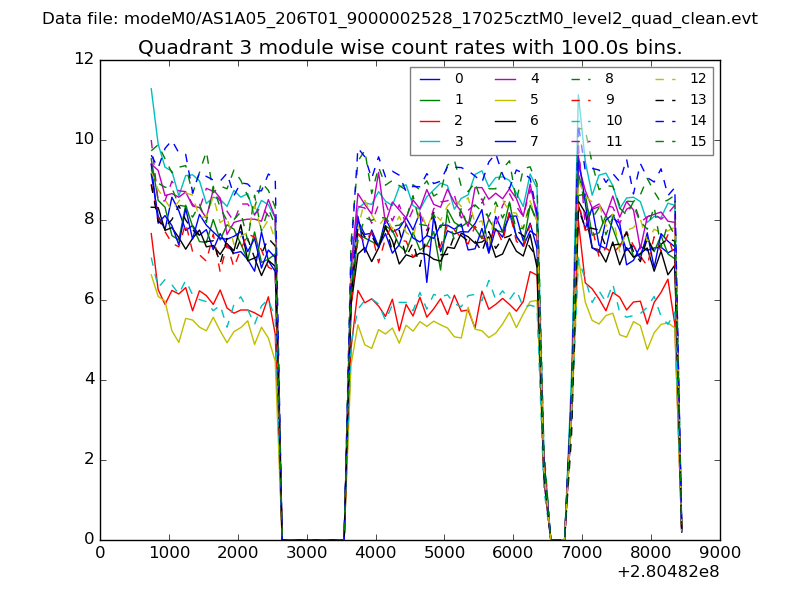
| Module-wise count rates for Quadrant A Data is divided into 100 sec bins |
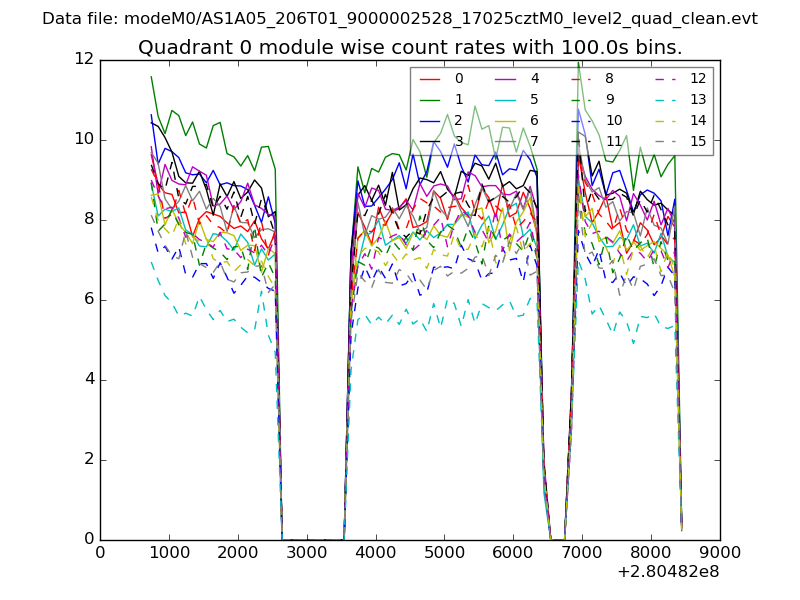 |
 |
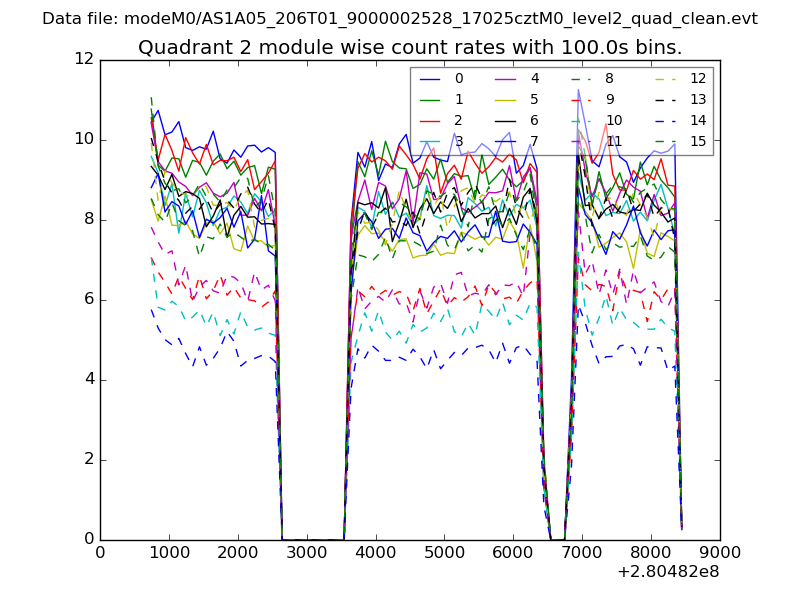
| Module-wise count rates for Quadrant B Data is divided into 100 sec bins |
 |
 |
| Module-wise count rates for Quadrant C Data is divided into 100 sec bins |
 |
 |
| Module-wise count rates for Quadrant D Data is divided into 100 sec bins |
 |
 |
| Parameter | Plot |
|---|---|
| CZT HV Monitor | 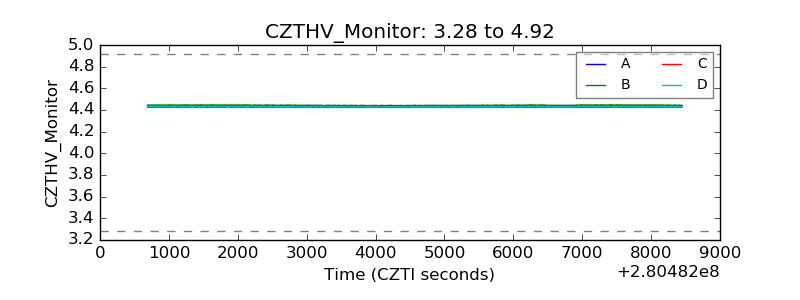 |
| D_VDD |  |
| Temperature 1 |  |
| Veto HV Monitor | 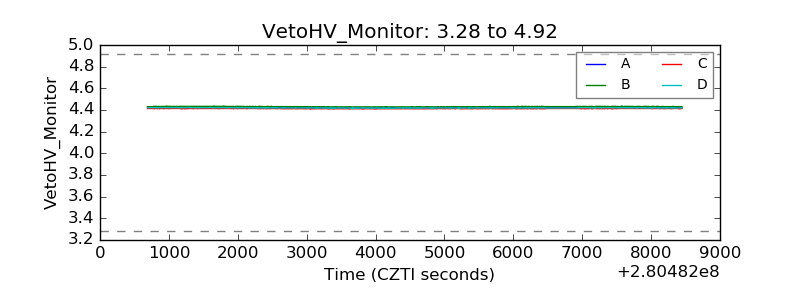 |
| Veto LLD | 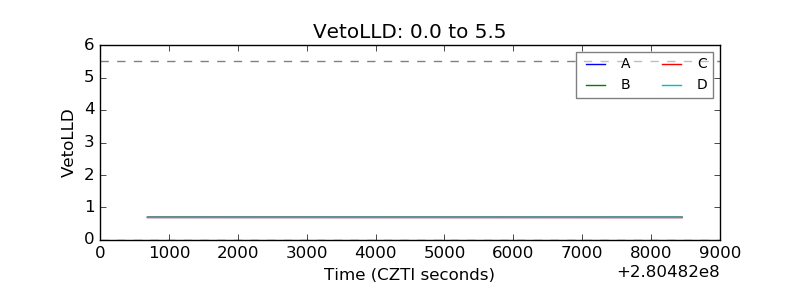 |
| Alpha Counter | 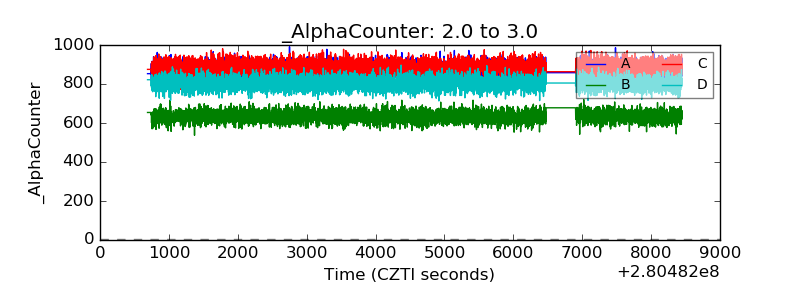 |
| _CPM_Rate | 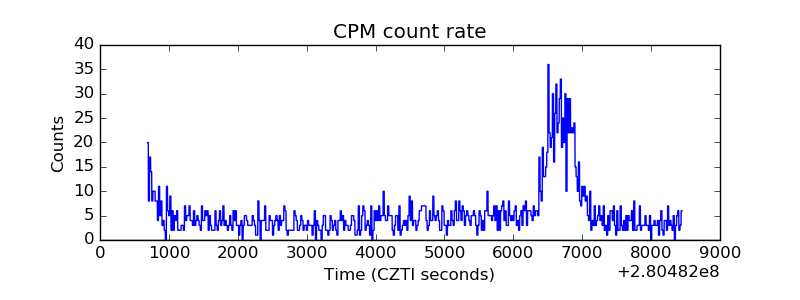 |
| CZT Counter | 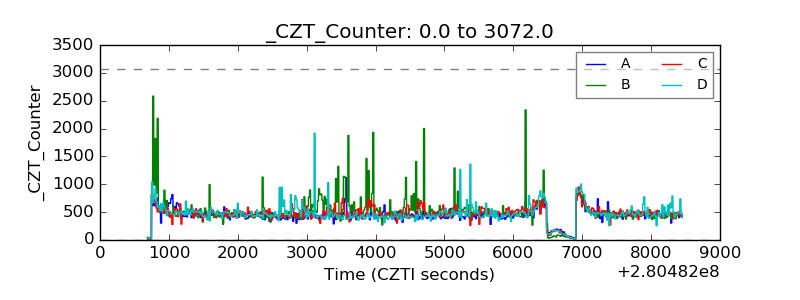 |
| +2.5 Volts monitor |  |
| +5 Volts monitor |  |
| _ROLL_ROT | 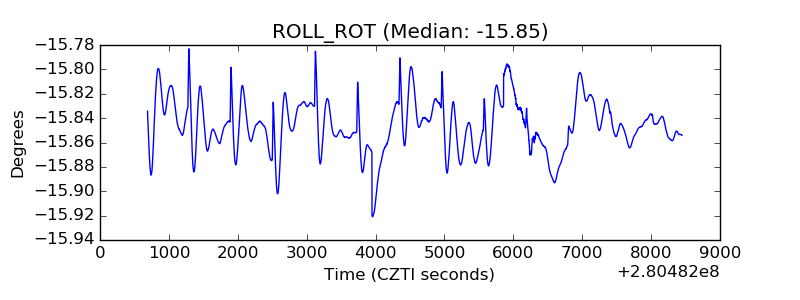 |
| _Roll_DEC | 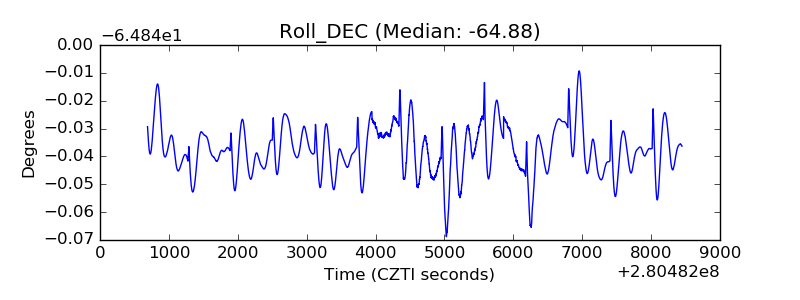 |
| _Roll_RA | 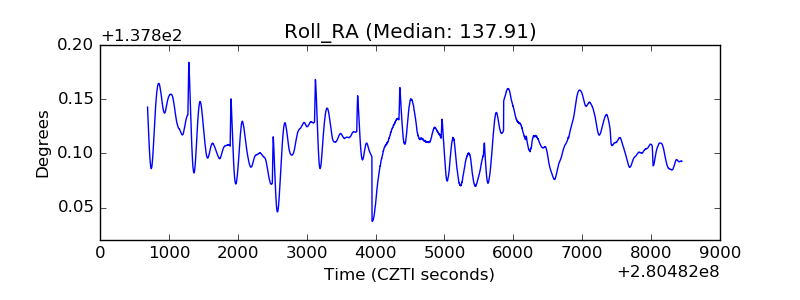 |
| Veto Counter | 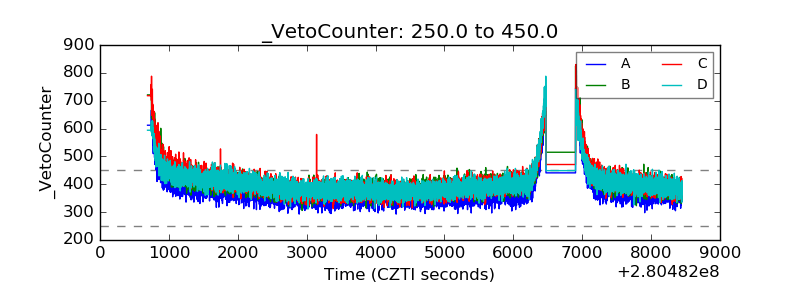 |