| Param | Original file | Final file |
|---|---|---|
| Filename | modeM0/AS1A05_206T01_9000002528_17026cztM0_level2.evt | modeM0/AS1A05_206T01_9000002528_17026cztM0_level2_quad_clean.evt |
| Size (bytes) | 531,449,280 | 114,243,840 |
| Size | 506.8 MB | 109.0 MB |
| Events in quadrant A | 3,613,179 | 734,649 |
| Events in quadrant B | 4,179,702 | 749,381 |
| Events in quadrant C | 3,810,890 | 729,524 |
| Events in quadrant D | 3,970,906 | 713,507 |
| Mode SS | |||
|---|---|---|---|
| Quadrant | BADHDUFLAG | Total packets | Discarded packets |
| A | 0 | 154 | 0 |
| B | 0 | 154 | 0 |
| C | 0 | 154 | 0 |
| D | 0 | 154 | 0 |
| Mode M0 | |||
|---|---|---|---|
| Quadrant | BADHDUFLAG | Total packets | Discarded packets |
| A | 0 | 16040 | 0 |
| B | 0 | 17261 | 0 |
| C | 0 | 16042 | 0 |
| D | 0 | 17119 | 0 |
| Quadrant | Total seconds | Saturated seconds | Saturation percentage |
|---|---|---|---|
| A | 7652 | 301 | 3.933612% |
| B | 7652 | 327 | 4.273393% |
| C | 7652 | 310 | 4.051228% |
| D | 7653 | 281 | 3.671763% |
Noise dominated data is calculated using 1-second bins in cleaned event files. If a bin has >2000 counts, and if more than 50% of those come from <1% of pixels, then it is considered to be noise-dominated and hence unusable.
| Quadrant | # 1 sec bins | Bins with >0 counts | Bins with >2000 counts | High rate bins dominated by noise | Noise dominated (total time) | Noise dominated (detector-on time) | Marked lightcurve |
|---|---|---|---|---|---|---|---|
| A | 7653 | 7653 | 4 | 4 | 0.05% | 0.05% | 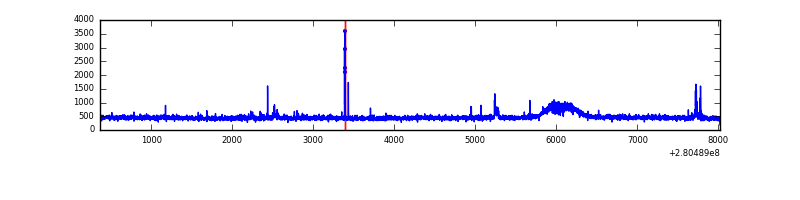 |
| B | 7653 | 7653 | 5 | 5 | 0.07% | 0.07% | 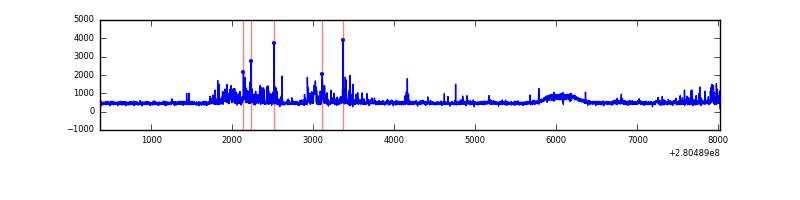 |
| C | 7653 | 7653 | 0 | 0 | 0.00% | 0.00% | 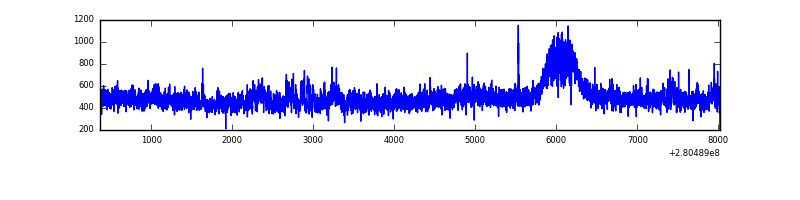 |
| D | 7654 | 7654 | 37 | 37 | 0.48% | 0.48% | 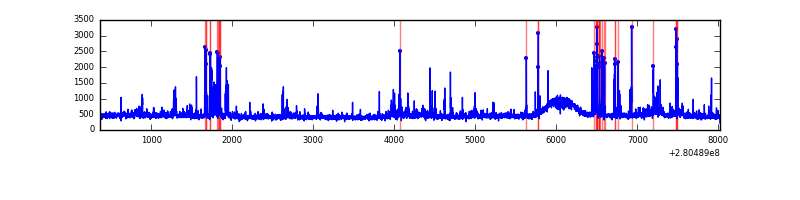 |
Top three noisy pixels from each quadrant. If the there are fewer than three noisy pixels in the level2.evt file, extra rows are filled as -1
| Pixel properties | Quadrant properties | ||||||
|---|---|---|---|---|---|---|---|
| Quadrant | DetID | PixID | Counts | Sigma | Mean | Median | Sigma |
| A | 4 | 2 | 49082 | 257.23 | 915 | 888 | 187.4 |
| A | 12 | 189 | 26621 | 137.35 | 915 | 888 | 187.4 |
| A | 15 | 174 | 20797 | 106.26 | 915 | 888 | 187.4 |
| B | 7 | 220 | 212927 | 1216.45 | 915 | 889 | 174.3 |
| B | 4 | 216 | 73765 | 418.09 | 915 | 889 | 174.3 |
| B | 3 | 209 | 69458 | 393.38 | 915 | 889 | 174.3 |
| C | 3 | 233 | 174092 | 832.97 | 888 | 891 | 207.9 |
| C | 14 | 238 | 135377 | 646.78 | 888 | 891 | 207.9 |
| C | 7 | 247 | 29717 | 138.63 | 888 | 891 | 207.9 |
| D | 1 | 52 | 436025 | 1967.8 | 908 | 876 | 221.1 |
| D | 10 | 70 | 53708 | 238.91 | 908 | 876 | 221.1 |
| D | 2 | 234 | 38081 | 168.25 | 908 | 876 | 221.1 |
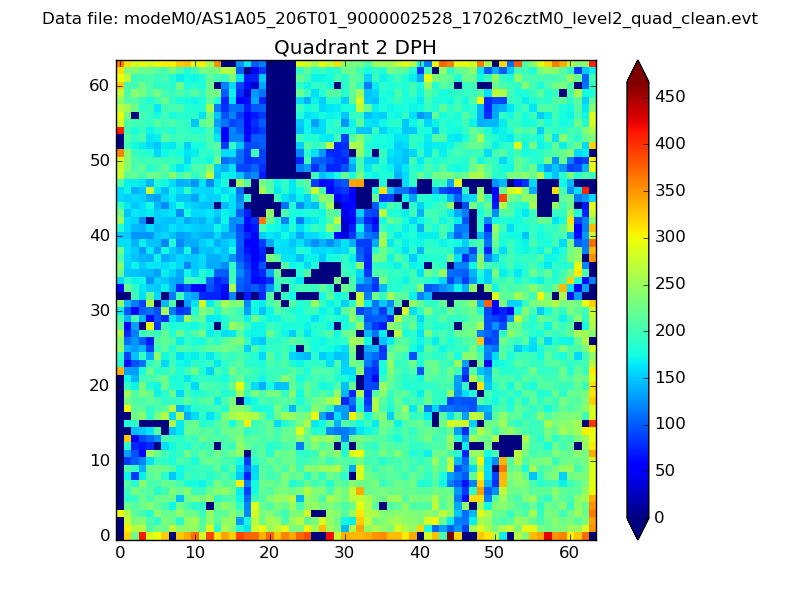
Histogram calculated using DETX and DETY for each event in the final _common_clean file
| Quadrant A |  |
 |
Quadrant B |
|---|---|---|---|
| Quadrant D |  |
 |
Quadrant C |
| Plot type | Count rate plots | Images |
|---|---|---|
| Comparison with Poisson distribution Blue bars denote a histogram of data divided into 1 sec bins. Red curve is a Poisson curve with rate = median count rate of data. |
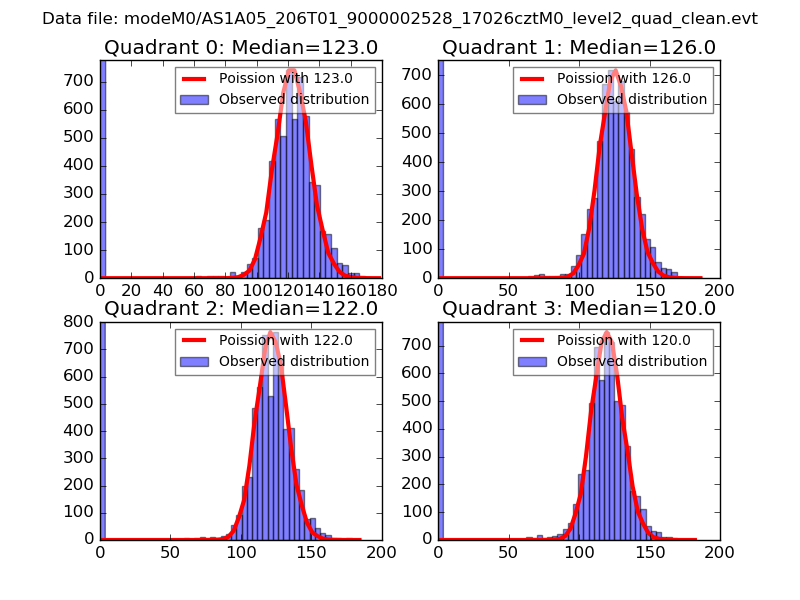 |
 |
| Quadrant-wise count rates Data is divided into 100 sec bins |
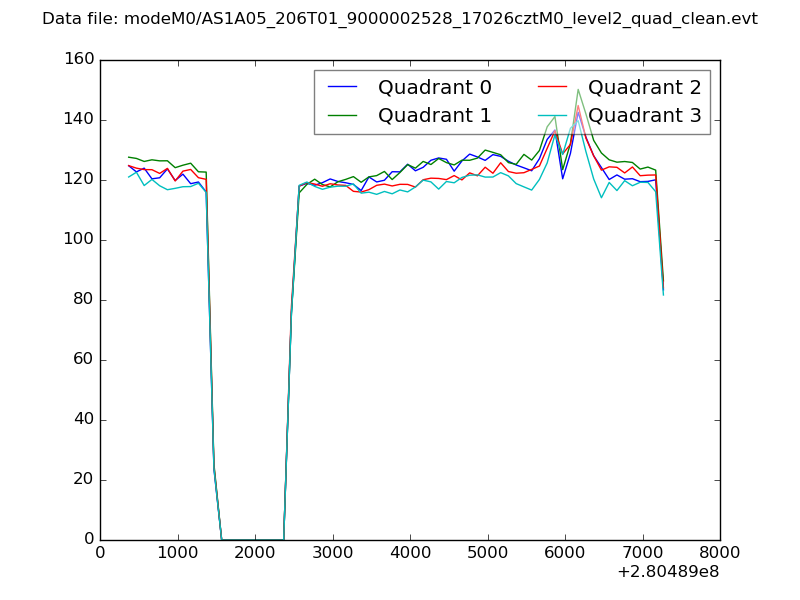 |
|
| Module-wise count rates for Quadrant A Data is divided into 100 sec bins |
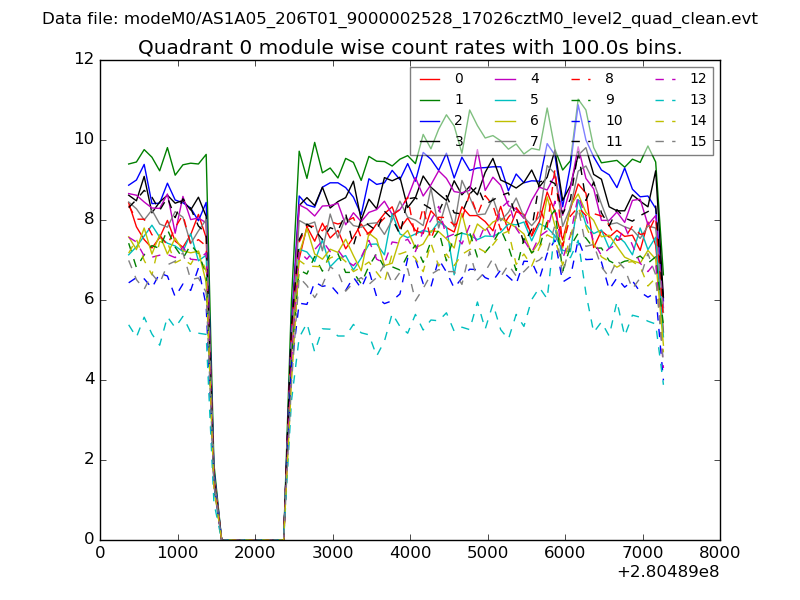 |
 |
| Module-wise count rates for Quadrant B Data is divided into 100 sec bins |
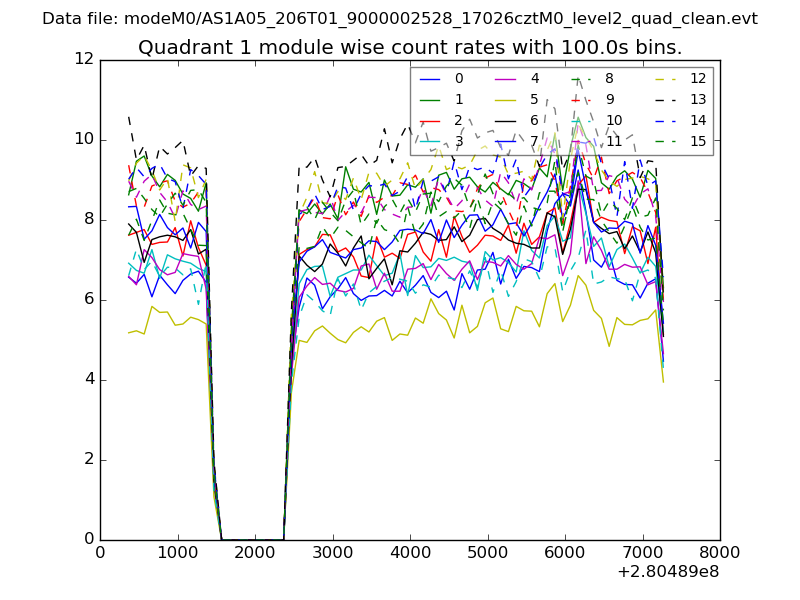 |
 |
| Module-wise count rates for Quadrant C Data is divided into 100 sec bins |
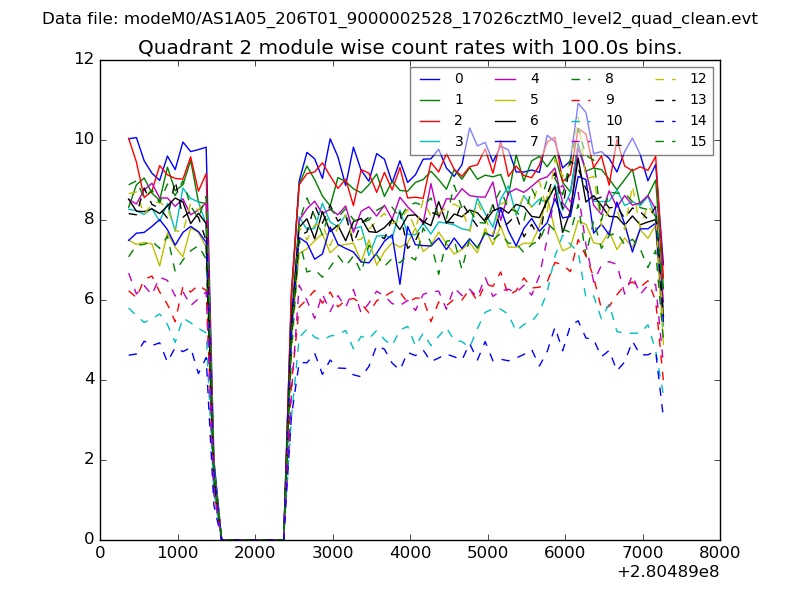 |
 |
| Module-wise count rates for Quadrant D Data is divided into 100 sec bins |
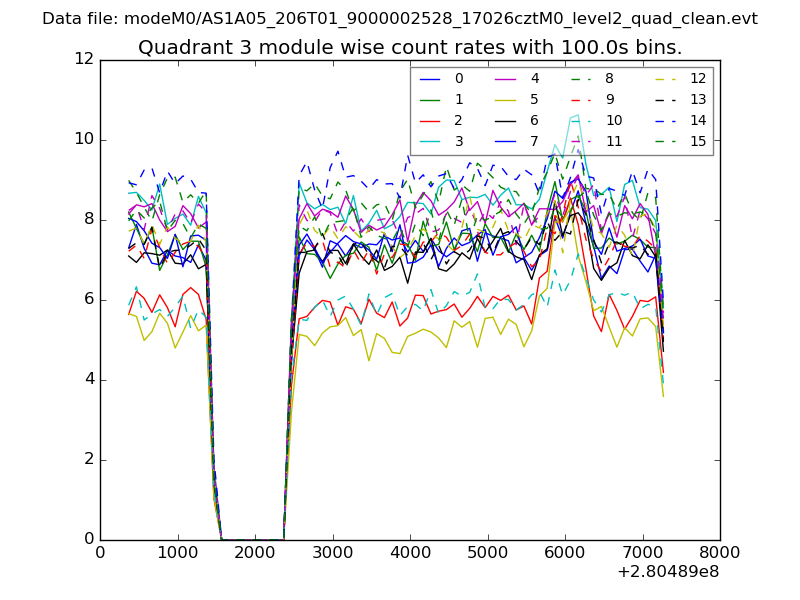 |
 |
| Parameter | Plot |
|---|---|
| CZT HV Monitor | 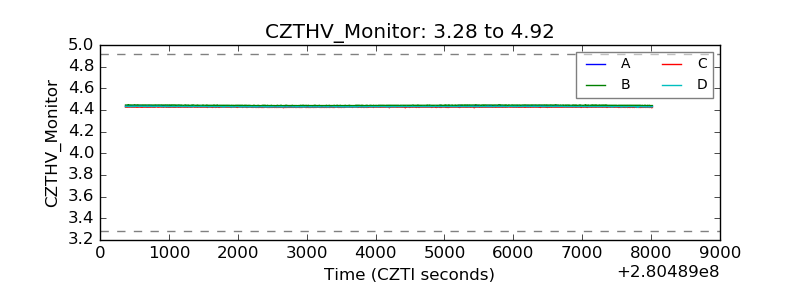 |
| D_VDD | 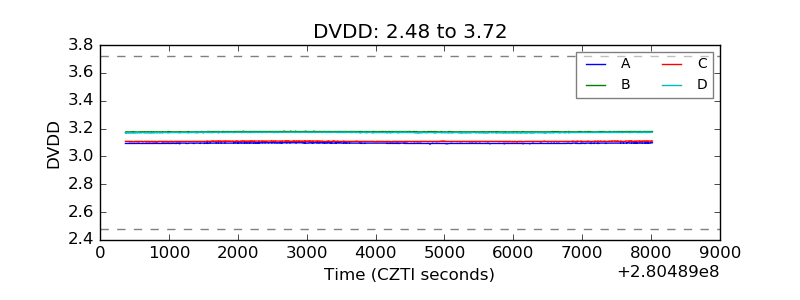 |
| Temperature 1 | 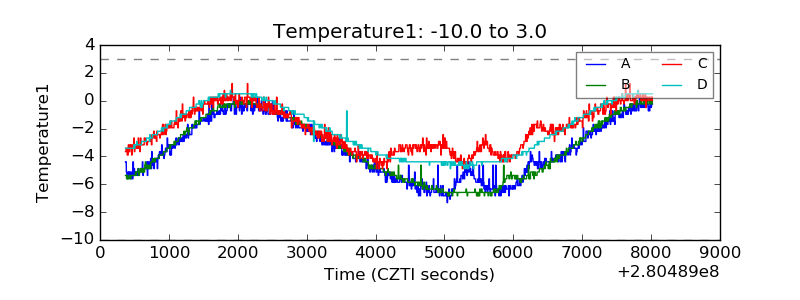 |
| Veto HV Monitor | 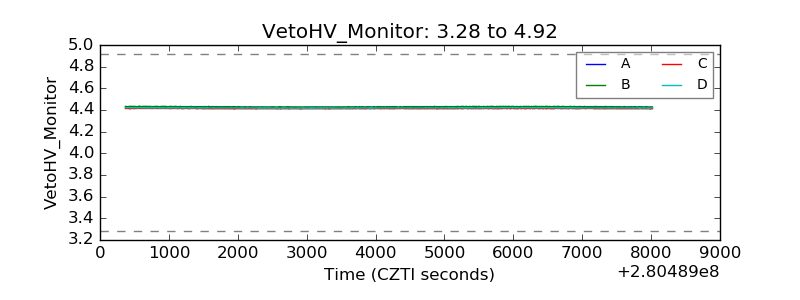 |
| Veto LLD | 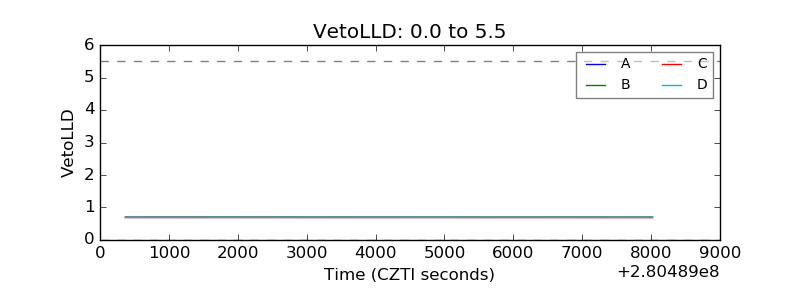 |
| Alpha Counter | 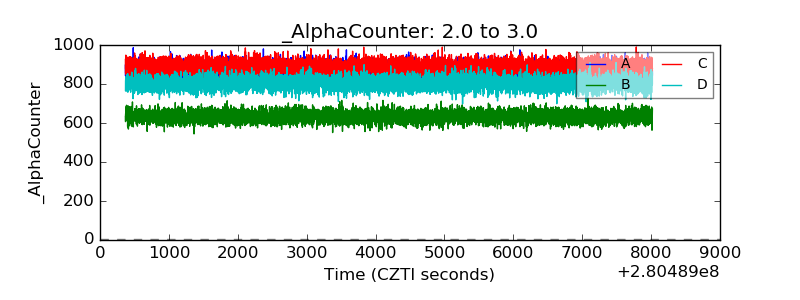 |
| _CPM_Rate | 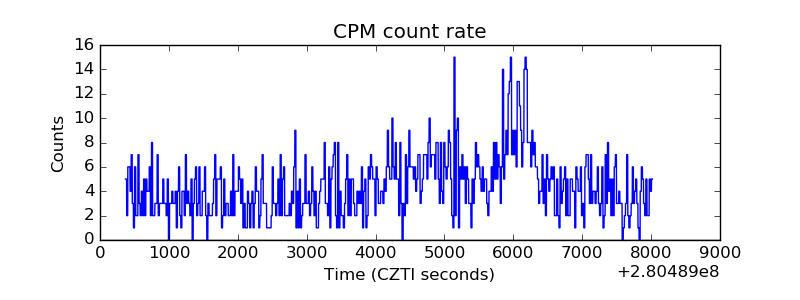 |
| CZT Counter | 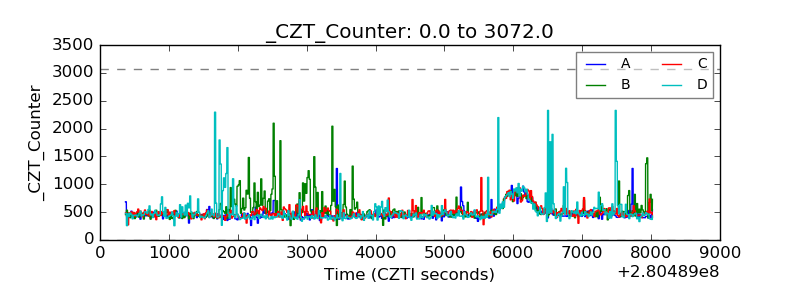 |
| +2.5 Volts monitor |  |
| +5 Volts monitor |  |
| _ROLL_ROT | 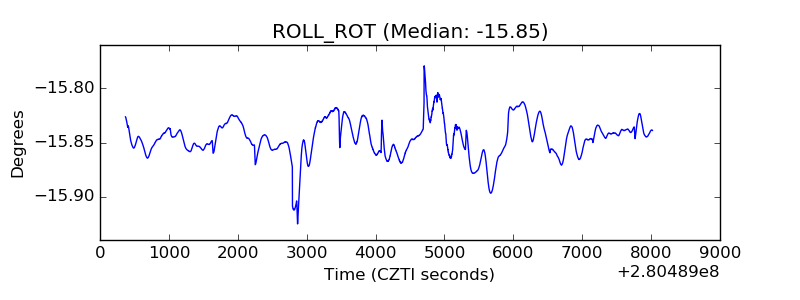 |
| _Roll_DEC | 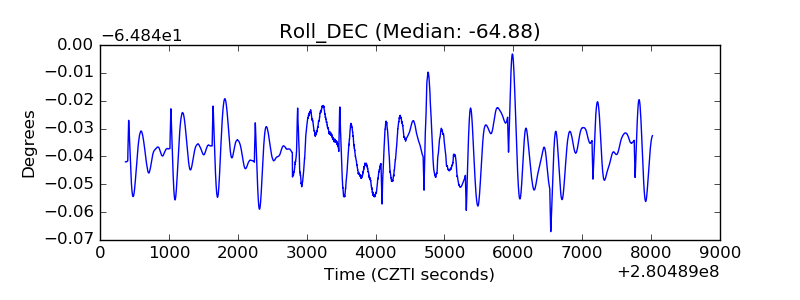 |
| _Roll_RA | 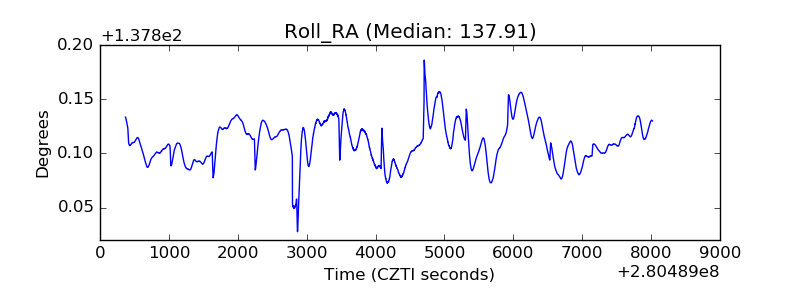 |
| Veto Counter | 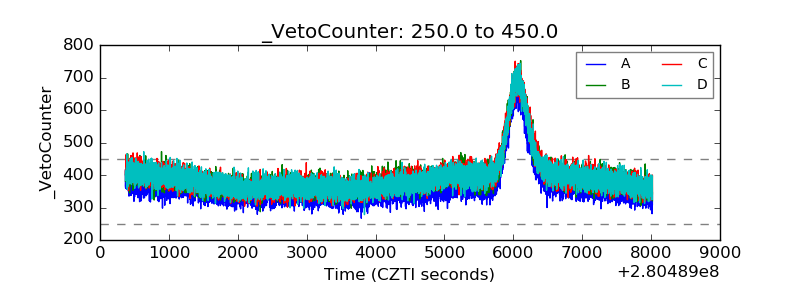 |