| Param | Original file | Final file |
|---|---|---|
| Filename | modeM0/AS1A05_206T01_9000002528_17027cztM0_level2.evt | modeM0/AS1A05_206T01_9000002528_17027cztM0_level2_quad_clean.evt |
| Size (bytes) | 193,582,080 | 30,876,480 |
| Size | 184.6 MB | 29.4 MB |
| Events in quadrant A | 1,468,849 | 182,298 |
| Events in quadrant B | 1,672,517 | 189,684 |
| Events in quadrant C | 1,244,969 | 187,927 |
| Events in quadrant D | 1,296,089 | 186,843 |
| Mode SS | |||
|---|---|---|---|
| Quadrant | BADHDUFLAG | Total packets | Discarded packets |
| A | 0 | 52 | 0 |
| B | 0 | 52 | 0 |
| C | 0 | 52 | 0 |
| D | 0 | 52 | 0 |
| Mode M0 | |||
|---|---|---|---|
| Quadrant | BADHDUFLAG | Total packets | Discarded packets |
| A | 0 | 6249 | 0 |
| B | 0 | 6679 | 0 |
| C | 0 | 5364 | 0 |
| D | 0 | 5769 | 0 |
| Quadrant | Total seconds | Saturated seconds | Saturation percentage |
|---|---|---|---|
| A | 2620 | 123 | 4.694656% |
| B | 2621 | 70 | 2.670736% |
| C | 2621 | 7 | 0.267074% |
| D | 2621 | 31 | 1.182755% |
Noise dominated data is calculated using 1-second bins in cleaned event files. If a bin has >2000 counts, and if more than 50% of those come from <1% of pixels, then it is considered to be noise-dominated and hence unusable.
| Quadrant | # 1 sec bins | Bins with >0 counts | Bins with >2000 counts | High rate bins dominated by noise | Noise dominated (total time) | Noise dominated (detector-on time) | Marked lightcurve |
|---|---|---|---|---|---|---|---|
| A | 2621 | 2621 | 106 | 106 | 4.04% | 4.04% | 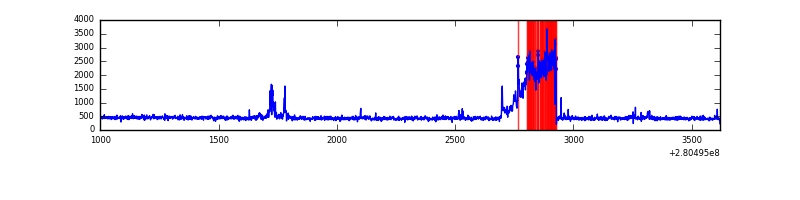 |
| B | 2622 | 2622 | 44 | 44 | 1.68% | 1.68% | 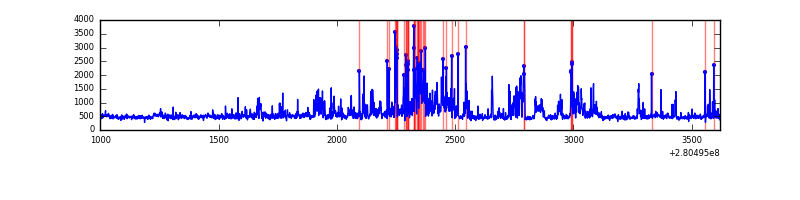 |
| C | 2622 | 2622 | 0 | 0 | 0.00% | 0.00% | 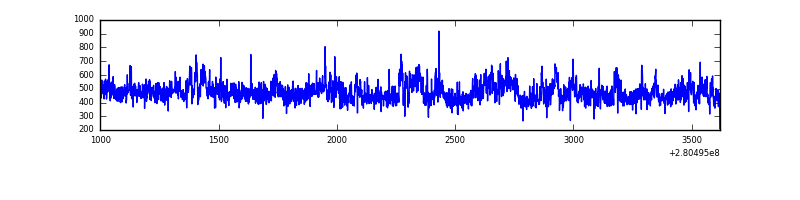 |
| D | 2622 | 2622 | 22 | 22 | 0.84% | 0.84% | 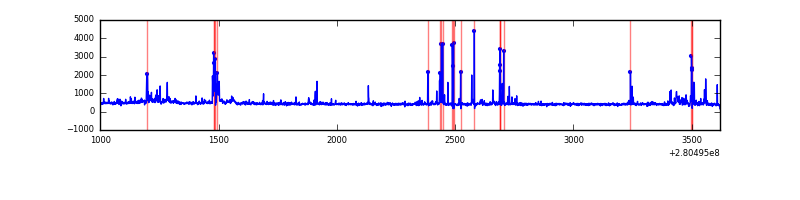 |
Top three noisy pixels from each quadrant. If the there are fewer than three noisy pixels in the level2.evt file, extra rows are filled as -1
| Pixel properties | Quadrant properties | ||||||
|---|---|---|---|---|---|---|---|
| Quadrant | DetID | PixID | Counts | Sigma | Mean | Median | Sigma |
| A | 15 | 174 | 335491 | 5631.88 | 287 | 281 | 59.5 |
| A | 4 | 2 | 24471 | 406.42 | 287 | 281 | 59.5 |
| A | 12 | 189 | 4040 | 63.16 | 287 | 281 | 59.5 |
| B | 15 | 35 | 144674 | 2572.25 | 287 | 280 | 56.1 |
| B | 7 | 220 | 138984 | 2470.88 | 287 | 280 | 56.1 |
| B | 5 | 172 | 55081 | 976.23 | 287 | 280 | 56.1 |
| C | 3 | 233 | 108085 | 1639.47 | 276 | 277 | 65.8 |
| C | 14 | 238 | 42285 | 638.83 | 276 | 277 | 65.8 |
| C | 7 | 247 | 15345 | 229.14 | 276 | 277 | 65.8 |
| D | 1 | 52 | 80188 | 1144.49 | 282 | 271 | 69.8 |
| D | 10 | 70 | 73259 | 1045.26 | 282 | 271 | 69.8 |
| D | 2 | 33 | 37230 | 529.28 | 282 | 271 | 69.8 |
Histogram calculated using DETX and DETY for each event in the final _common_clean file
| Quadrant A |  |
 |
Quadrant B |
|---|---|---|---|
| Quadrant D |  |
 |
Quadrant C |
| Plot type | Count rate plots | Images |
|---|---|---|
| Comparison with Poisson distribution Blue bars denote a histogram of data divided into 1 sec bins. Red curve is a Poisson curve with rate = median count rate of data. |
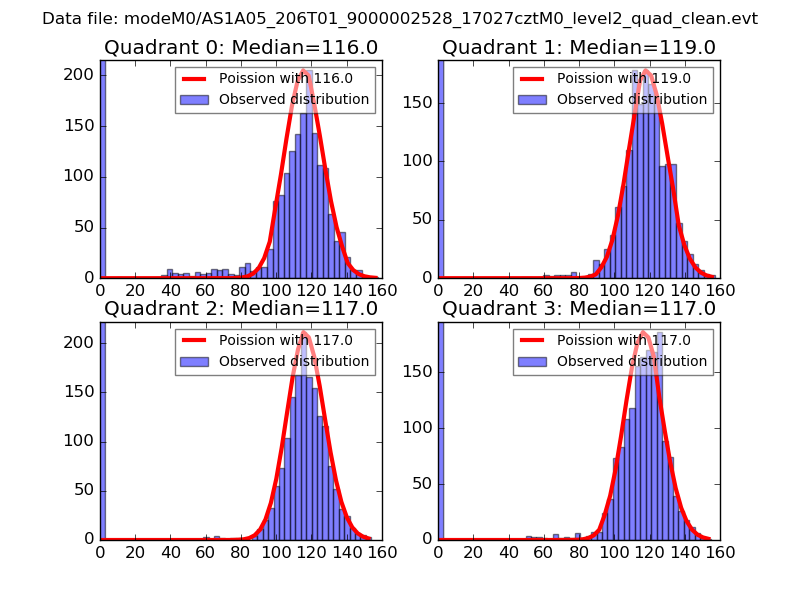 |
 |
| Quadrant-wise count rates Data is divided into 100 sec bins |
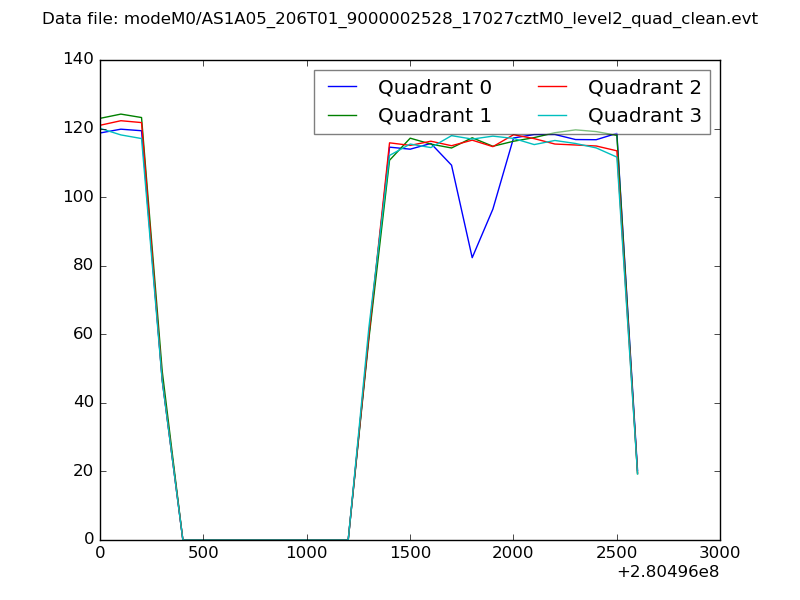 |
|
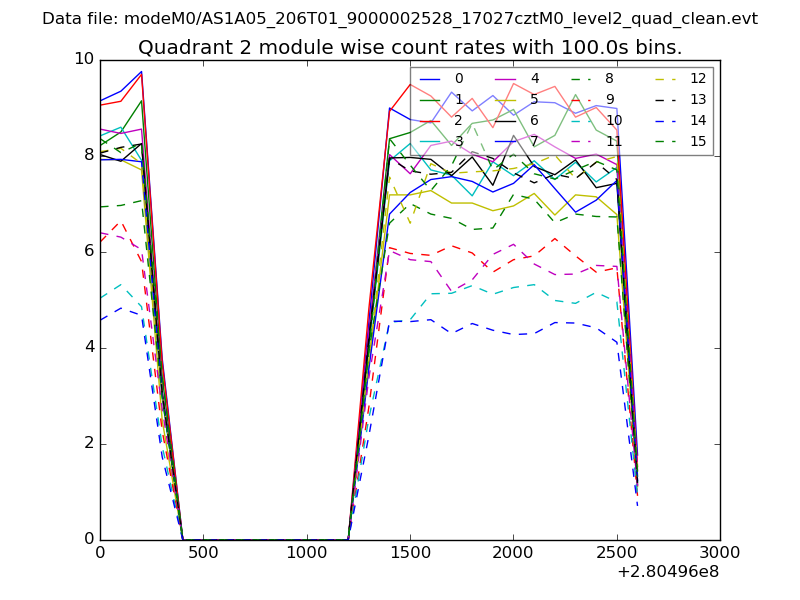
| Module-wise count rates for Quadrant A Data is divided into 100 sec bins |
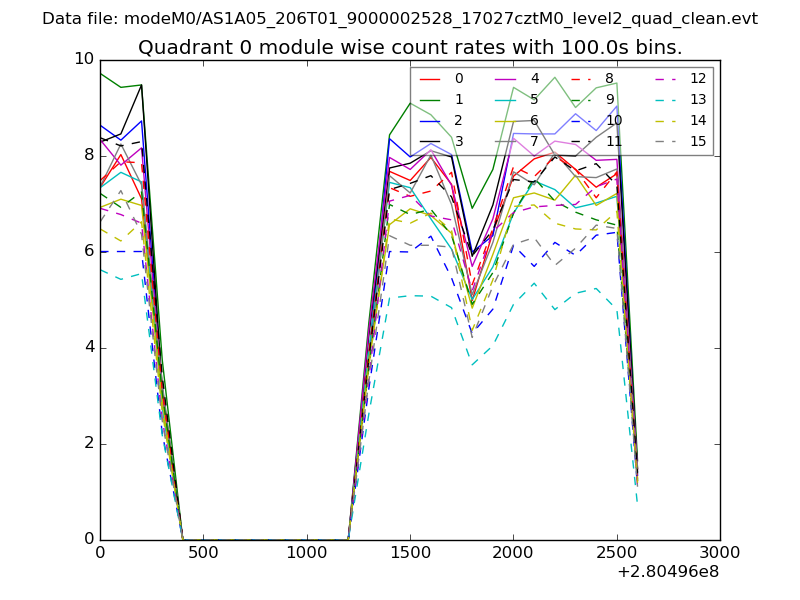 |
 |
| Module-wise count rates for Quadrant B Data is divided into 100 sec bins |
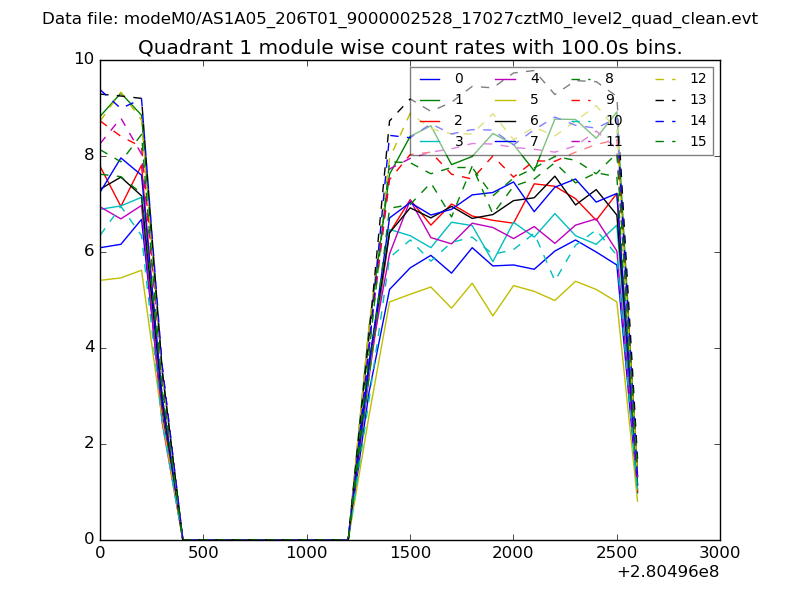 |
 |
| Module-wise count rates for Quadrant C Data is divided into 100 sec bins |
 |
 |
| Module-wise count rates for Quadrant D Data is divided into 100 sec bins |
 |
 |
| Parameter | Plot |
|---|---|
| CZT HV Monitor | 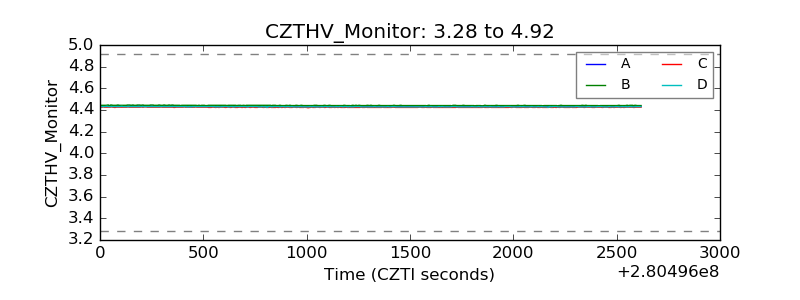 |
| D_VDD |  |
| Temperature 1 |  |
| Veto HV Monitor |  |
| Veto LLD |  |
| Alpha Counter | 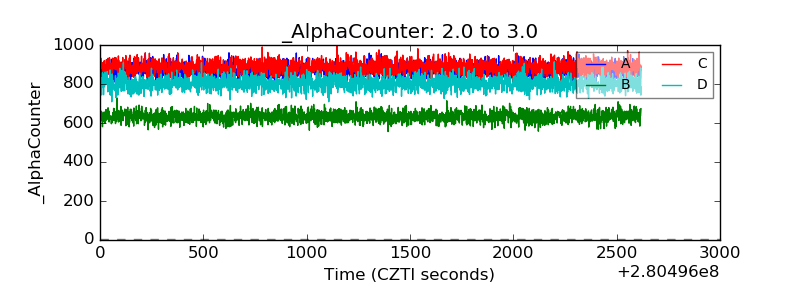 |
| _CPM_Rate | 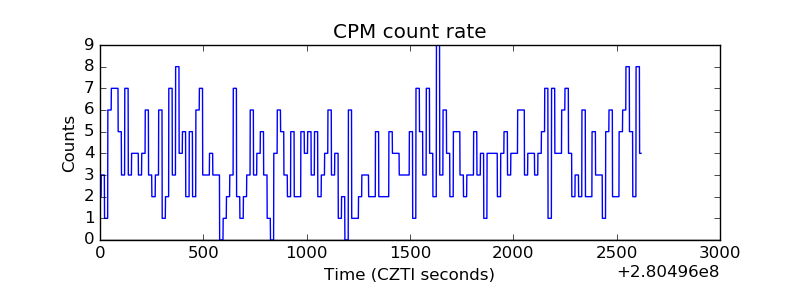 |
| CZT Counter |  |
| +2.5 Volts monitor |  |
| +5 Volts monitor |  |
| _ROLL_ROT |  |
| _Roll_DEC |  |
| _Roll_RA |  |
| Veto Counter | 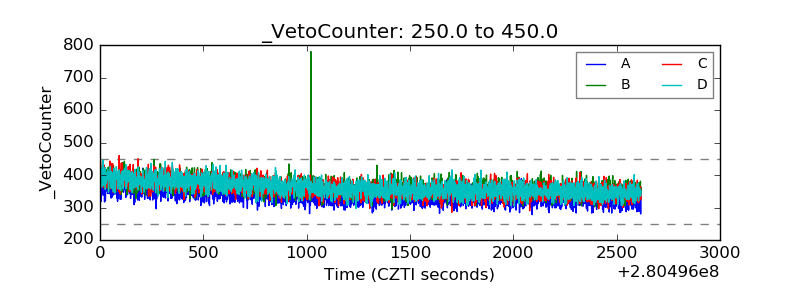 |