| Param | Original file | Final file |
|---|---|---|
| Filename | modeM0/AS1A05_225T02_9000002526_17007cztM0_level2.evt | modeM0/AS1A05_225T02_9000002526_17007cztM0_level2_quad_clean.evt |
| Size (bytes) | 381,864,960 | 99,426,240 |
| Size | 364.2 MB | 94.8 MB |
| Events in quadrant A | 2,304,949 | 685,158 |
| Events in quadrant B | 2,520,079 | 700,135 |
| Events in quadrant C | 2,901,242 | 664,187 |
| Events in quadrant D | 3,512,138 | 624,905 |
| Mode M9 | |||
|---|---|---|---|
| Quadrant | BADHDUFLAG | Total packets | Discarded packets |
| A | 0 | 14 | 0 |
| B | 0 | 14 | 0 |
| C | 0 | 14 | 0 |
| D | 0 | 14 | 0 |
| Mode SS | |||
|---|---|---|---|
| Quadrant | BADHDUFLAG | Total packets | Discarded packets |
| A | 0 | 96 | 0 |
| B | 0 | 96 | 0 |
| C | 0 | 96 | 0 |
| D | 0 | 96 | 0 |
| Mode M0 | |||
|---|---|---|---|
| Quadrant | BADHDUFLAG | Total packets | Discarded packets |
| A | 0 | 9875 | 1 |
| B | 0 | 10595 | 1 |
| C | 0 | 11750 | 1 |
| D | 0 | 13638 | 1 |
| Quadrant | Total seconds | Saturated seconds | Saturation percentage |
|---|---|---|---|
| A | 4804 | 25 | 0.520400% |
| B | 4804 | 50 | 1.040799% |
| C | 4804 | 74 | 1.540383% |
| D | 4804 | 315 | 6.557036% |
Noise dominated data is calculated using 1-second bins in cleaned event files. If a bin has >2000 counts, and if more than 50% of those come from <1% of pixels, then it is considered to be noise-dominated and hence unusable.
| Quadrant | # 1 sec bins | Bins with >0 counts | Bins with >2000 counts | High rate bins dominated by noise | Noise dominated (total time) | Noise dominated (detector-on time) | Marked lightcurve |
|---|---|---|---|---|---|---|---|
| A | 6130 | 4806 | 0 | 0 | 0.00% | 0.00% | 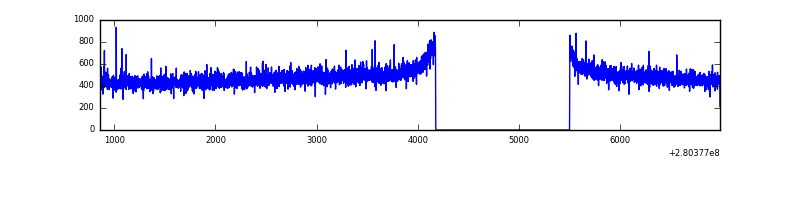 |
| B | 6130 | 4806 | 0 | 0 | 0.00% | 0.00% | 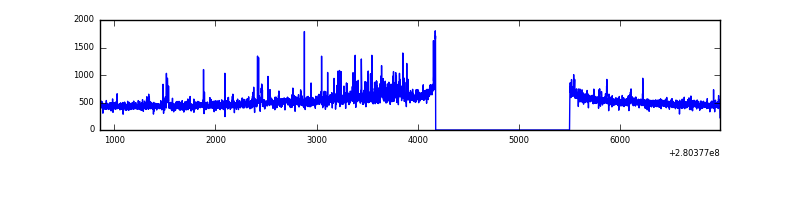 |
| C | 6130 | 4806 | 4 | 4 | 0.07% | 0.08% | 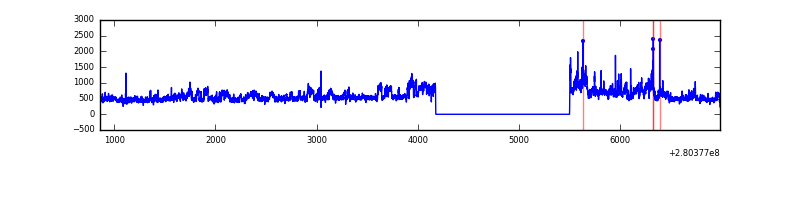 |
| D | 6130 | 4806 | 235 | 235 | 3.83% | 4.89% |  |
Top three noisy pixels from each quadrant. If the there are fewer than three noisy pixels in the level2.evt file, extra rows are filled as -1
| Pixel properties | Quadrant properties | ||||||
|---|---|---|---|---|---|---|---|
| Quadrant | DetID | PixID | Counts | Sigma | Mean | Median | Sigma |
| A | 0 | 226 | 5295 | 39.42 | 599 | 588 | 119.4 |
| A | 12 | 194 | 4421 | 32.1 | 599 | 588 | 119.4 |
| A | 3 | 137 | 3934 | 28.02 | 599 | 588 | 119.4 |
| B | 6 | 36 | 60351 | 544.59 | 597 | 584 | 109.7 |
| B | 0 | 189 | 35404 | 317.27 | 597 | 584 | 109.7 |
| B | 0 | 229 | 33675 | 301.52 | 597 | 584 | 109.7 |
| C | 3 | 233 | 447241 | 3434.5 | 571 | 575 | 130.1 |
| C | 9 | 54 | 123342 | 943.98 | 571 | 575 | 130.1 |
| C | 14 | 238 | 90023 | 687.78 | 571 | 575 | 130.1 |
| D | 1 | 52 | 1362180 | 10194.42 | 558 | 545 | 133.6 |
| D | 2 | 234 | 20144 | 146.74 | 558 | 545 | 133.6 |
| D | 2 | 152 | 12158 | 86.95 | 558 | 545 | 133.6 |
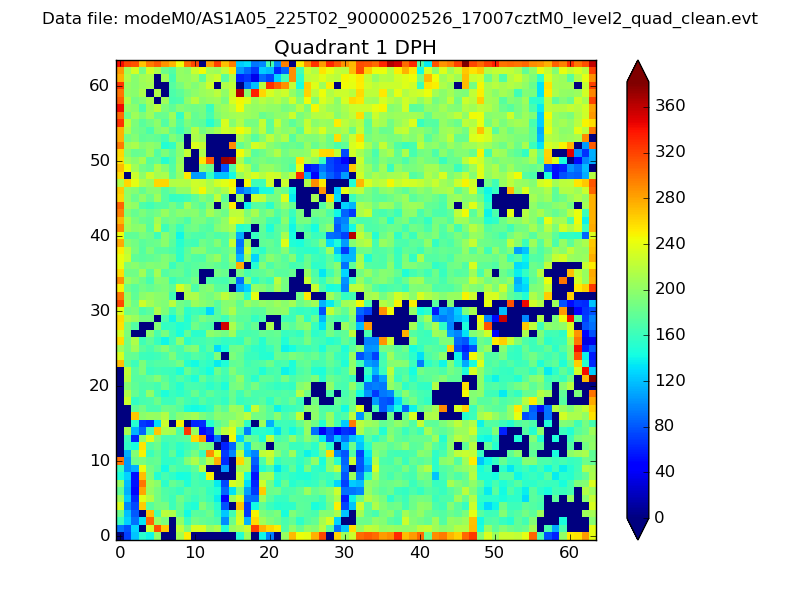
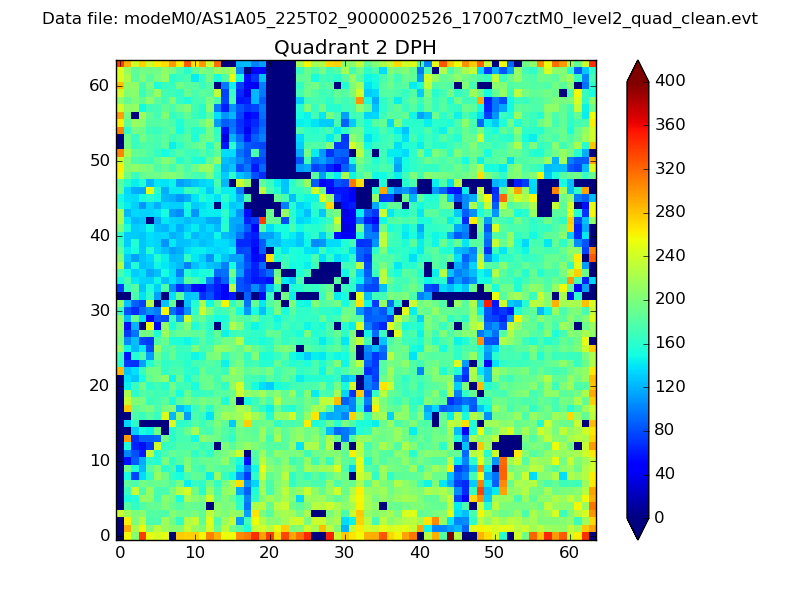
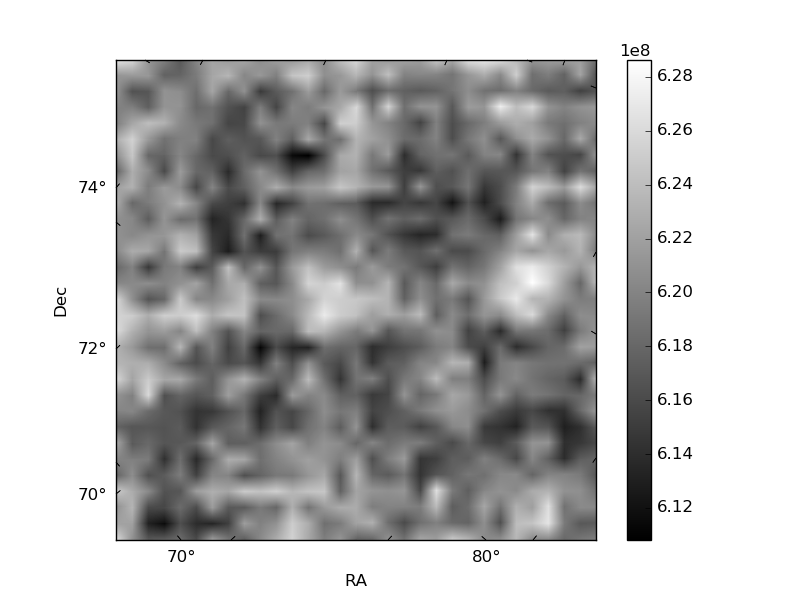
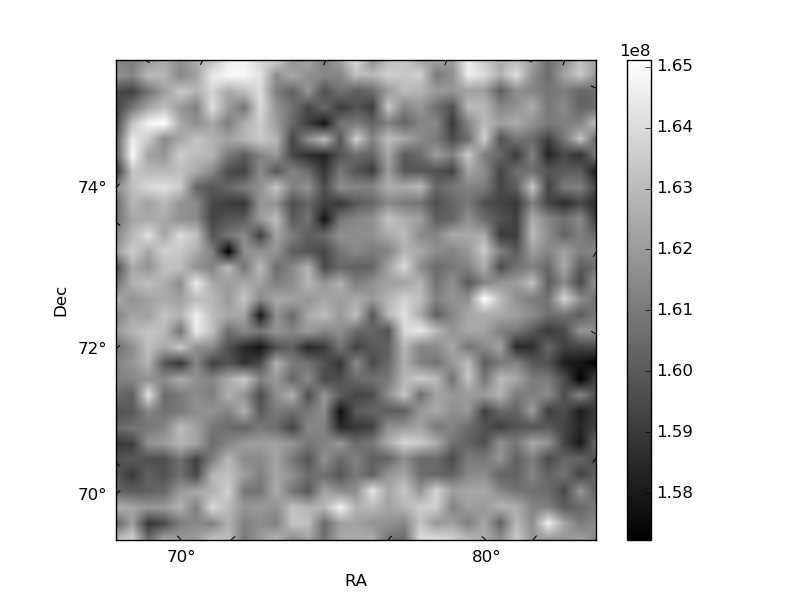
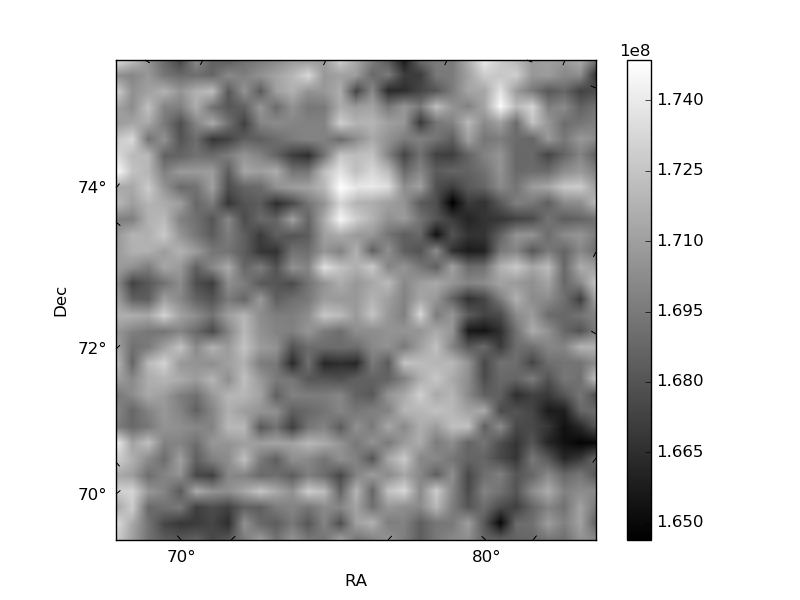
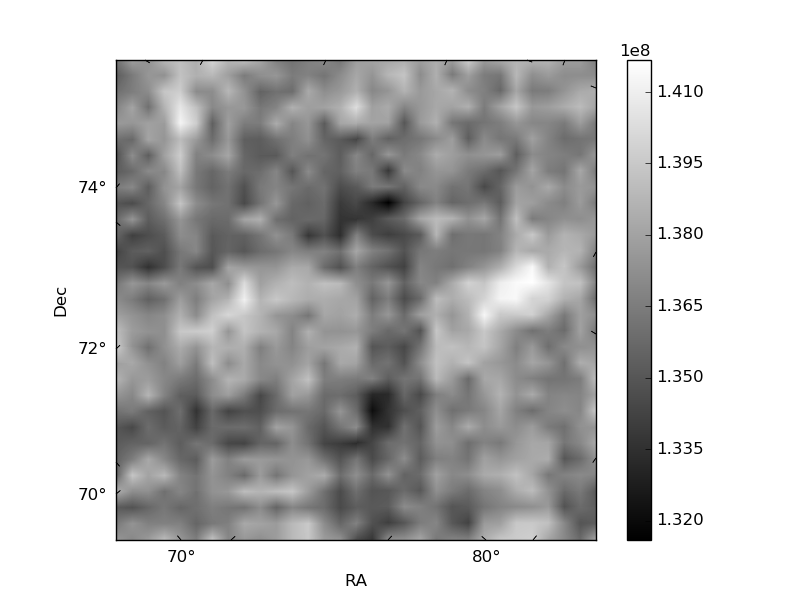
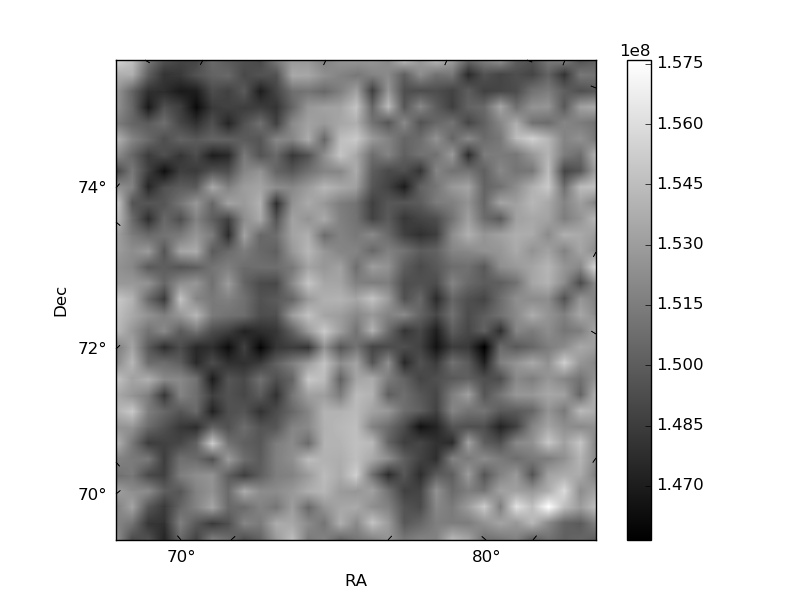
Histogram calculated using DETX and DETY for each event in the final _common_clean file
| Quadrant A | 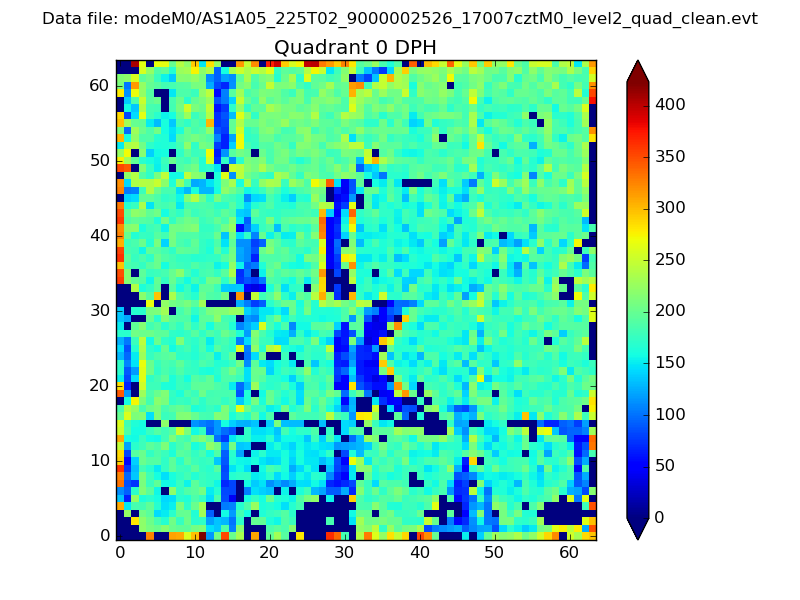 |
 |
Quadrant B |
|---|---|---|---|
| Quadrant D | 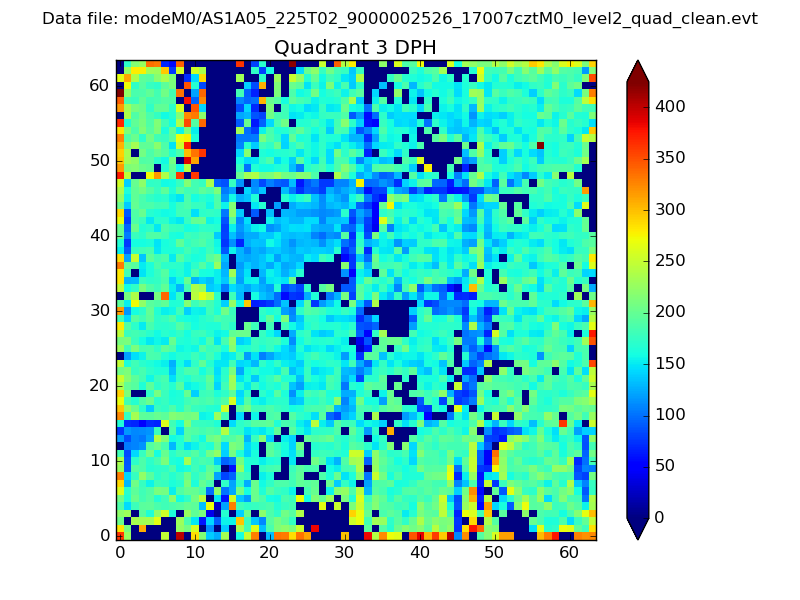 |
 |
Quadrant C |
| Plot type | Count rate plots | Images |
|---|---|---|
| Comparison with Poisson distribution Blue bars denote a histogram of data divided into 1 sec bins. Red curve is a Poisson curve with rate = median count rate of data. |
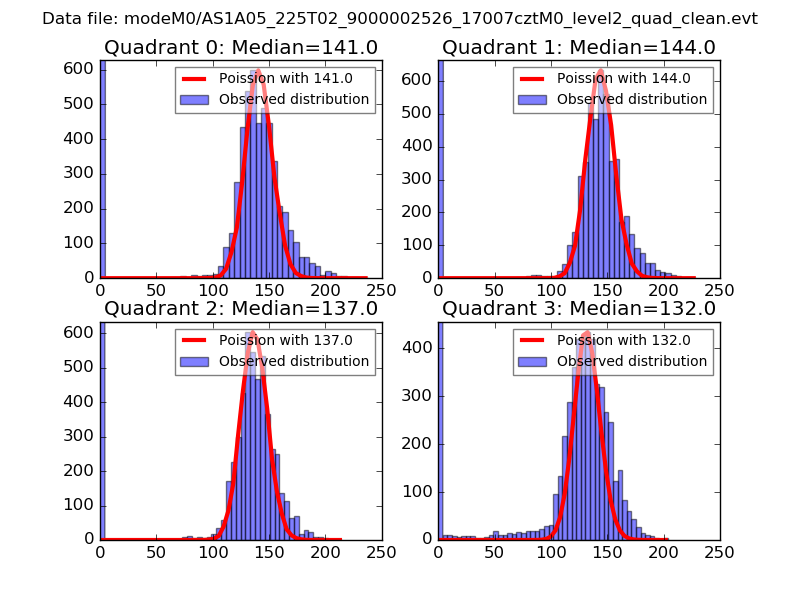 |
 |
| Quadrant-wise count rates Data is divided into 100 sec bins |
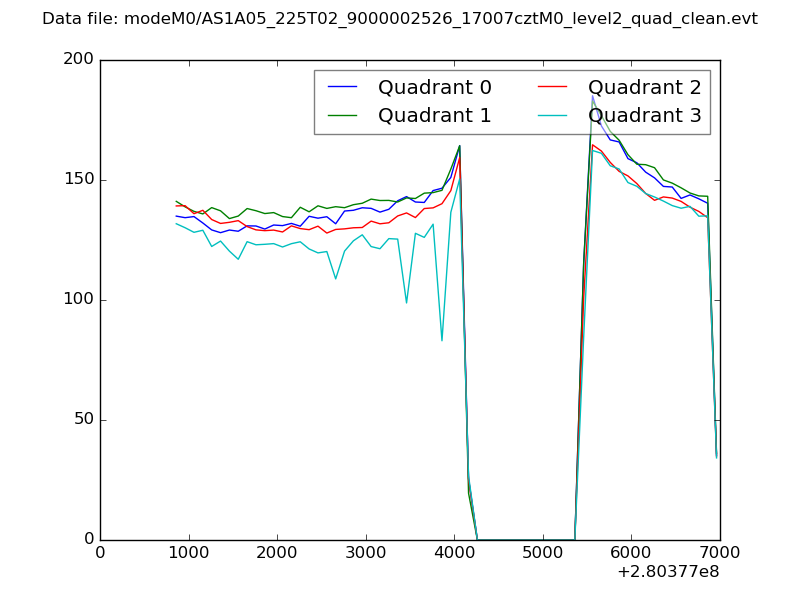 |
|
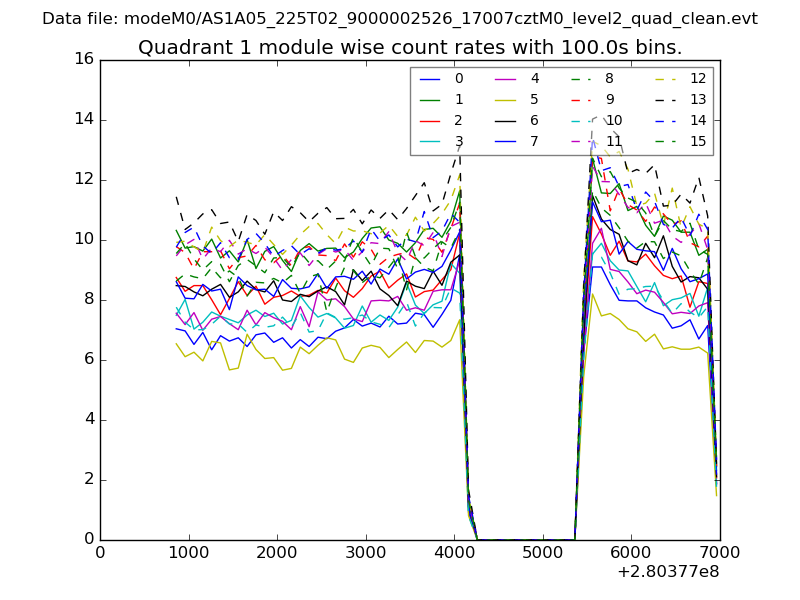
| Module-wise count rates for Quadrant A Data is divided into 100 sec bins |
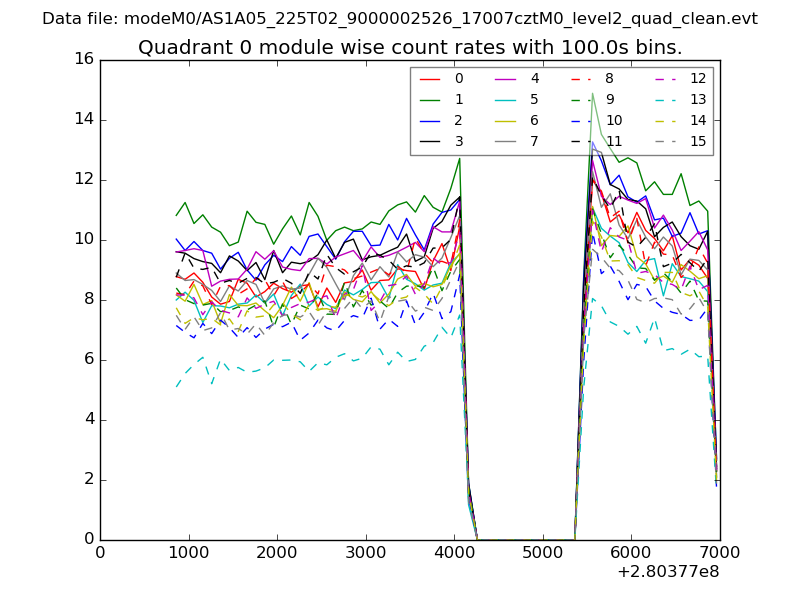 |
 |
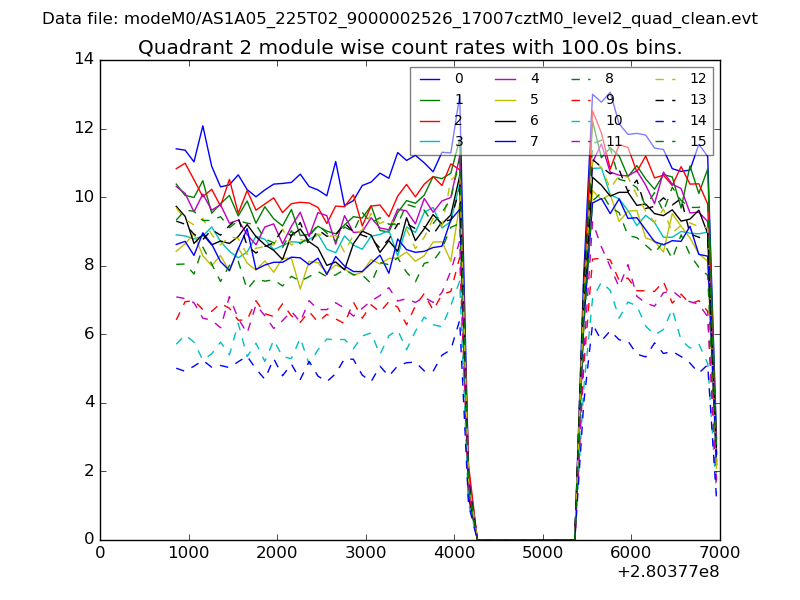
| Module-wise count rates for Quadrant B Data is divided into 100 sec bins |
 |
 |
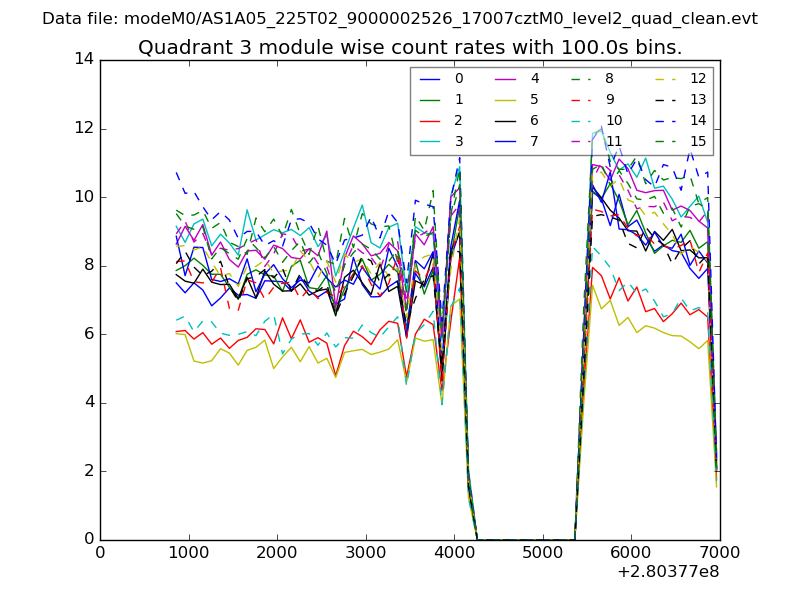
| Module-wise count rates for Quadrant C Data is divided into 100 sec bins |
 |
 |
| Module-wise count rates for Quadrant D Data is divided into 100 sec bins |
 |
 |
| Parameter | Plot |
|---|---|
| CZT HV Monitor | 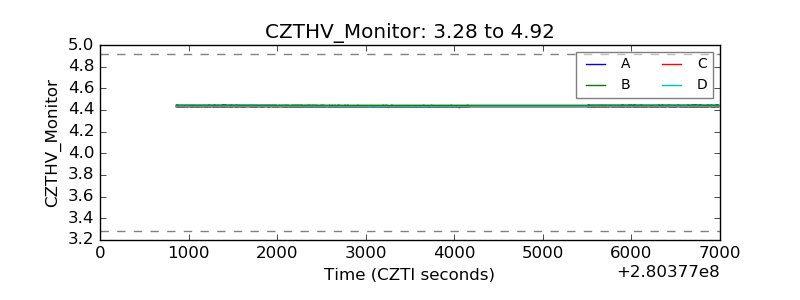 |
| D_VDD | 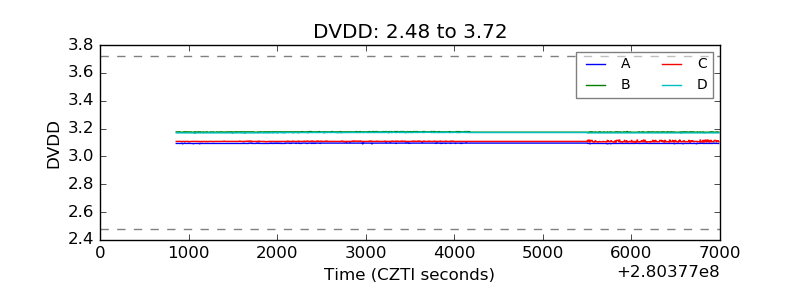 |
| Temperature 1 | 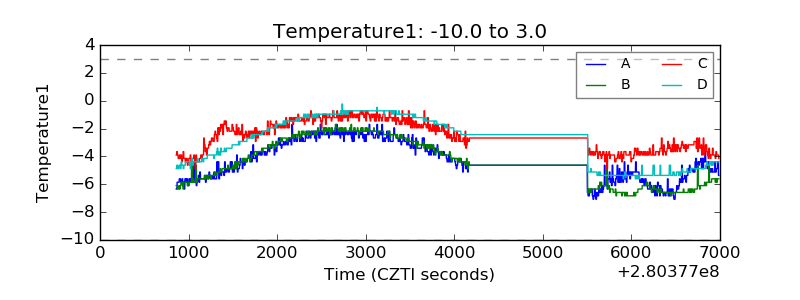 |
| Veto HV Monitor | 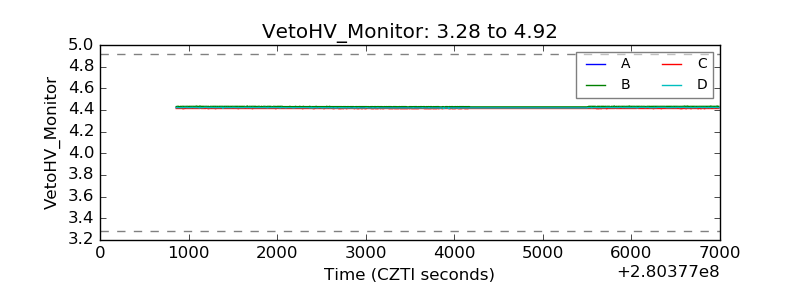 |
| Veto LLD | 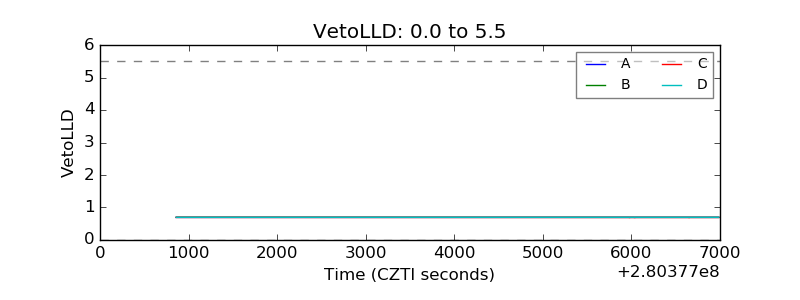 |
| Alpha Counter | 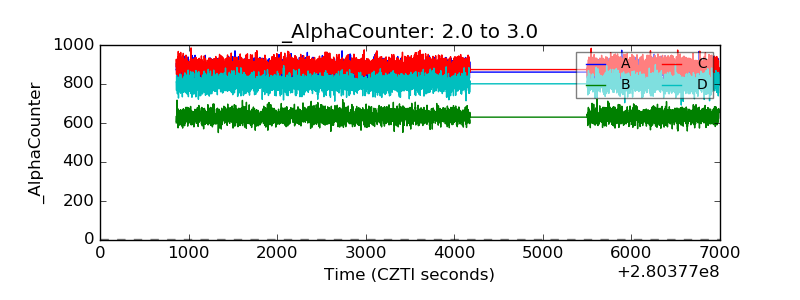 |
| _CPM_Rate | 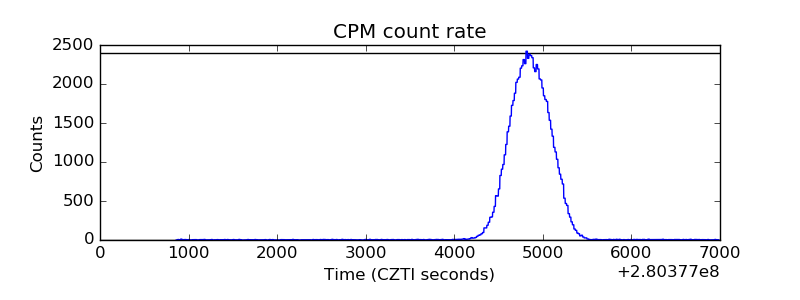 |
| CZT Counter | 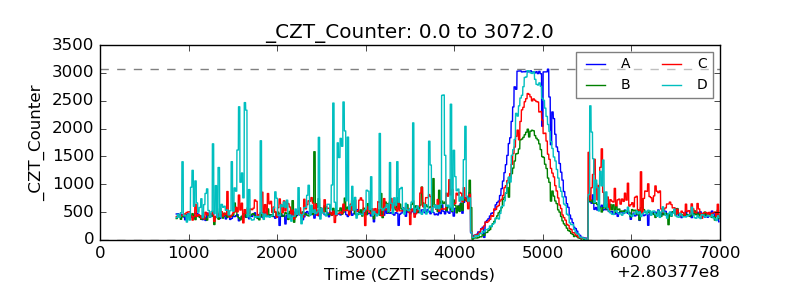 |
| +2.5 Volts monitor |  |
| +5 Volts monitor |  |
| _ROLL_ROT | 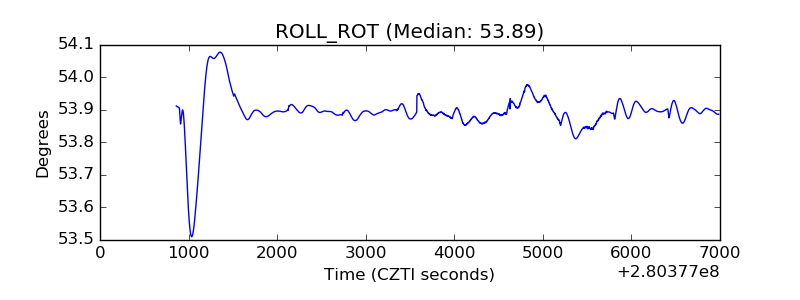 |
| _Roll_DEC | 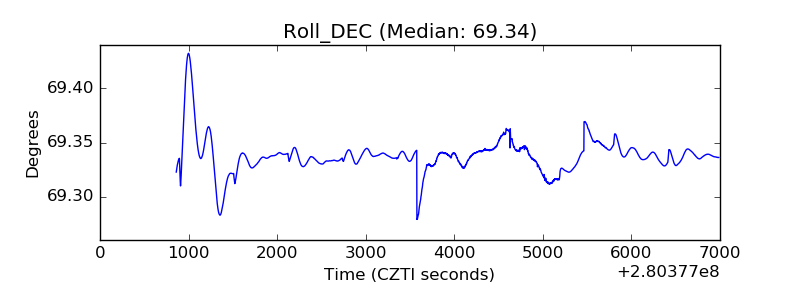 |
| _Roll_RA | 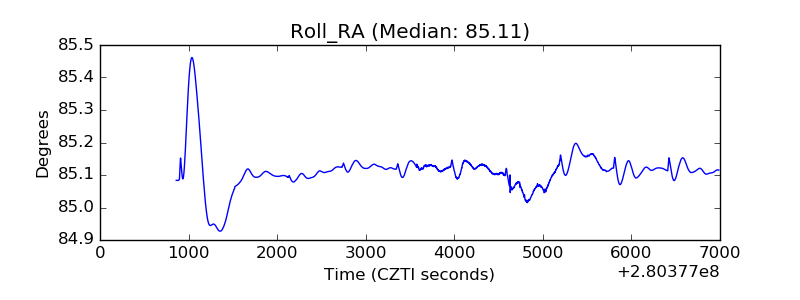 |
| Veto Counter | 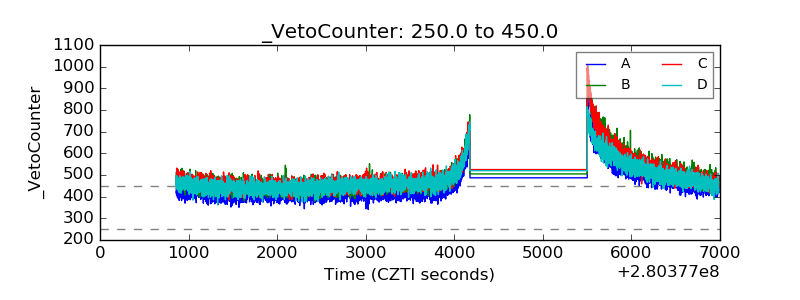 |