| Param | Original file | Final file |
|---|---|---|
| Filename | modeM0/AS1A05_225T02_9000002526_17009cztM0_level2.evt | modeM0/AS1A05_225T02_9000002526_17009cztM0_level2_quad_clean.evt |
| Size (bytes) | 767,364,480 | 202,423,680 |
| Size | 731.8 MB | 193.0 MB |
| Events in quadrant A | 4,894,437 | 1,390,922 |
| Events in quadrant B | 5,251,283 | 1,405,644 |
| Events in quadrant C | 5,612,231 | 1,334,126 |
| Events in quadrant D | 6,788,299 | 1,291,005 |
| Mode M9 | |||
|---|---|---|---|
| Quadrant | BADHDUFLAG | Total packets | Discarded packets |
| A | 0 | 24 | 0 |
| B | 0 | 24 | 0 |
| C | 0 | 24 | 0 |
| D | 0 | 24 | 0 |
| Mode SS | |||
|---|---|---|---|
| Quadrant | BADHDUFLAG | Total packets | Discarded packets |
| A | 0 | 208 | 0 |
| B | 0 | 208 | 0 |
| C | 0 | 208 | 0 |
| D | 0 | 208 | 0 |
| Mode M0 | |||
|---|---|---|---|
| Quadrant | BADHDUFLAG | Total packets | Discarded packets |
| A | 0 | 21161 | 2 |
| B | 0 | 22135 | 2 |
| C | 0 | 23356 | 2 |
| D | 0 | 27096 | 4 |
| Quadrant | Total seconds | Saturated seconds | Saturation percentage |
|---|---|---|---|
| A | 10249 | 91 | 0.887892% |
| B | 10249 | 140 | 1.365987% |
| C | 10249 | 153 | 1.492829% |
| D | 10248 | 346 | 3.376269% |
Noise dominated data is calculated using 1-second bins in cleaned event files. If a bin has >2000 counts, and if more than 50% of those come from <1% of pixels, then it is considered to be noise-dominated and hence unusable.
| Quadrant | # 1 sec bins | Bins with >0 counts | Bins with >2000 counts | High rate bins dominated by noise | Noise dominated (total time) | Noise dominated (detector-on time) | Marked lightcurve |
|---|---|---|---|---|---|---|---|
| A | 12670 | 10251 | 13 | 13 | 0.10% | 0.13% | 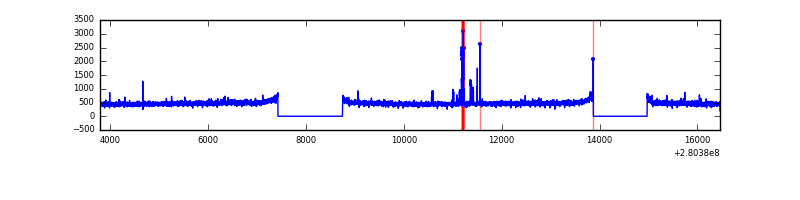 |
| B | 12670 | 10252 | 11 | 11 | 0.09% | 0.11% | 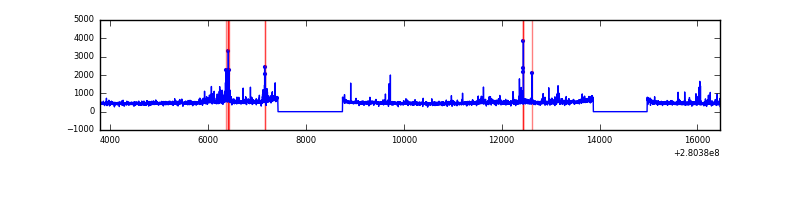 |
| C | 12670 | 10252 | 2 | 2 | 0.02% | 0.02% | 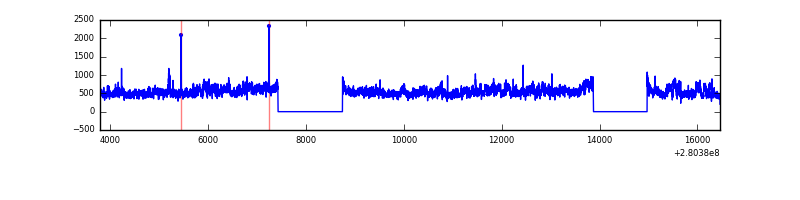 |
| D | 12670 | 10252 | 257 | 257 | 2.03% | 2.51% | 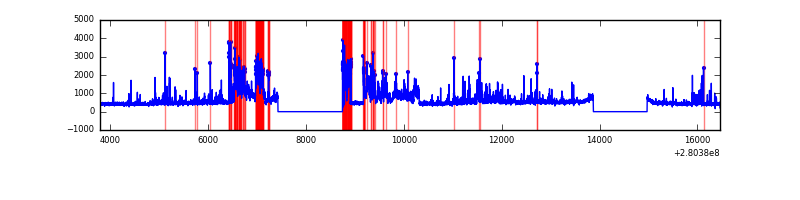 |
Top three noisy pixels from each quadrant. If the there are fewer than three noisy pixels in the level2.evt file, extra rows are filled as -1
| Pixel properties | Quadrant properties | ||||||
|---|---|---|---|---|---|---|---|
| Quadrant | DetID | PixID | Counts | Sigma | Mean | Median | Sigma |
| A | 15 | 174 | 97933 | 392.63 | 1245 | 1221 | 246.3 |
| A | 12 | 189 | 11227 | 40.62 | 1245 | 1221 | 246.3 |
| A | 0 | 226 | 10970 | 39.58 | 1245 | 1221 | 246.3 |
| B | 0 | 197 | 68938 | 294.01 | 1240 | 1210 | 230.4 |
| B | 0 | 189 | 58774 | 249.88 | 1240 | 1210 | 230.4 |
| B | 0 | 244 | 44609 | 188.39 | 1240 | 1210 | 230.4 |
| C | 3 | 233 | 777356 | 2865.96 | 1178 | 1183 | 270.8 |
| C | 14 | 238 | 188153 | 690.37 | 1178 | 1183 | 270.8 |
| C | 9 | 54 | 31372 | 111.47 | 1178 | 1183 | 270.8 |
| D | 1 | 52 | 2169486 | 7630.05 | 1189 | 1156 | 284.2 |
| D | 12 | 110 | 58307 | 201.11 | 1189 | 1156 | 284.2 |
| D | 2 | 234 | 44006 | 150.78 | 1189 | 1156 | 284.2 |
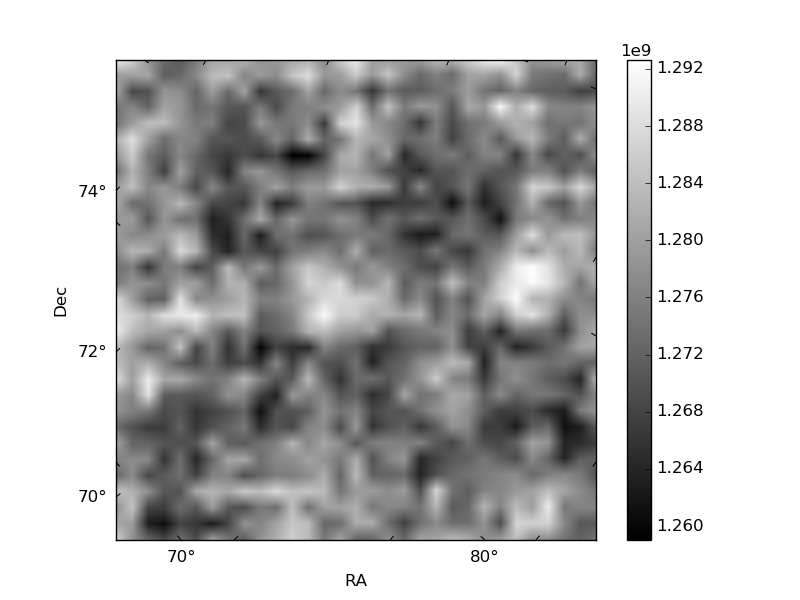
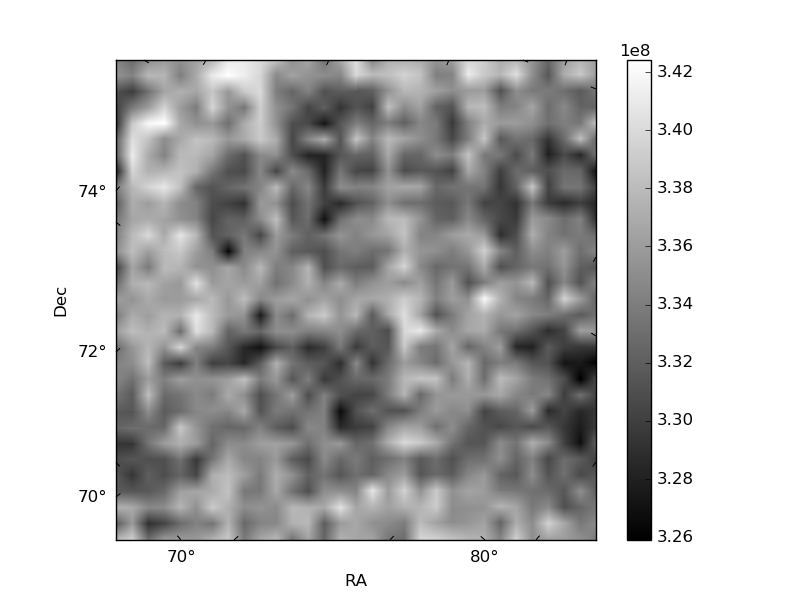
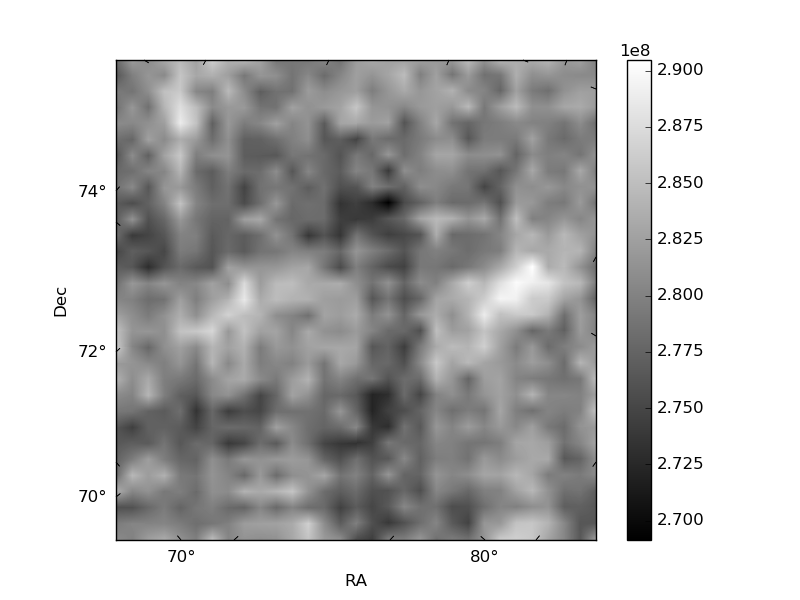
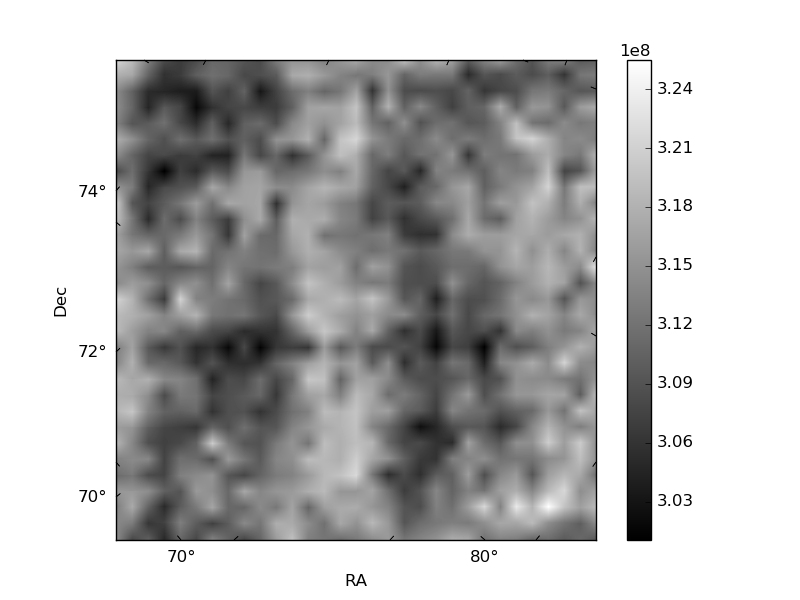
Histogram calculated using DETX and DETY for each event in the final _common_clean file
| Quadrant A | 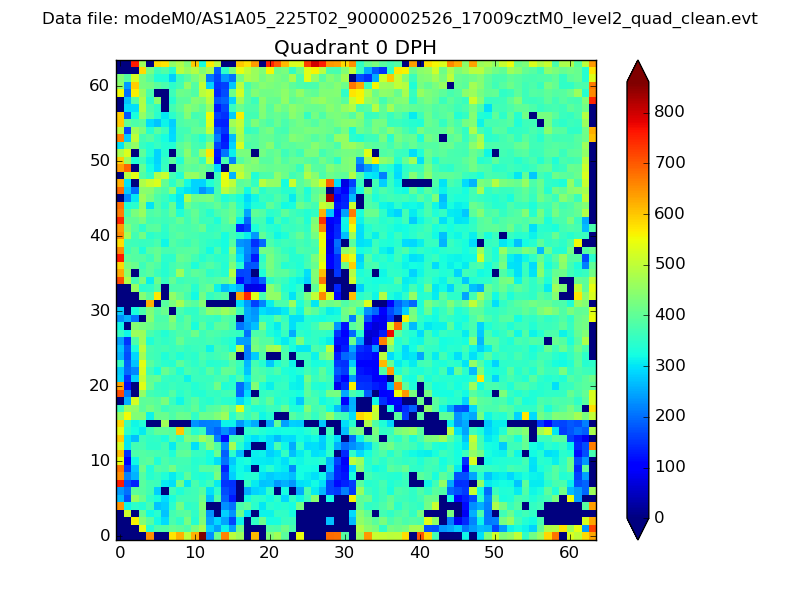 |
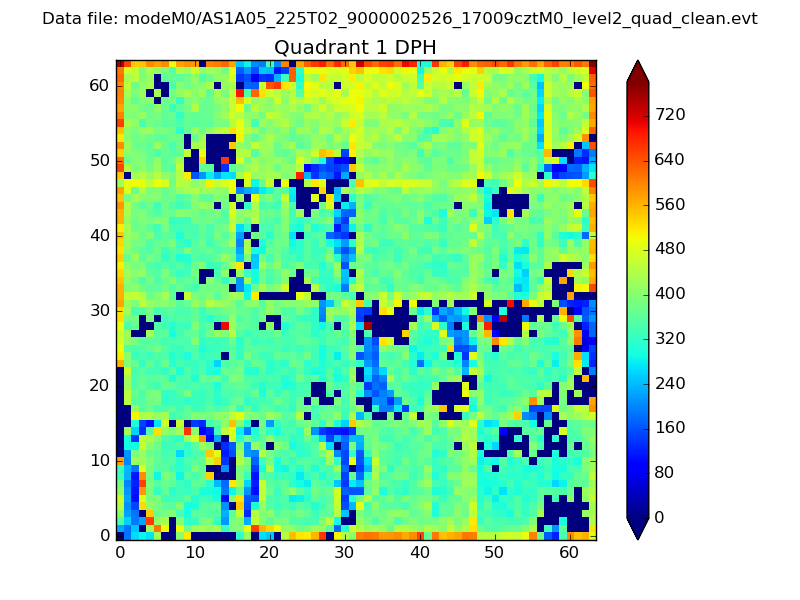 |
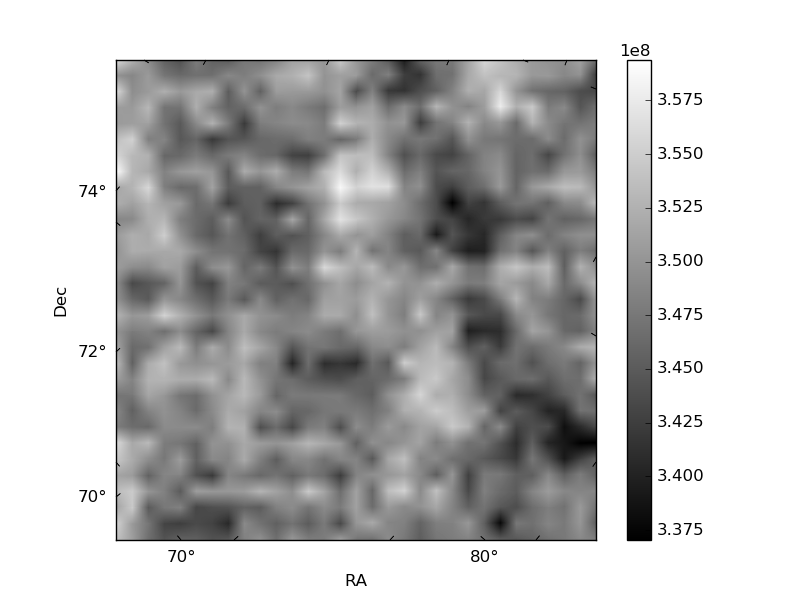
Quadrant B |
|---|---|---|---|
| Quadrant D | 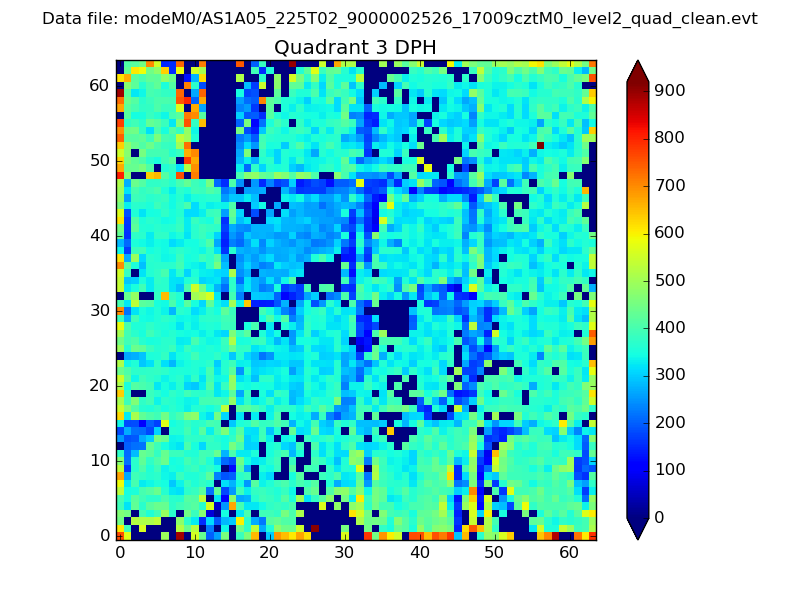 |
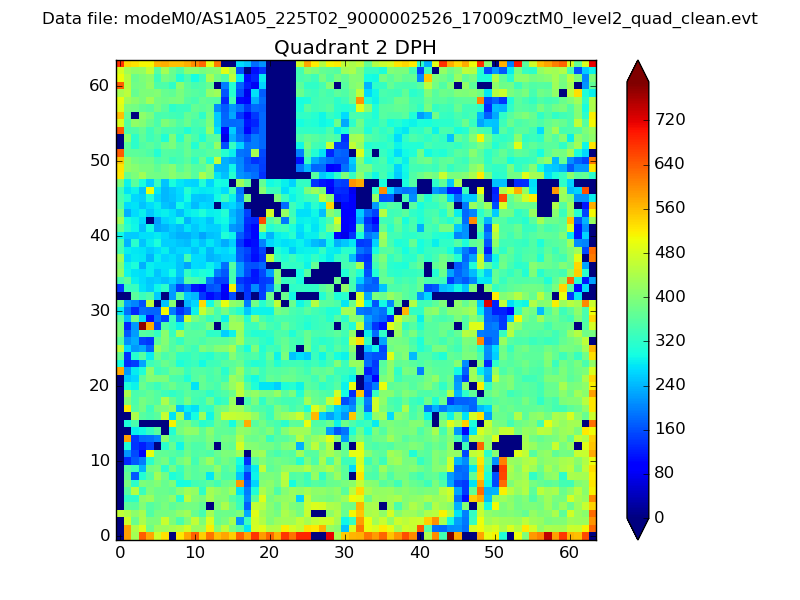 |
Quadrant C |
| Plot type | Count rate plots | Images |
|---|---|---|
| Comparison with Poisson distribution Blue bars denote a histogram of data divided into 1 sec bins. Red curve is a Poisson curve with rate = median count rate of data. |
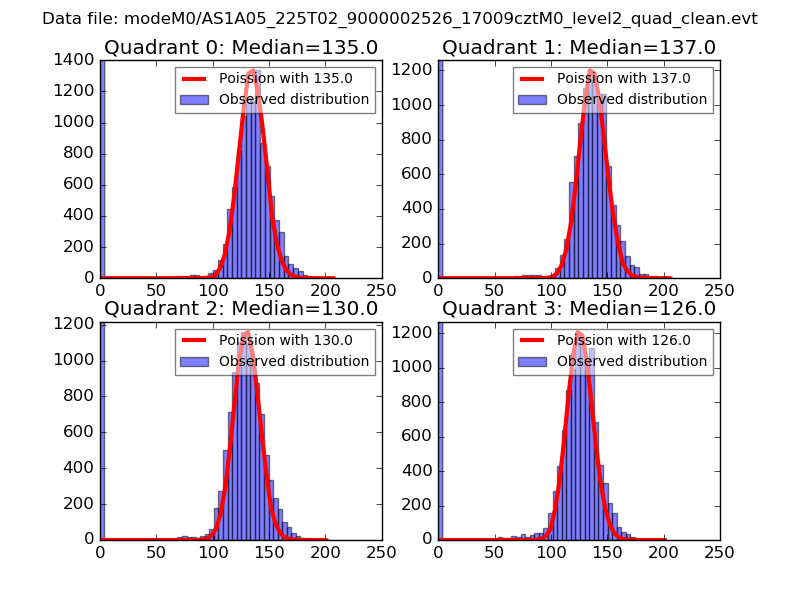 |
 |
| Quadrant-wise count rates Data is divided into 100 sec bins |
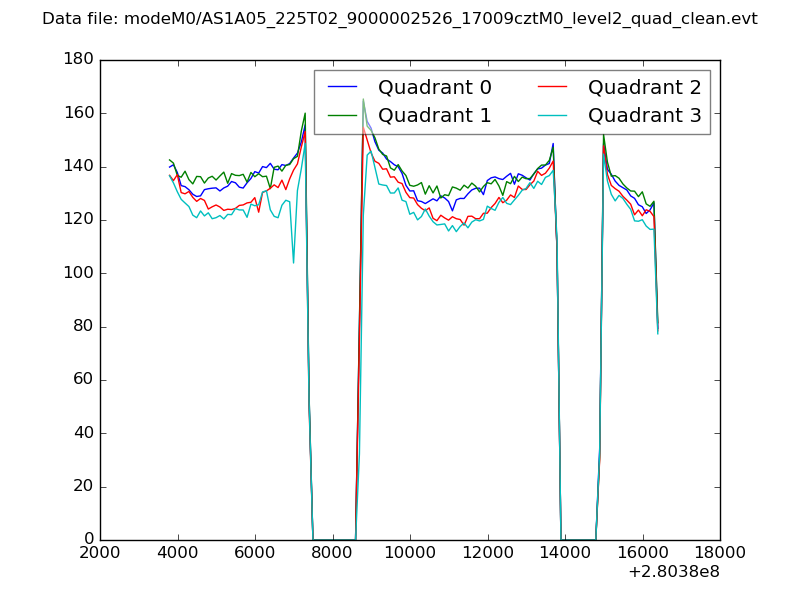 |
|
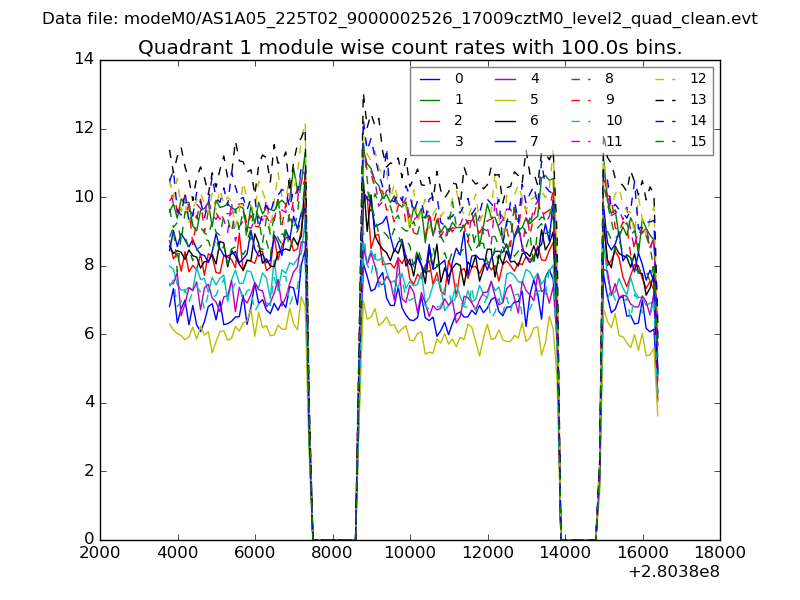
| Module-wise count rates for Quadrant A Data is divided into 100 sec bins |
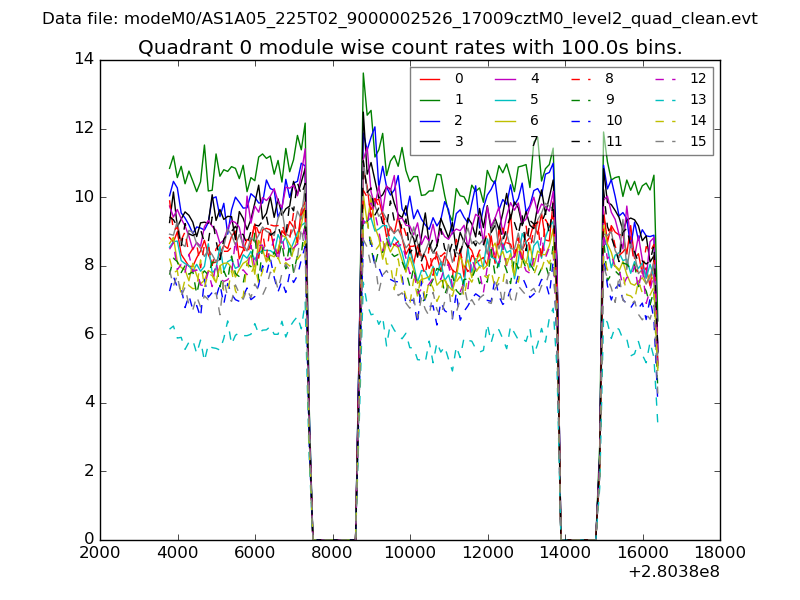 |
 |
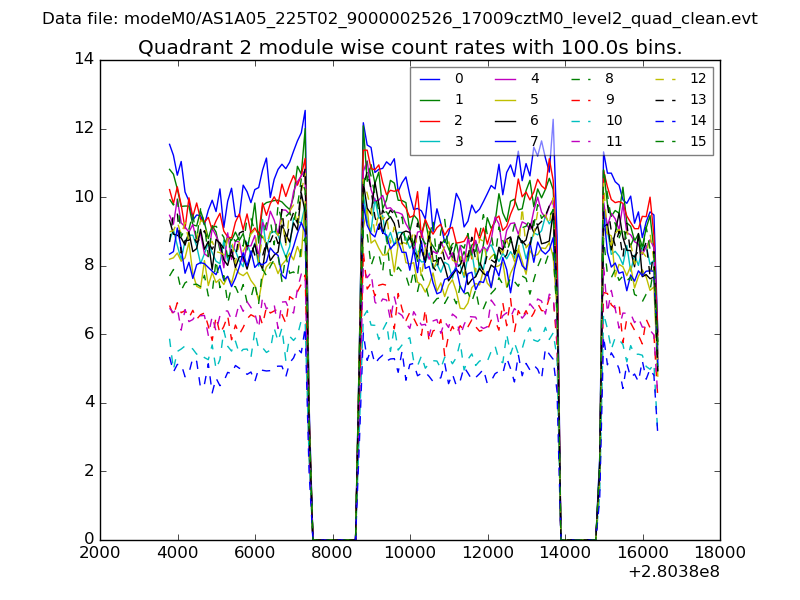
| Module-wise count rates for Quadrant B Data is divided into 100 sec bins |
 |
 |
| Module-wise count rates for Quadrant C Data is divided into 100 sec bins |
 |
 |
| Module-wise count rates for Quadrant D Data is divided into 100 sec bins |
 |
 |
| Parameter | Plot |
|---|---|
| CZT HV Monitor | 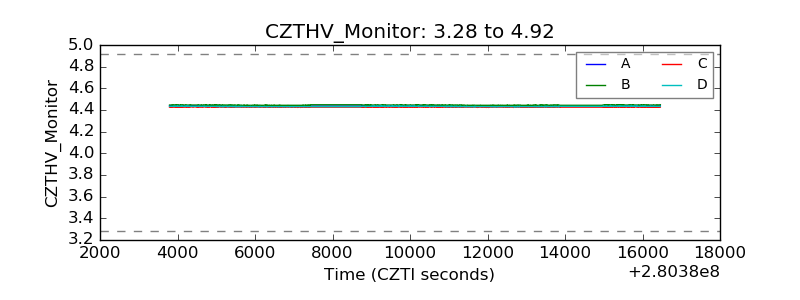 |
| D_VDD | 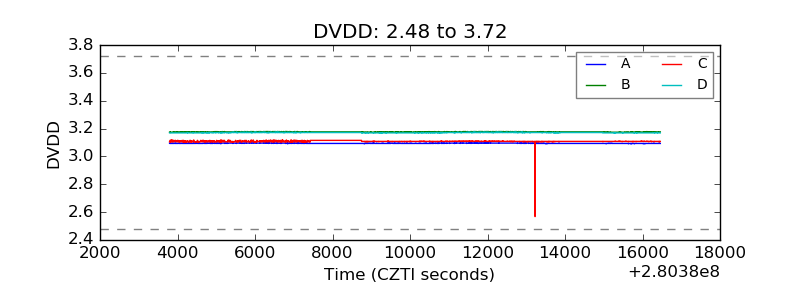 |
| Temperature 1 |  |
| Veto HV Monitor | 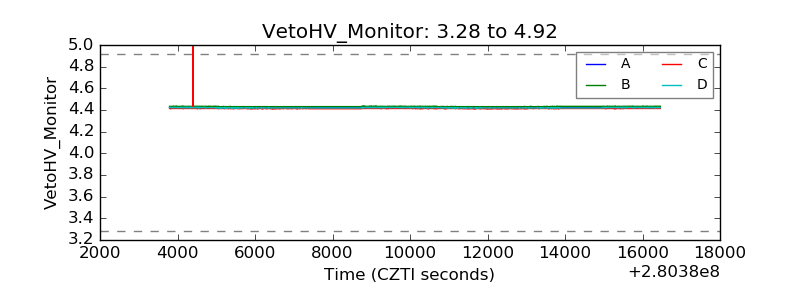 |
| Veto LLD | 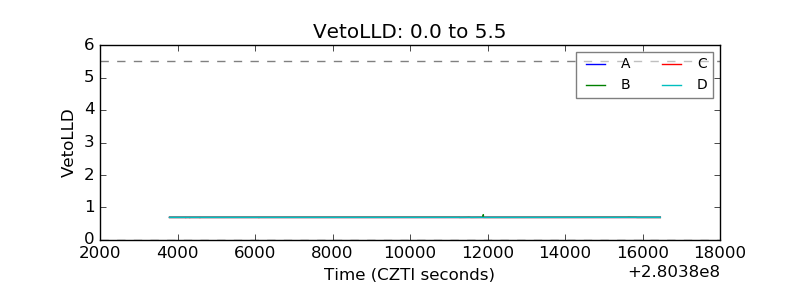 |
| Alpha Counter | 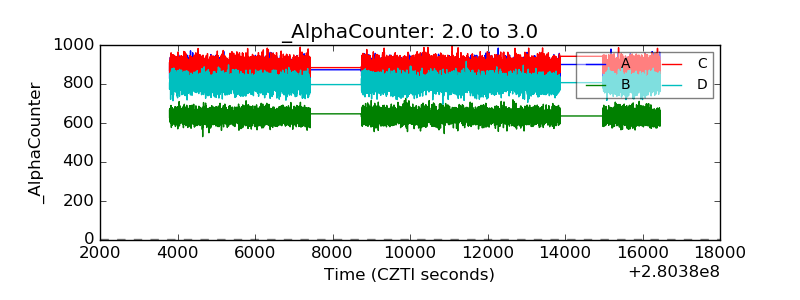 |
| _CPM_Rate | 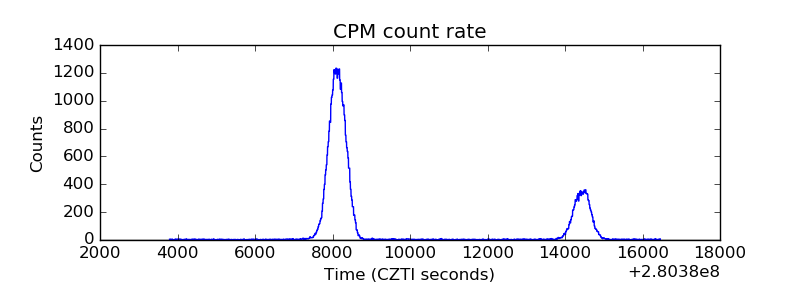 |
| CZT Counter | 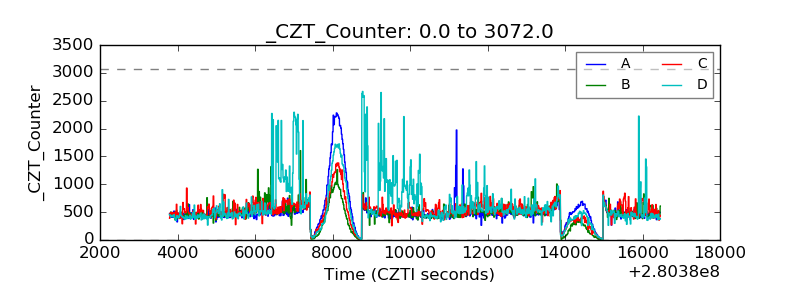 |
| +2.5 Volts monitor |  |
| +5 Volts monitor |  |
| _ROLL_ROT | 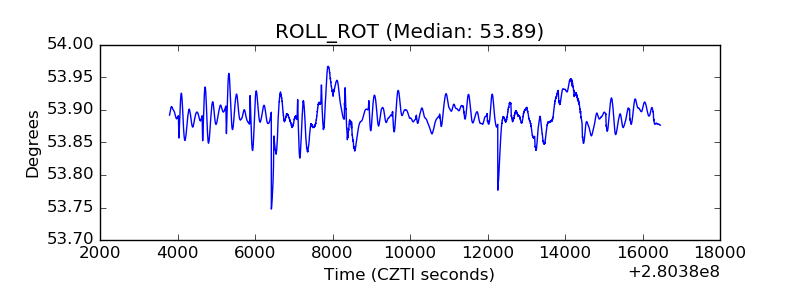 |
| _Roll_DEC |  |
| _Roll_RA | 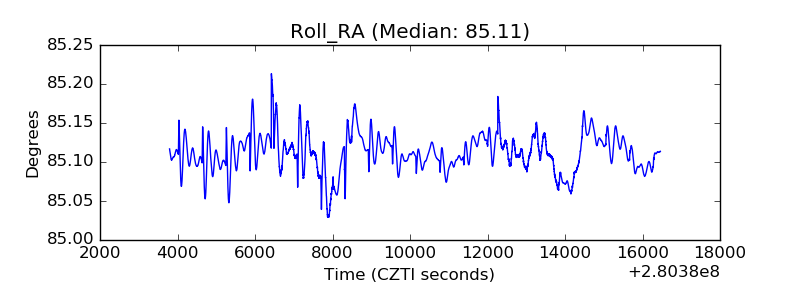 |
| Veto Counter | 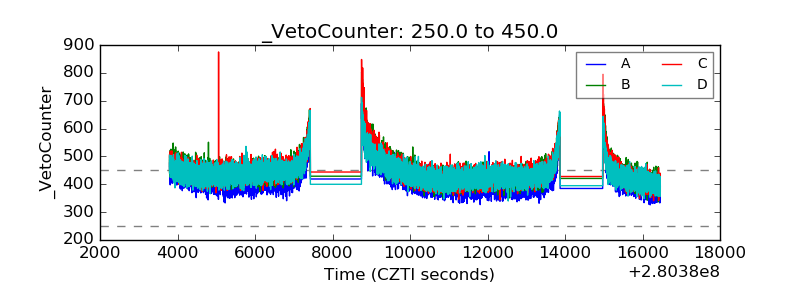 |