| Param | Original file | Final file |
|---|---|---|
| Filename | modeM0/AS1A05_225T02_9000002526_17010cztM0_level2.evt | modeM0/AS1A05_225T02_9000002526_17010cztM0_level2_quad_clean.evt |
| Size (bytes) | 298,019,520 | 77,909,760 |
| Size | 284.2 MB | 74.3 MB |
| Events in quadrant A | 1,984,021 | 528,288 |
| Events in quadrant B | 2,162,747 | 534,171 |
| Events in quadrant C | 2,307,156 | 506,293 |
| Events in quadrant D | 2,286,889 | 496,748 |
| Mode SS | |||
|---|---|---|---|
| Quadrant | BADHDUFLAG | Total packets | Discarded packets |
| A | 0 | 82 | 0 |
| B | 0 | 82 | 0 |
| C | 0 | 82 | 0 |
| D | 0 | 82 | 0 |
| Mode M0 | |||
|---|---|---|---|
| Quadrant | BADHDUFLAG | Total packets | Discarded packets |
| A | 0 | 8724 | 0 |
| B | 0 | 9139 | 0 |
| C | 0 | 9620 | 0 |
| D | 0 | 9649 | 0 |
| Quadrant | Total seconds | Saturated seconds | Saturation percentage |
|---|---|---|---|
| A | 4175 | 1 | 0.023952% |
| B | 4176 | 39 | 0.933908% |
| C | 4176 | 18 | 0.431034% |
| D | 4176 | 94 | 2.250958% |
Noise dominated data is calculated using 1-second bins in cleaned event files. If a bin has >2000 counts, and if more than 50% of those come from <1% of pixels, then it is considered to be noise-dominated and hence unusable.
| Quadrant | # 1 sec bins | Bins with >0 counts | Bins with >2000 counts | High rate bins dominated by noise | Noise dominated (total time) | Noise dominated (detector-on time) | Marked lightcurve |
|---|---|---|---|---|---|---|---|
| A | 4176 | 4176 | 0 | 0 | 0.00% | 0.00% |  |
| B | 4177 | 4177 | 13 | 13 | 0.31% | 0.31% |  |
| C | 4177 | 4177 | 0 | 0 | 0.00% | 0.00% |  |
| D | 4177 | 4177 | 76 | 76 | 1.82% | 1.82% |  |
Top three noisy pixels from each quadrant. If the there are fewer than three noisy pixels in the level2.evt file, extra rows are filled as -1
| Pixel properties | Quadrant properties | ||||||
|---|---|---|---|---|---|---|---|
| Quadrant | DetID | PixID | Counts | Sigma | Mean | Median | Sigma |
| A | 0 | 23 | 108816 | 1110.37 | 479 | 470 | 97.6 |
| A | 15 | 174 | 13932 | 137.96 | 479 | 470 | 97.6 |
| A | 0 | 226 | 11563 | 113.68 | 479 | 470 | 97.6 |
| B | 3 | 64 | 117881 | 1308.48 | 474 | 463 | 89.7 |
| B | 6 | 36 | 45621 | 503.23 | 474 | 463 | 89.7 |
| B | 7 | 220 | 43778 | 482.69 | 474 | 463 | 89.7 |
| C | 3 | 233 | 463006 | 4346.81 | 453 | 457 | 106.4 |
| C | 14 | 238 | 73635 | 687.69 | 453 | 457 | 106.4 |
| C | 13 | 61 | 3187 | 25.66 | 453 | 457 | 106.4 |
| D | 1 | 52 | 380095 | 3386.78 | 458 | 444 | 112.1 |
| D | 4 | 239 | 130019 | 1155.91 | 458 | 444 | 112.1 |
| D | 10 | 70 | 20533 | 179.21 | 458 | 444 | 112.1 |
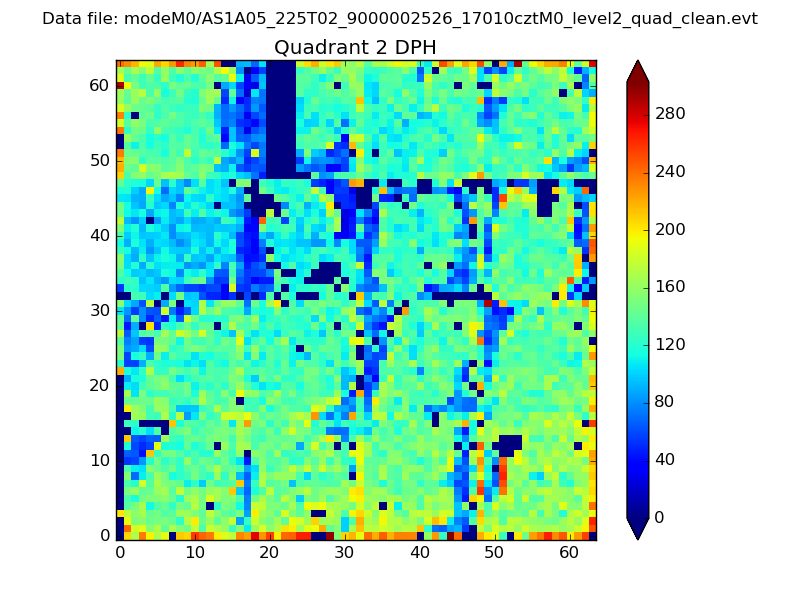
Histogram calculated using DETX and DETY for each event in the final _common_clean file
| Quadrant A | 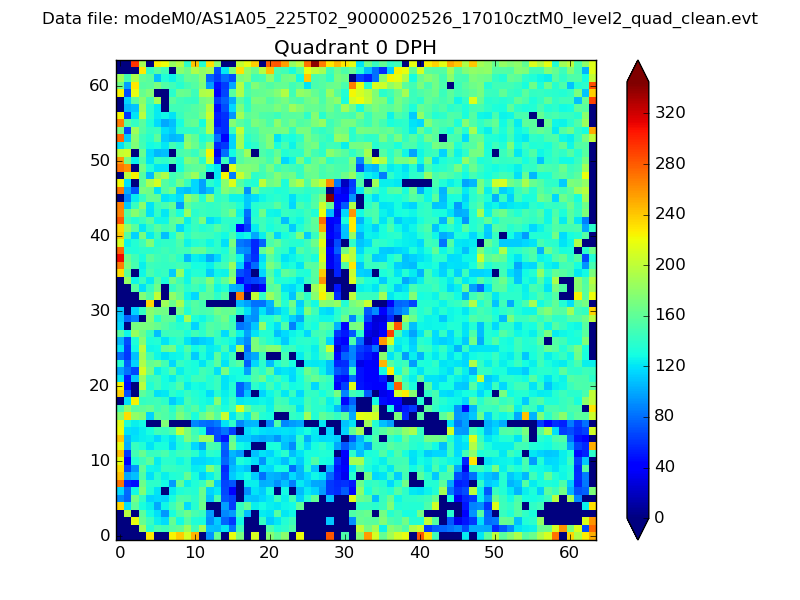 |
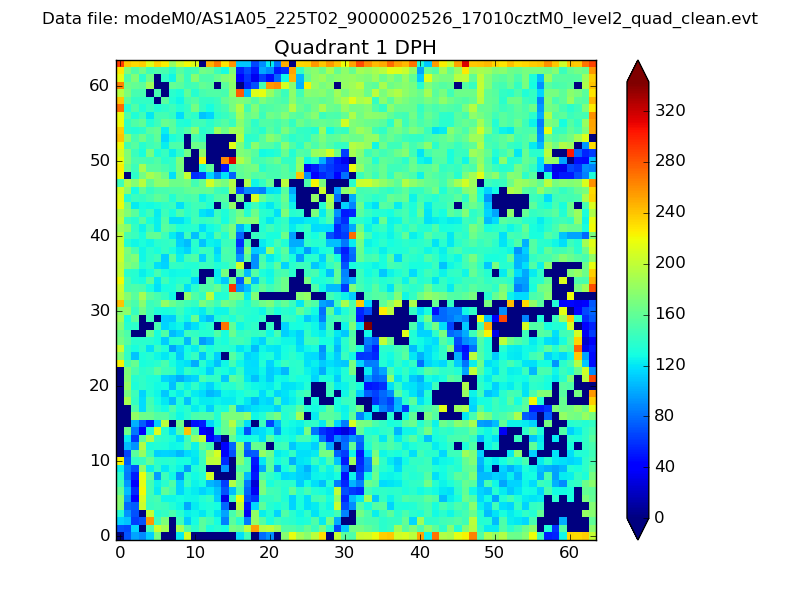 |
Quadrant B |
|---|---|---|---|
| Quadrant D | 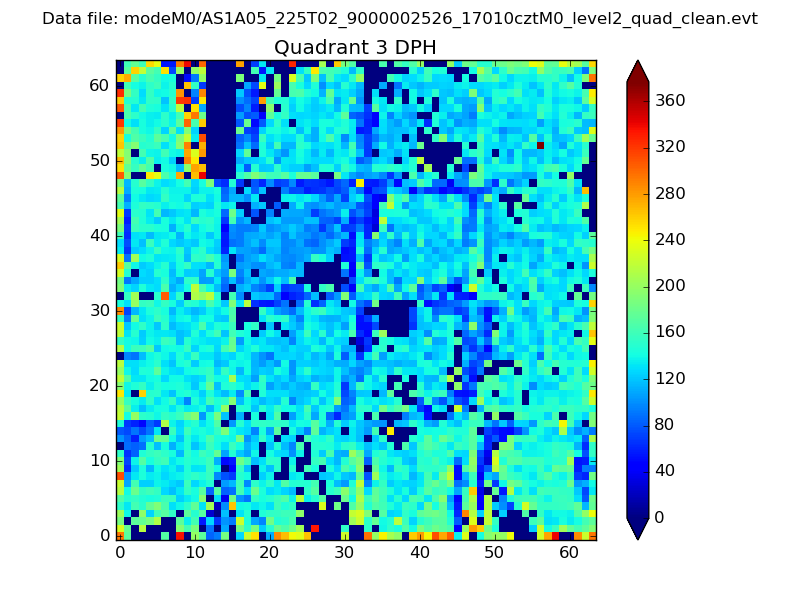 |
 |
Quadrant C |
| Plot type | Count rate plots | Images |
|---|---|---|
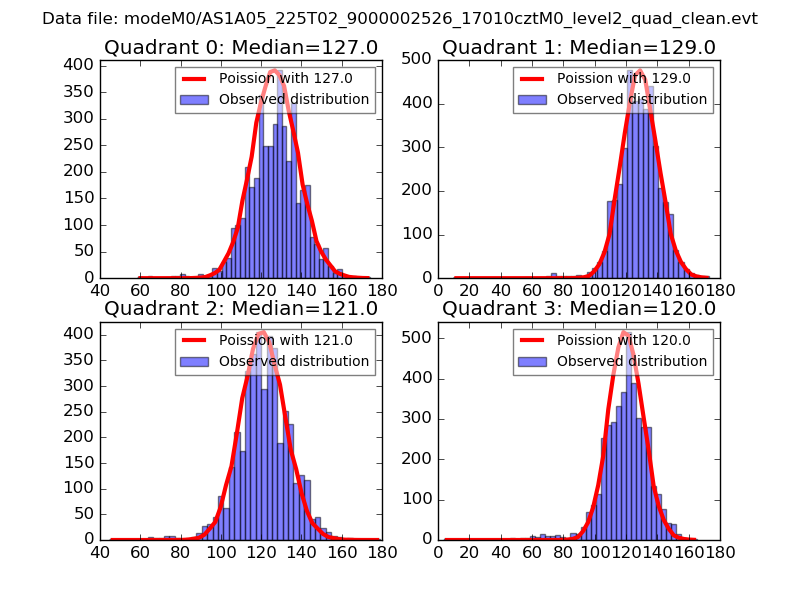
| Comparison with Poisson distribution Blue bars denote a histogram of data divided into 1 sec bins. Red curve is a Poisson curve with rate = median count rate of data. |
 |
 |
| Quadrant-wise count rates Data is divided into 100 sec bins |
 |
|
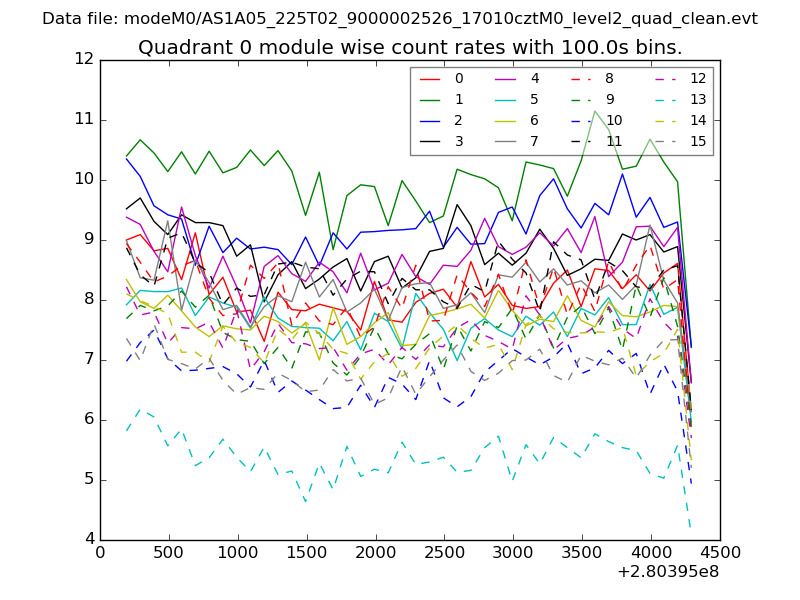
| Module-wise count rates for Quadrant A Data is divided into 100 sec bins |
 |
 |
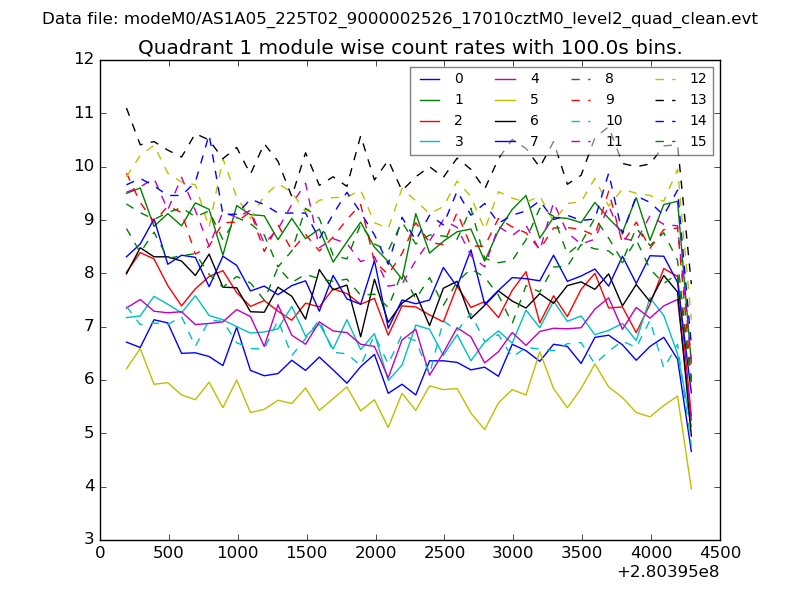
| Module-wise count rates for Quadrant B Data is divided into 100 sec bins |
 |
 |
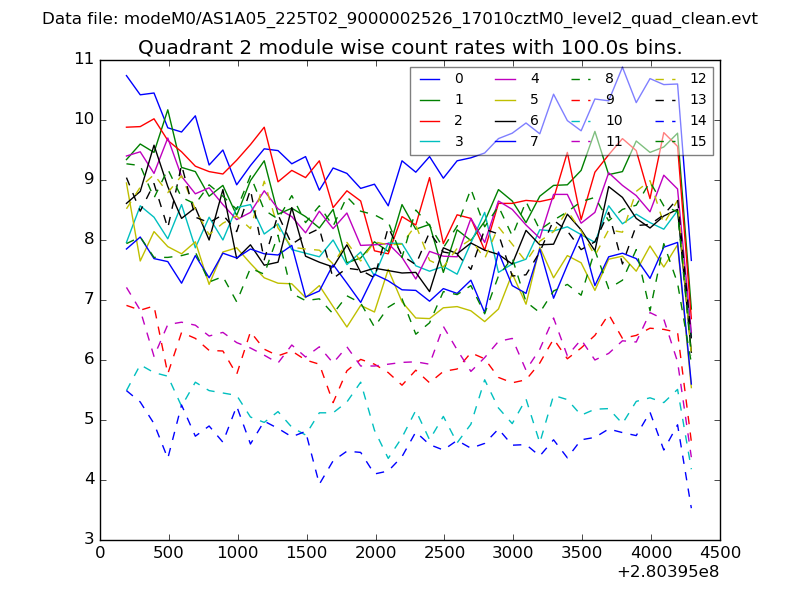
| Module-wise count rates for Quadrant C Data is divided into 100 sec bins |
 |
 |
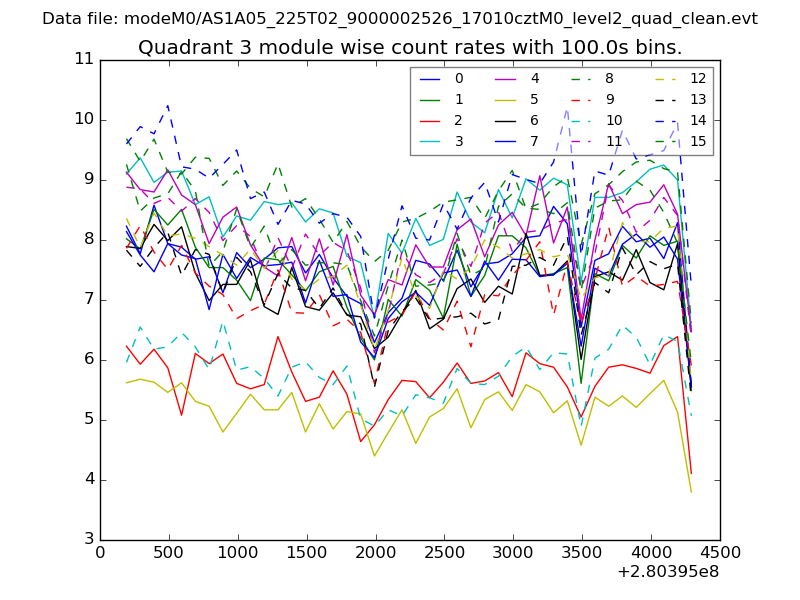
| Module-wise count rates for Quadrant D Data is divided into 100 sec bins |
 |
 |
| Parameter | Plot |
|---|---|
| CZT HV Monitor | 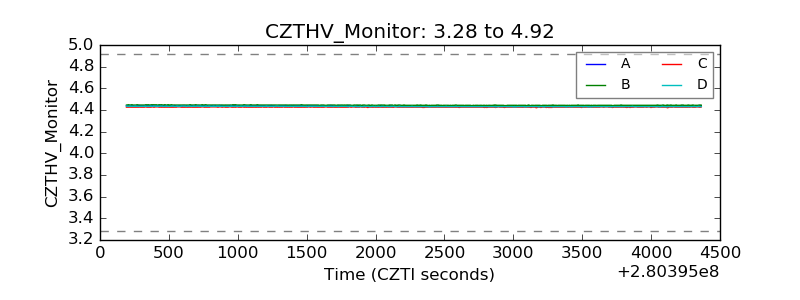 |
| D_VDD | 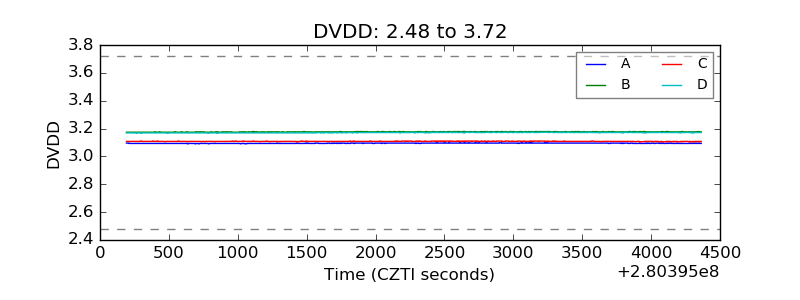 |
| Temperature 1 |  |
| Veto HV Monitor | 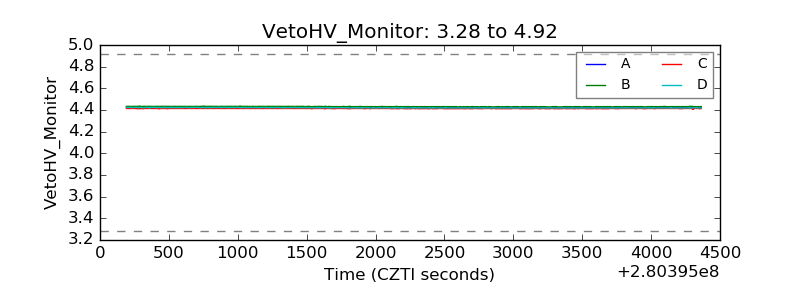 |
| Veto LLD | 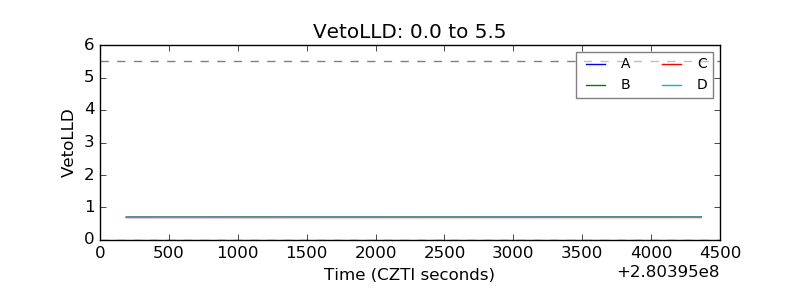 |
| Alpha Counter | 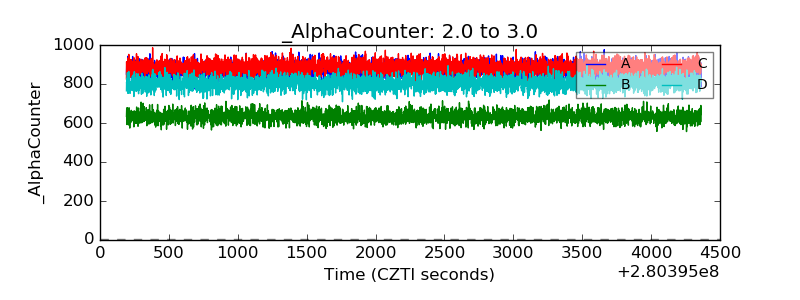 |
| _CPM_Rate | 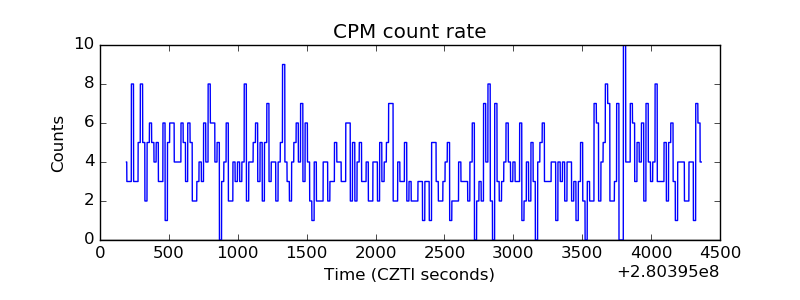 |
| CZT Counter | 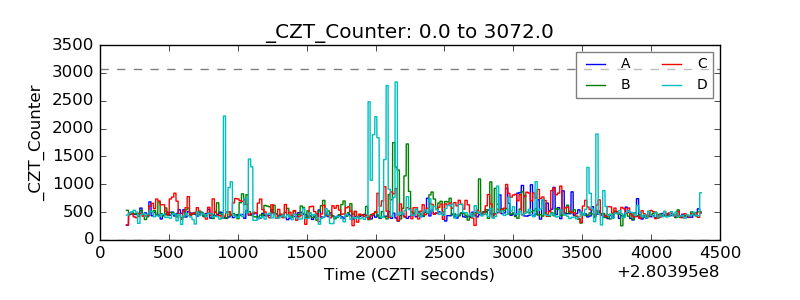 |
| +2.5 Volts monitor |  |
| +5 Volts monitor |  |
| _ROLL_ROT | 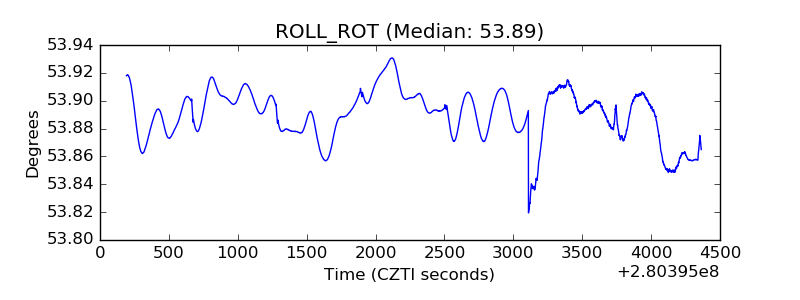 |
| _Roll_DEC | 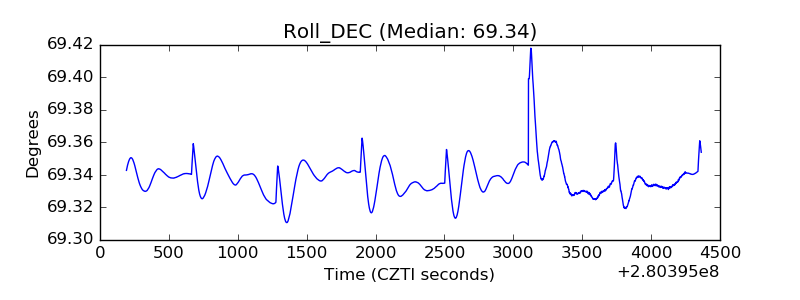 |
| _Roll_RA |  |
| Veto Counter | 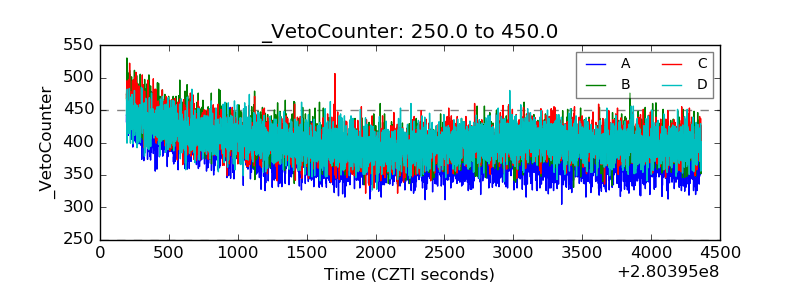 |