| Param | Original file | Final file |
|---|---|---|
| Filename | modeM0/AS1T03_038T01_9000002530_17030cztM0_level2.evt | modeM0/AS1T03_038T01_9000002530_17030cztM0_level2_quad_clean.evt |
| Size (bytes) | 1,278,103,680 | 264,672,000 |
| Size | 1.2 GB | 252.4 MB |
| Events in quadrant A | 8,484,442 | 1,721,866 |
| Events in quadrant B | 9,315,424 | 1,739,738 |
| Events in quadrant C | 8,694,749 | 1,675,629 |
| Events in quadrant D | 10,979,086 | 1,621,756 |
| Mode M9 | |||
|---|---|---|---|
| Quadrant | BADHDUFLAG | Total packets | Discarded packets |
| A | 0 | 19 | 0 |
| B | 0 | 19 | 0 |
| C | 0 | 19 | 0 |
| D | 0 | 19 | 0 |
| Mode M0 | |||
|---|---|---|---|
| Quadrant | BADHDUFLAG | Total packets | Discarded packets |
| A | 0 | 37659 | 2 |
| B | 0 | 39601 | 2 |
| C | 0 | 37490 | 2 |
| D | 0 | 45753 | 2 |
| Mode SS | |||
|---|---|---|---|
| Quadrant | BADHDUFLAG | Total packets | Discarded packets |
| A | 0 | 372 | 0 |
| B | 0 | 372 | 0 |
| C | 0 | 372 | 0 |
| D | 0 | 372 | 0 |
| Quadrant | Total seconds | Saturated seconds | Saturation percentage |
|---|---|---|---|
| A | 18249 | 114 | 0.624692% |
| B | 18250 | 261 | 1.430137% |
| C | 18250 | 209 | 1.145205% |
| D | 18250 | 704 | 3.857534% |
Noise dominated data is calculated using 1-second bins in cleaned event files. If a bin has >2000 counts, and if more than 50% of those come from <1% of pixels, then it is considered to be noise-dominated and hence unusable.
| Quadrant | # 1 sec bins | Bins with >0 counts | Bins with >2000 counts | High rate bins dominated by noise | Noise dominated (total time) | Noise dominated (detector-on time) | Marked lightcurve |
|---|---|---|---|---|---|---|---|
| A | 20095 | 18254 | 14 | 14 | 0.07% | 0.08% | 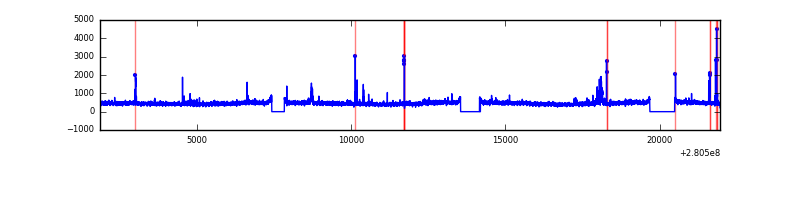 |
| B | 20096 | 18255 | 95 | 95 | 0.47% | 0.52% | 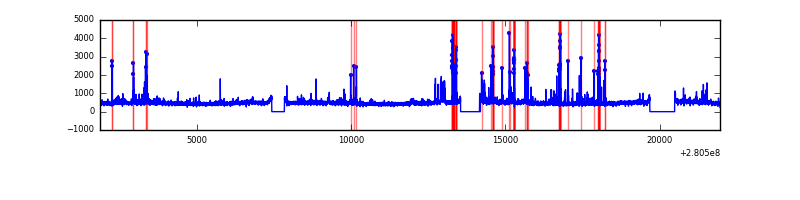 |
| C | 20096 | 18255 | 0 | 0 | 0.00% | 0.00% | 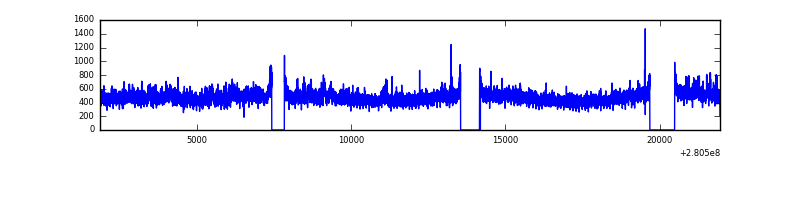 |
| D | 20096 | 18255 | 428 | 428 | 2.13% | 2.34% | 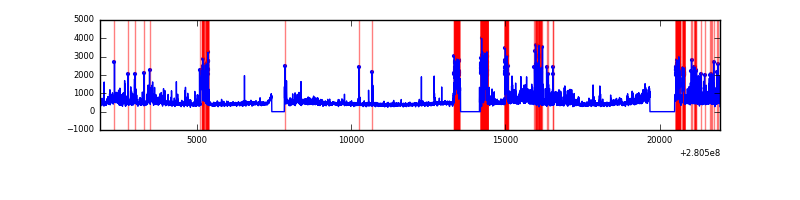 |
Top three noisy pixels from each quadrant. If the there are fewer than three noisy pixels in the level2.evt file, extra rows are filled as -1
| Pixel properties | Quadrant properties | ||||||
|---|---|---|---|---|---|---|---|
| Quadrant | DetID | PixID | Counts | Sigma | Mean | Median | Sigma |
| A | 15 | 174 | 233700 | 545.01 | 2113 | 2061 | 425.0 |
| A | 12 | 189 | 62761 | 142.82 | 2113 | 2061 | 425.0 |
| A | 4 | 2 | 61460 | 139.76 | 2113 | 2061 | 425.0 |
| B | 3 | 64 | 492768 | 1229.76 | 2110 | 2056 | 399.0 |
| B | 0 | 229 | 149285 | 368.97 | 2110 | 2056 | 399.0 |
| B | 4 | 216 | 83047 | 202.97 | 2110 | 2056 | 399.0 |
| C | 3 | 233 | 414641 | 870.73 | 2035 | 2047 | 473.8 |
| C | 14 | 238 | 314049 | 658.45 | 2035 | 2047 | 473.8 |
| C | 7 | 247 | 14823 | 26.96 | 2035 | 2047 | 473.8 |
| D | 1 | 52 | 2728087 | 5501.21 | 2041 | 1978 | 495.5 |
| D | 5 | 222 | 296703 | 594.75 | 2041 | 1978 | 495.5 |
| D | 10 | 70 | 136712 | 271.89 | 2041 | 1978 | 495.5 |
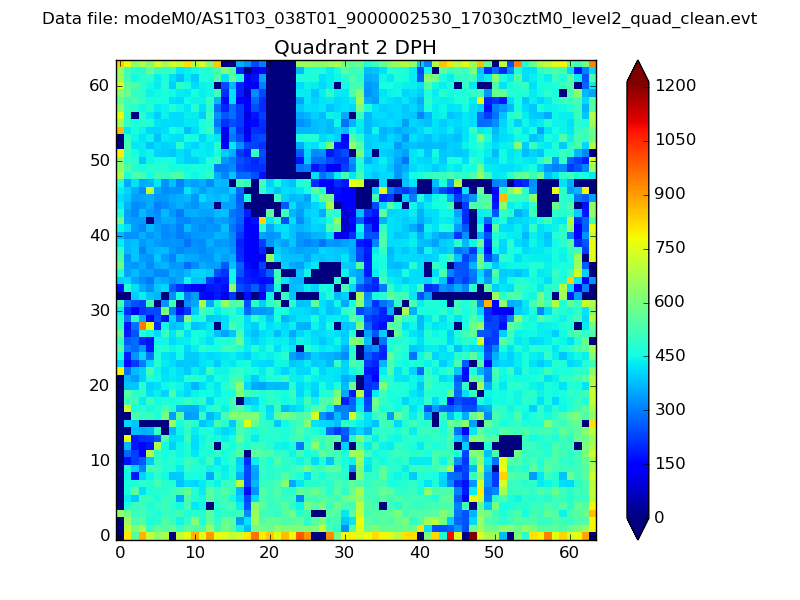
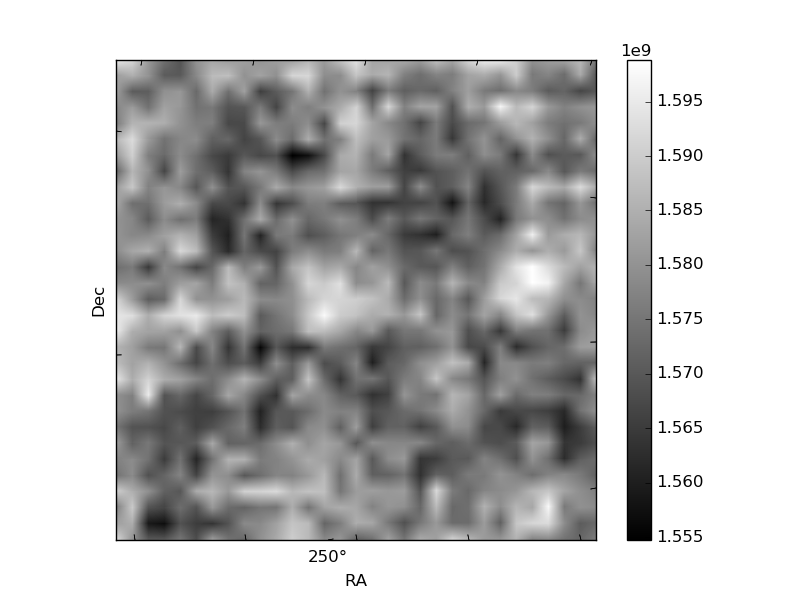
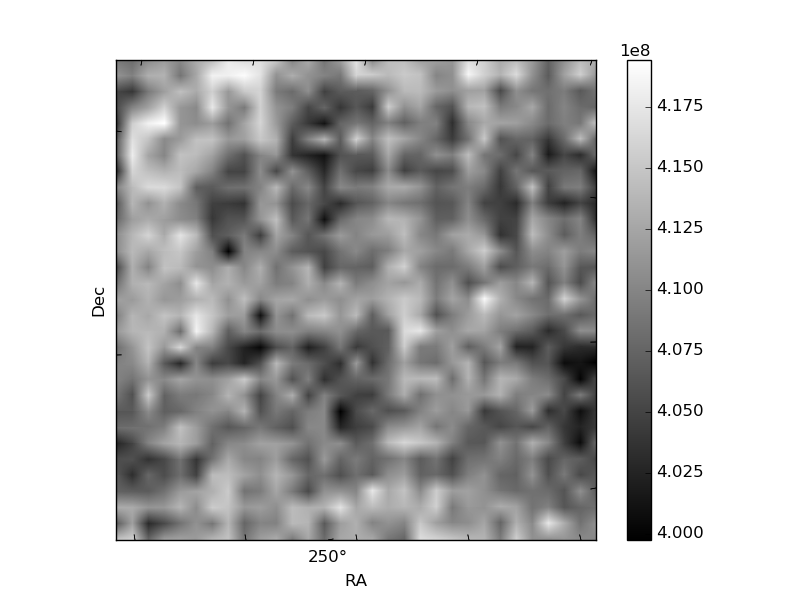
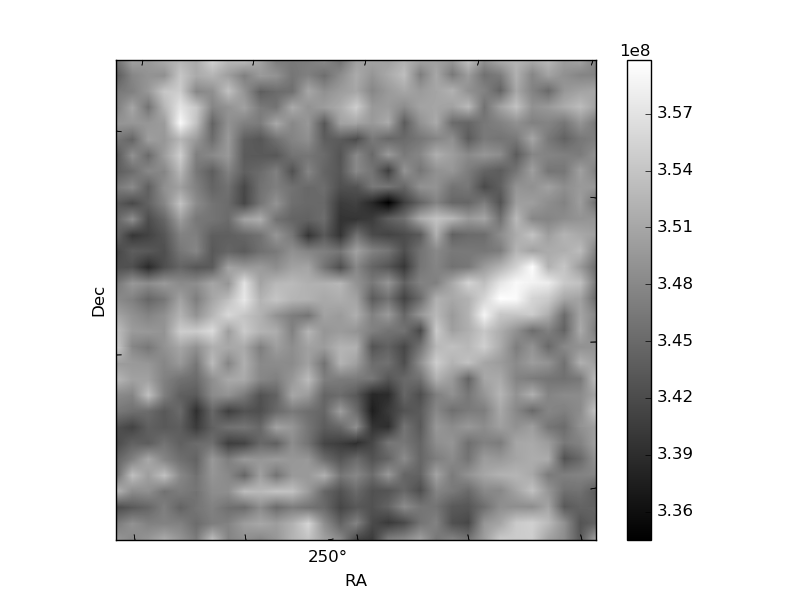
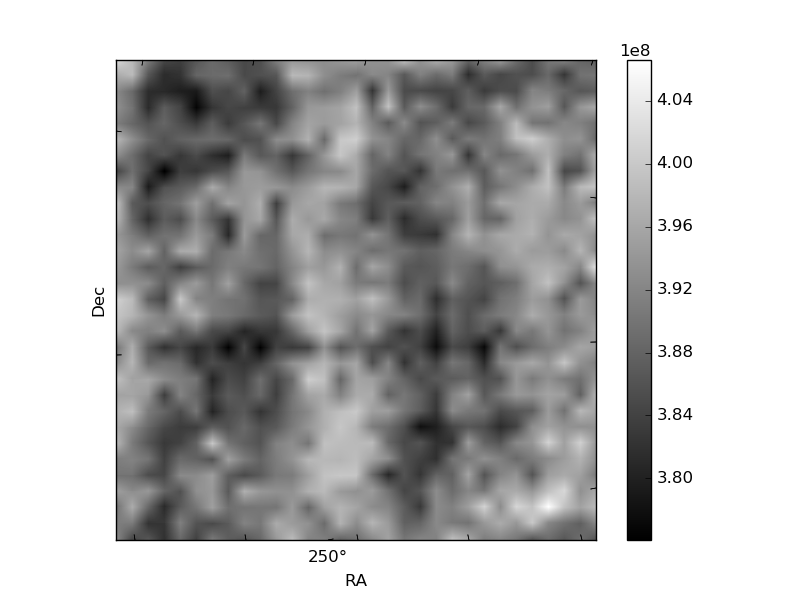
Histogram calculated using DETX and DETY for each event in the final _common_clean file
| Quadrant A | 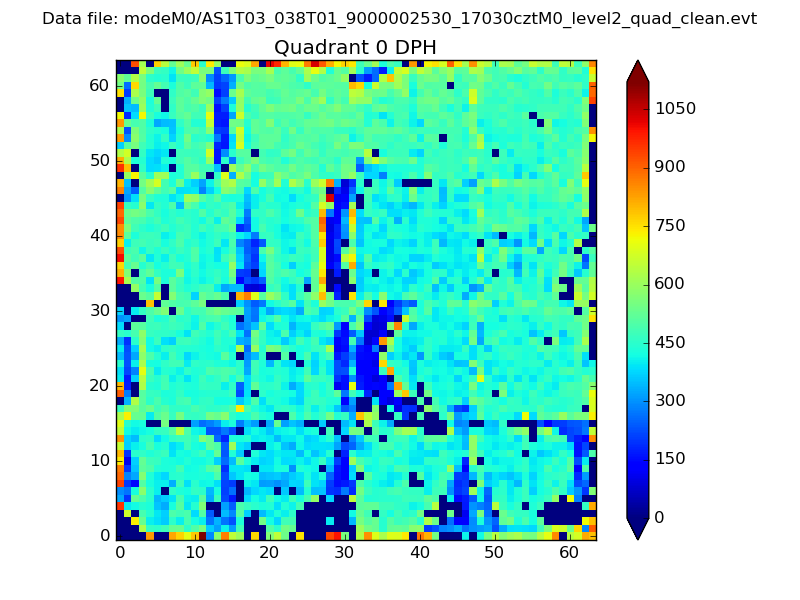 |
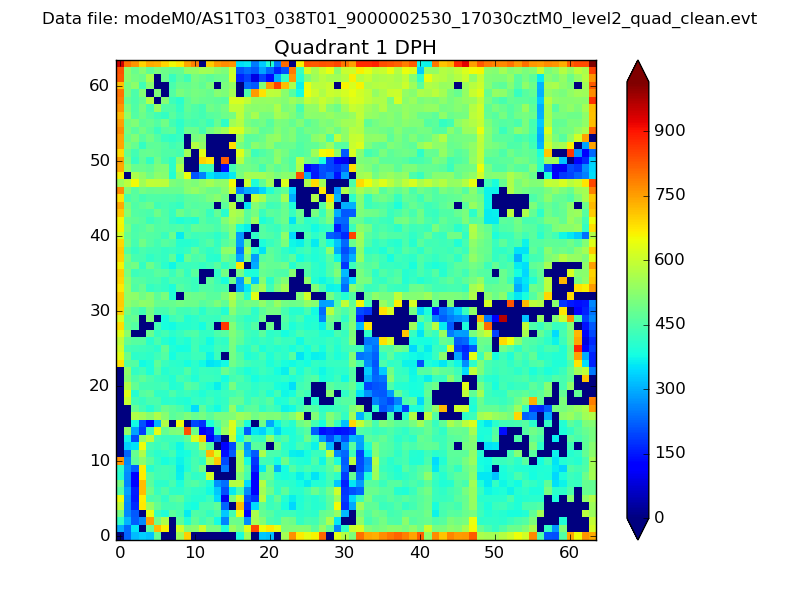 |
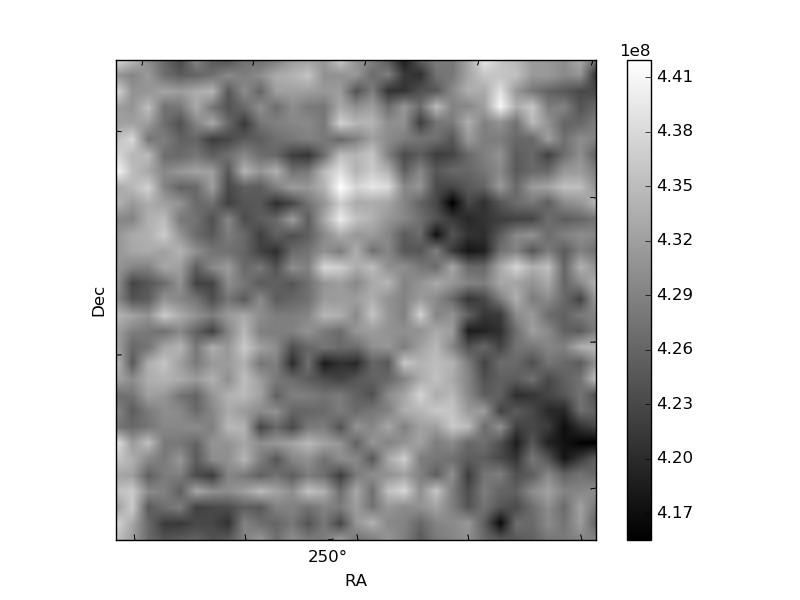
Quadrant B |
|---|---|---|---|
| Quadrant D | 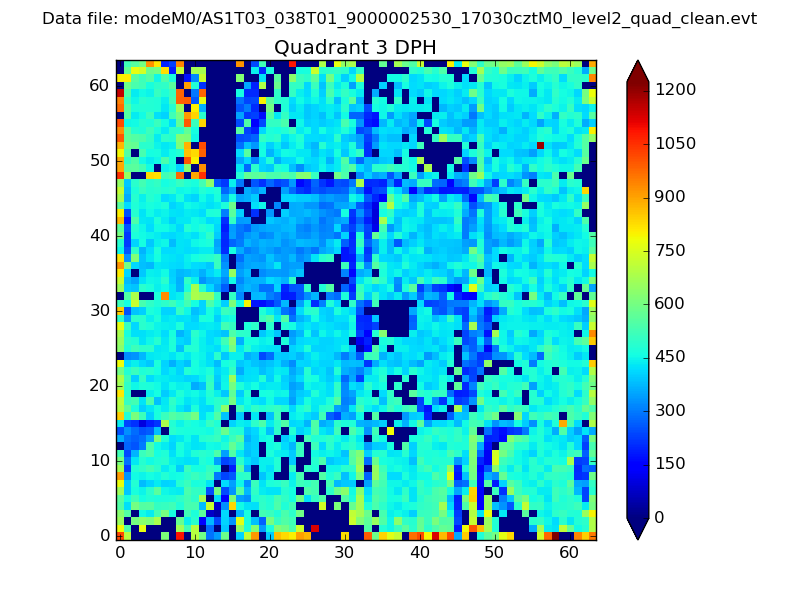 |
 |
Quadrant C |
| Plot type | Count rate plots | Images |
|---|---|---|
| Comparison with Poisson distribution Blue bars denote a histogram of data divided into 1 sec bins. Red curve is a Poisson curve with rate = median count rate of data. |
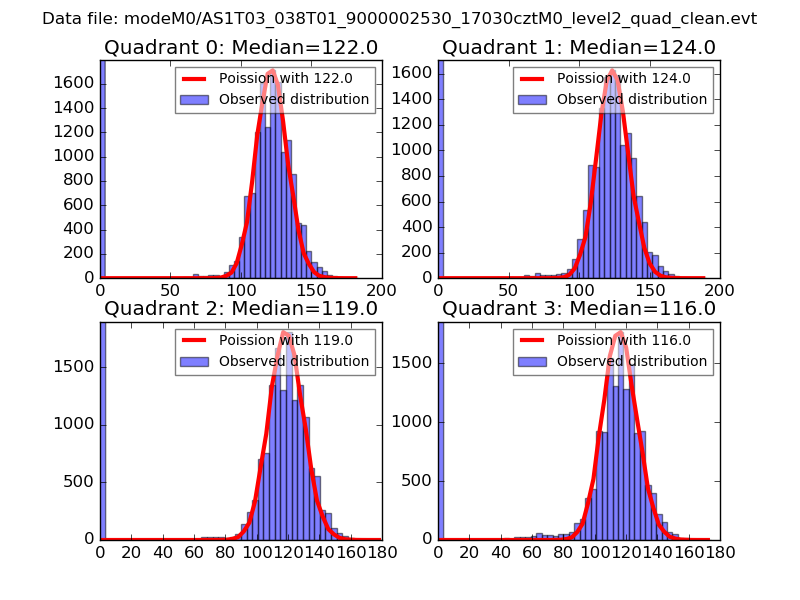 |
 |
| Quadrant-wise count rates Data is divided into 100 sec bins |
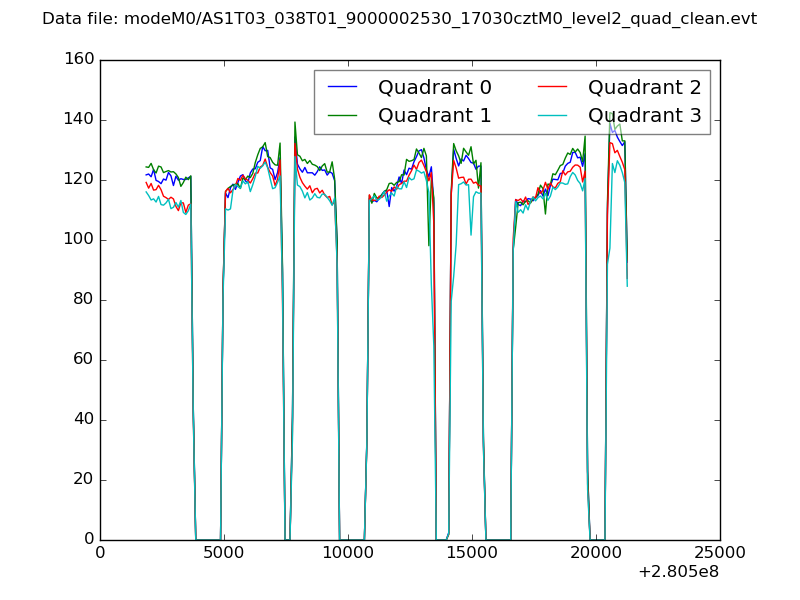 |
|
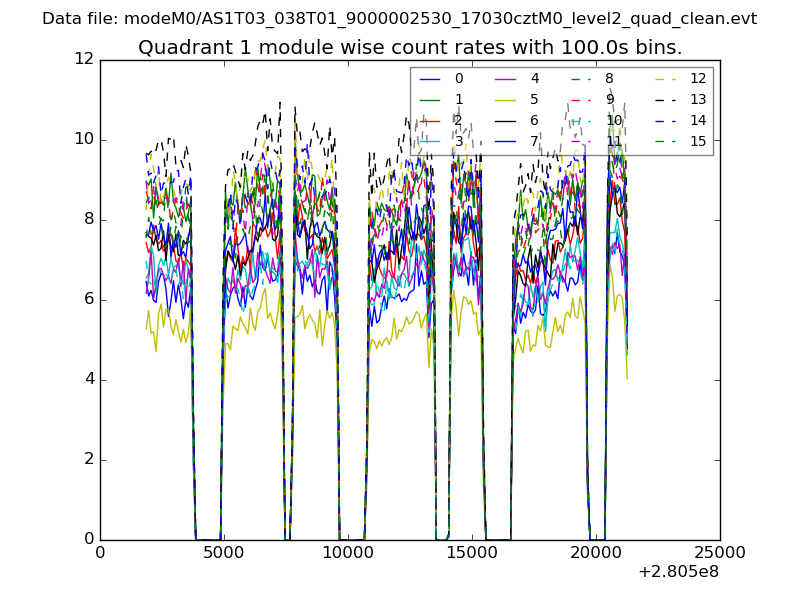
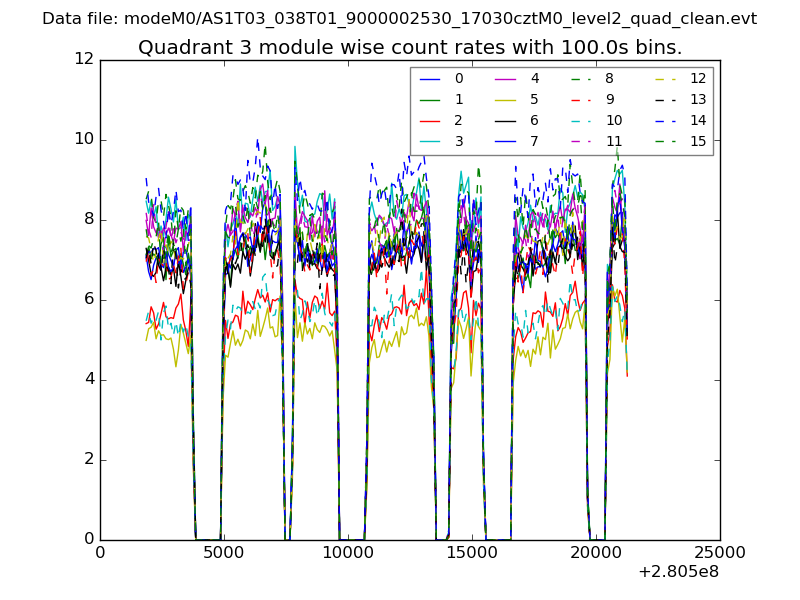
| Module-wise count rates for Quadrant A Data is divided into 100 sec bins |
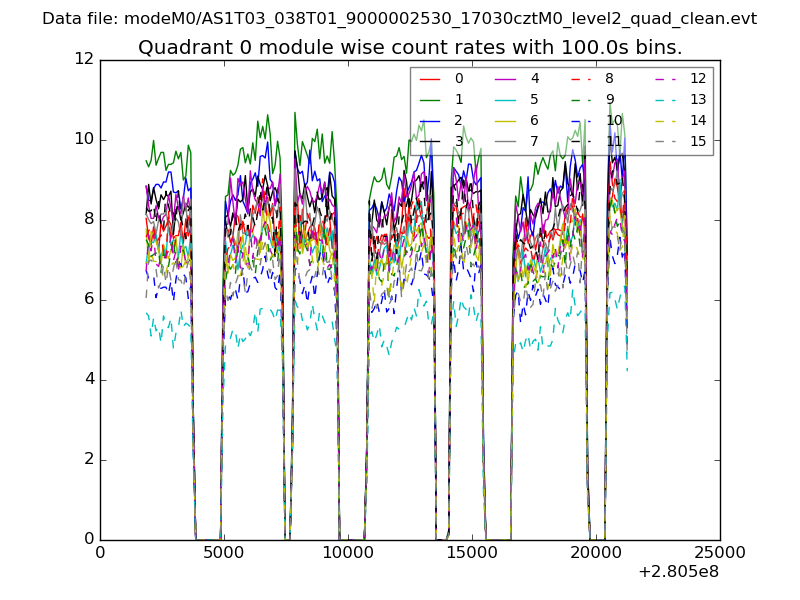 |
 |
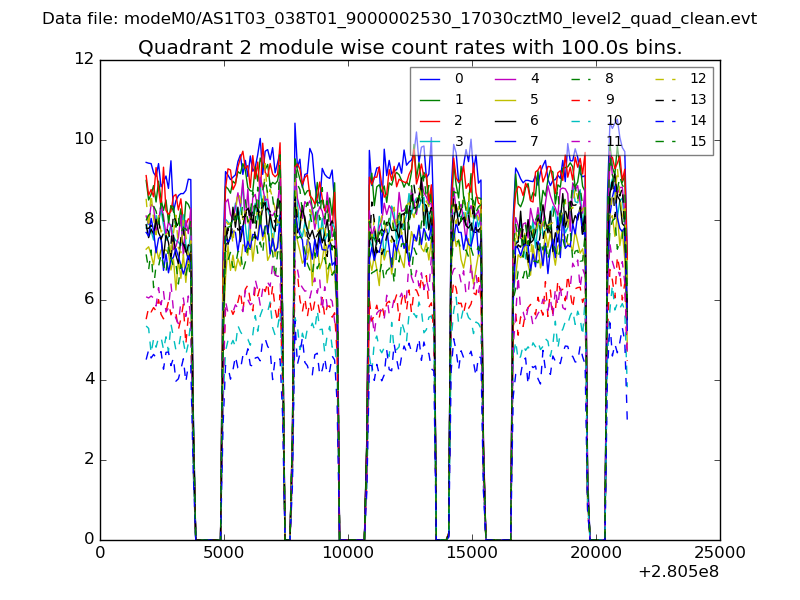
| Module-wise count rates for Quadrant B Data is divided into 100 sec bins |
 |
 |
| Module-wise count rates for Quadrant C Data is divided into 100 sec bins |
 |
 |
| Module-wise count rates for Quadrant D Data is divided into 100 sec bins |
 |
 |
| Parameter | Plot |
|---|---|
| CZT HV Monitor | 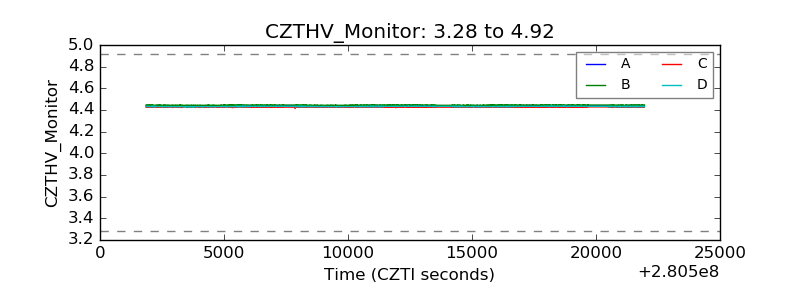 |
| D_VDD | 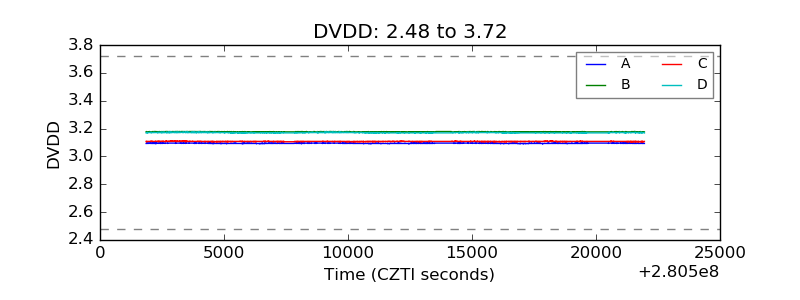 |
| Temperature 1 | 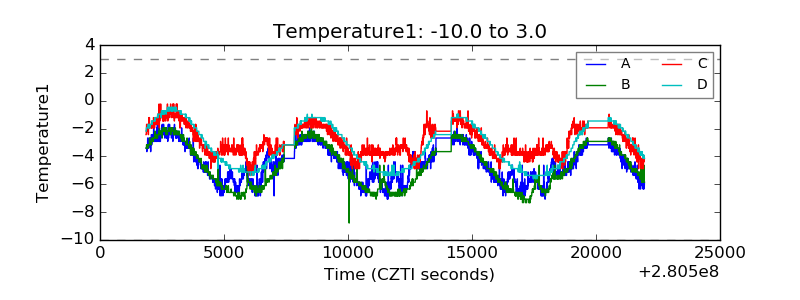 |
| Veto HV Monitor |  |
| Veto LLD | 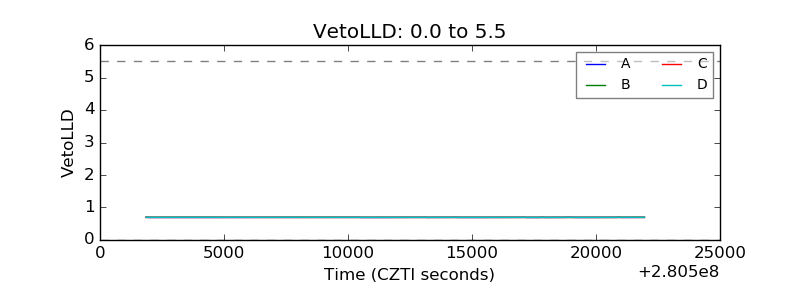 |
| Alpha Counter | 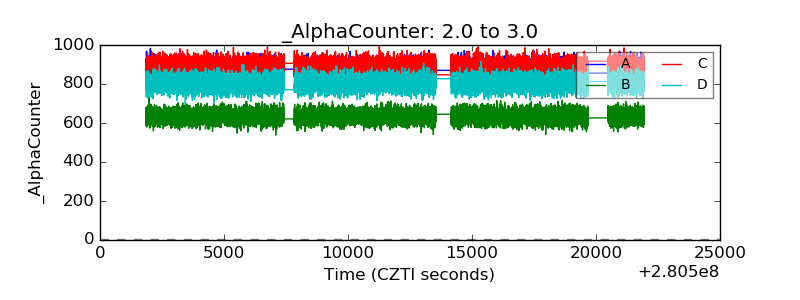 |
| _CPM_Rate | 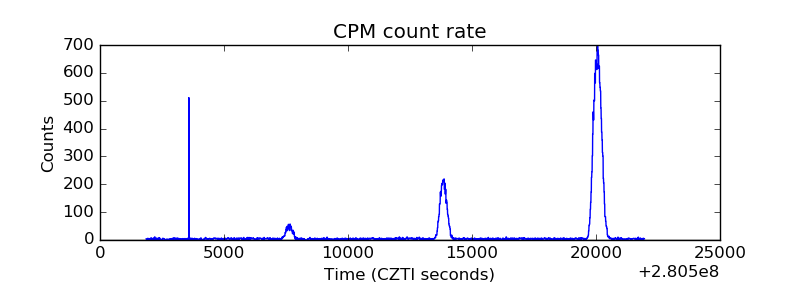 |
| CZT Counter | 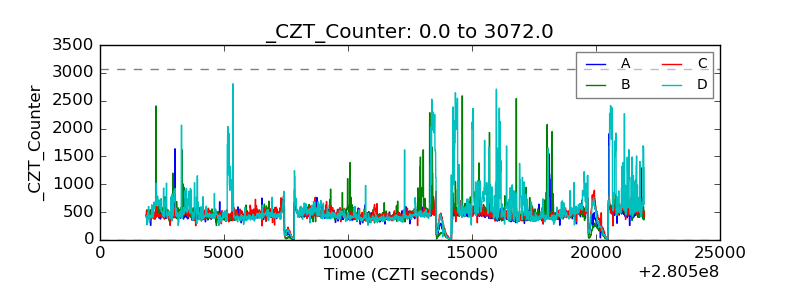 |
| +2.5 Volts monitor |  |
| +5 Volts monitor |  |
| _ROLL_ROT | 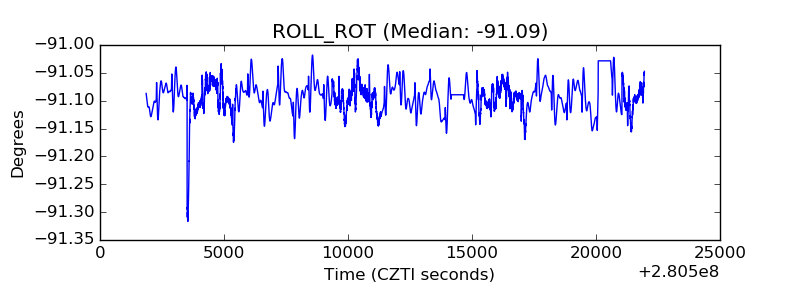 |
| _Roll_DEC | 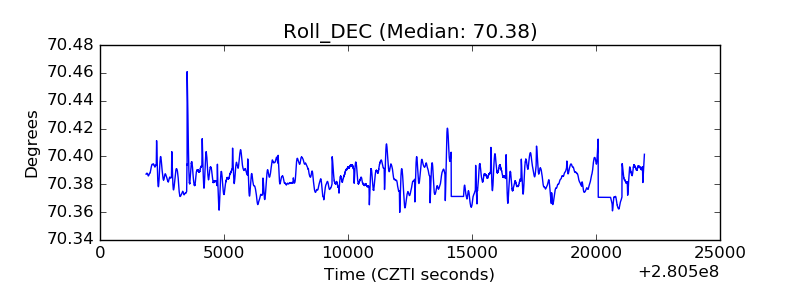 |
| _Roll_RA | 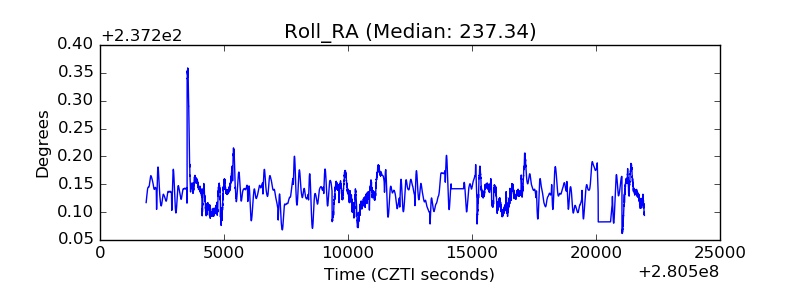 |
| Veto Counter | 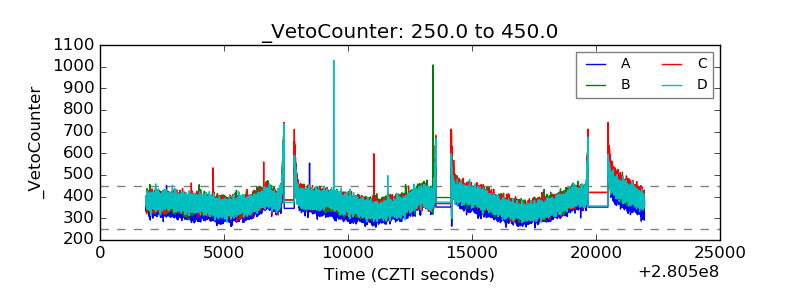 |