| Param | Original file | Final file |
|---|---|---|
| Filename | modeM0/AS1T03_038T01_9000002530_17035cztM0_level2.evt | modeM0/AS1T03_038T01_9000002530_17035cztM0_level2_quad_clean.evt |
| Size (bytes) | 782,193,600 | 185,912,640 |
| Size | 746.0 MB | 177.3 MB |
| Events in quadrant A | 5,352,647 | 1,220,093 |
| Events in quadrant B | 5,622,611 | 1,255,115 |
| Events in quadrant C | 5,934,572 | 1,198,785 |
| Events in quadrant D | 6,009,267 | 1,170,907 |
| Mode M9 | |||
|---|---|---|---|
| Quadrant | BADHDUFLAG | Total packets | Discarded packets |
| A | 0 | 25 | 0 |
| B | 0 | 25 | 0 |
| C | 0 | 25 | 0 |
| D | 0 | 25 | 0 |
| Mode M0 | |||
|---|---|---|---|
| Quadrant | BADHDUFLAG | Total packets | Discarded packets |
| A | 0 | 23504 | 3 |
| B | 0 | 24108 | 3 |
| C | 0 | 25141 | 3 |
| D | 0 | 26012 | 4 |
| Mode SS | |||
|---|---|---|---|
| Quadrant | BADHDUFLAG | Total packets | Discarded packets |
| A | 0 | 232 | 0 |
| B | 0 | 232 | 0 |
| C | 0 | 232 | 0 |
| D | 0 | 232 | 0 |
| Quadrant | Total seconds | Saturated seconds | Saturation percentage |
|---|---|---|---|
| A | 11359 | 74 | 0.651466% |
| B | 11360 | 89 | 0.783451% |
| C | 11360 | 133 | 1.170775% |
| D | 11359 | 237 | 2.086451% |
Noise dominated data is calculated using 1-second bins in cleaned event files. If a bin has >2000 counts, and if more than 50% of those come from <1% of pixels, then it is considered to be noise-dominated and hence unusable.
| Quadrant | # 1 sec bins | Bins with >0 counts | Bins with >2000 counts | High rate bins dominated by noise | Noise dominated (total time) | Noise dominated (detector-on time) | Marked lightcurve |
|---|---|---|---|---|---|---|---|
| A | 13900 | 11362 | 0 | 0 | 0.00% | 0.00% | 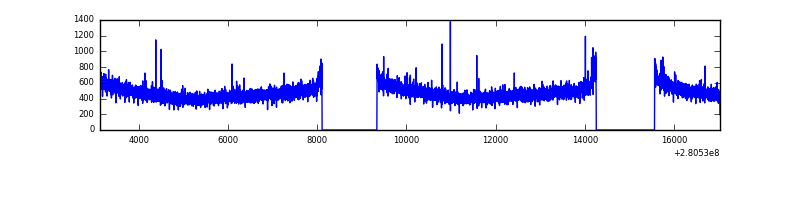 |
| B | 13901 | 11363 | 3 | 3 | 0.02% | 0.03% | 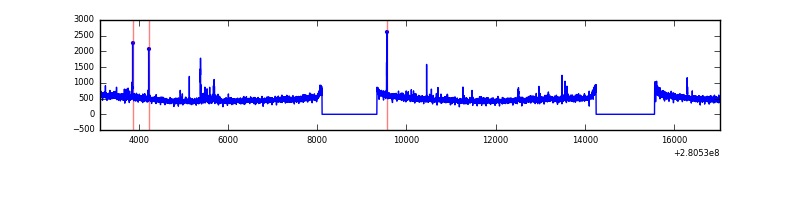 |
| C | 13901 | 11363 | 1 | 1 | 0.01% | 0.01% | 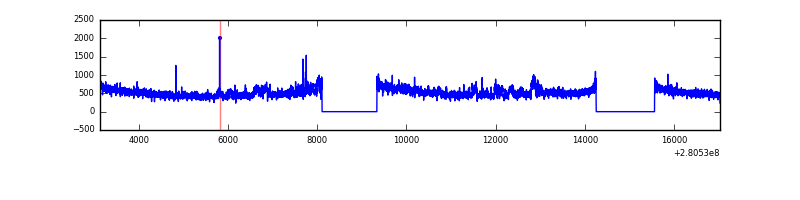 |
| D | 13900 | 11362 | 132 | 132 | 0.95% | 1.16% | 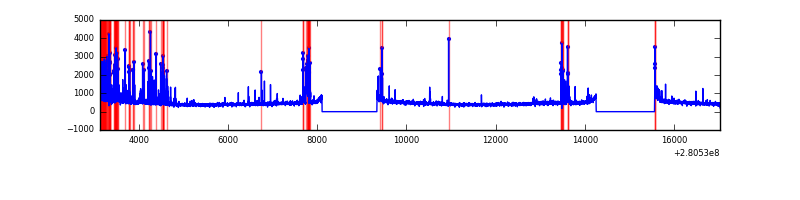 |
Top three noisy pixels from each quadrant. If the there are fewer than three noisy pixels in the level2.evt file, extra rows are filled as -1
| Pixel properties | Quadrant properties | ||||||
|---|---|---|---|---|---|---|---|
| Quadrant | DetID | PixID | Counts | Sigma | Mean | Median | Sigma |
| A | 0 | 226 | 12078 | 38.77 | 1388 | 1358 | 276.5 |
| A | 12 | 189 | 11453 | 36.51 | 1388 | 1358 | 276.5 |
| A | 12 | 194 | 10197 | 31.97 | 1388 | 1358 | 276.5 |
| B | 0 | 229 | 58568 | 221.29 | 1394 | 1362 | 258.5 |
| B | 10 | 247 | 47154 | 177.14 | 1394 | 1362 | 258.5 |
| B | 0 | 189 | 36202 | 134.77 | 1394 | 1362 | 258.5 |
| C | 3 | 233 | 471971 | 1535.17 | 1338 | 1349 | 306.6 |
| C | 14 | 238 | 210927 | 683.64 | 1338 | 1349 | 306.6 |
| C | 7 | 247 | 17951 | 54.16 | 1338 | 1349 | 306.6 |
| D | 1 | 52 | 595602 | 1857.99 | 1337 | 1300 | 319.9 |
| D | 10 | 70 | 212452 | 660.13 | 1337 | 1300 | 319.9 |
| D | 5 | 222 | 98787 | 304.78 | 1337 | 1300 | 319.9 |
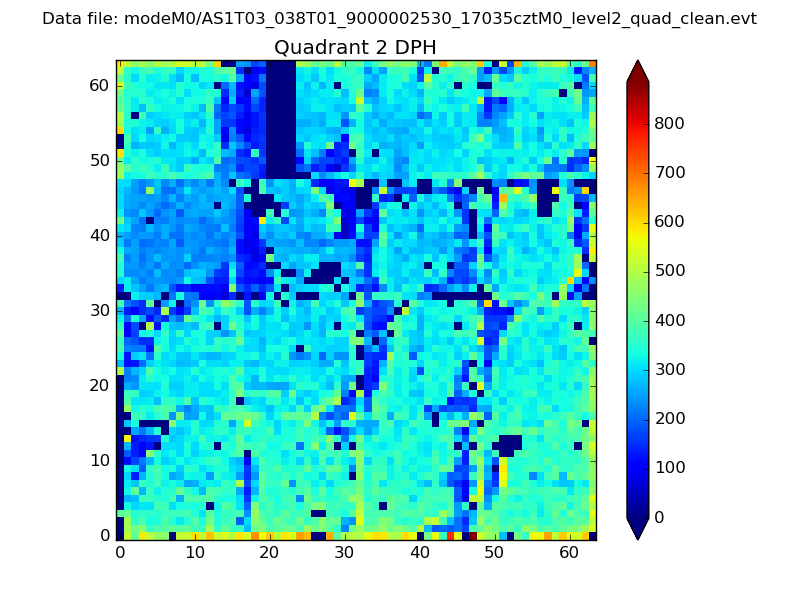
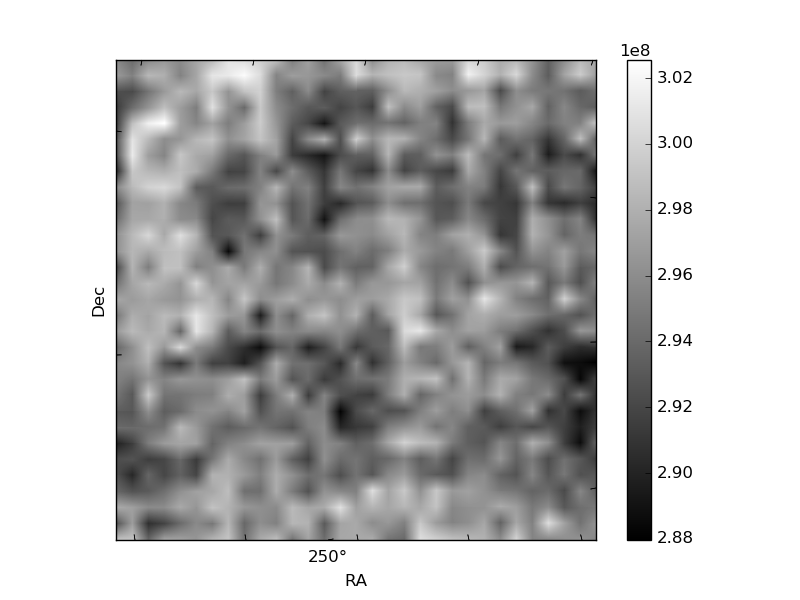
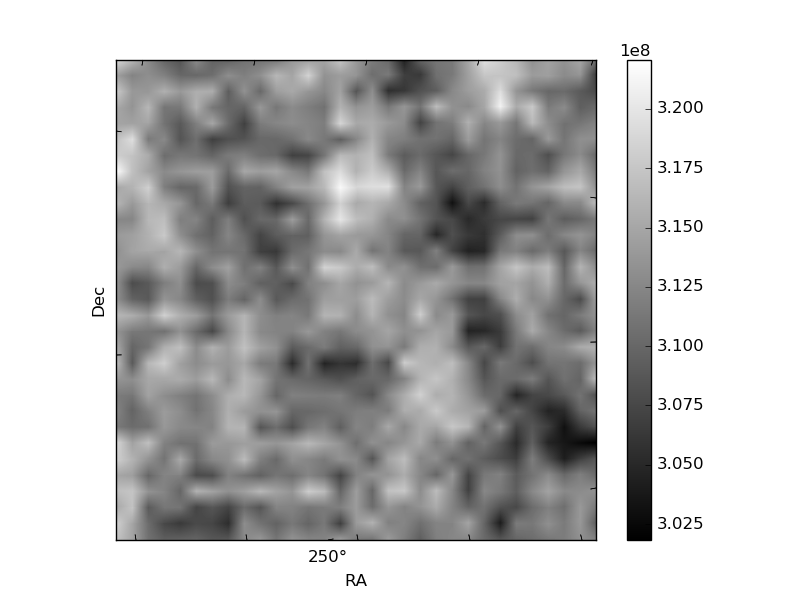
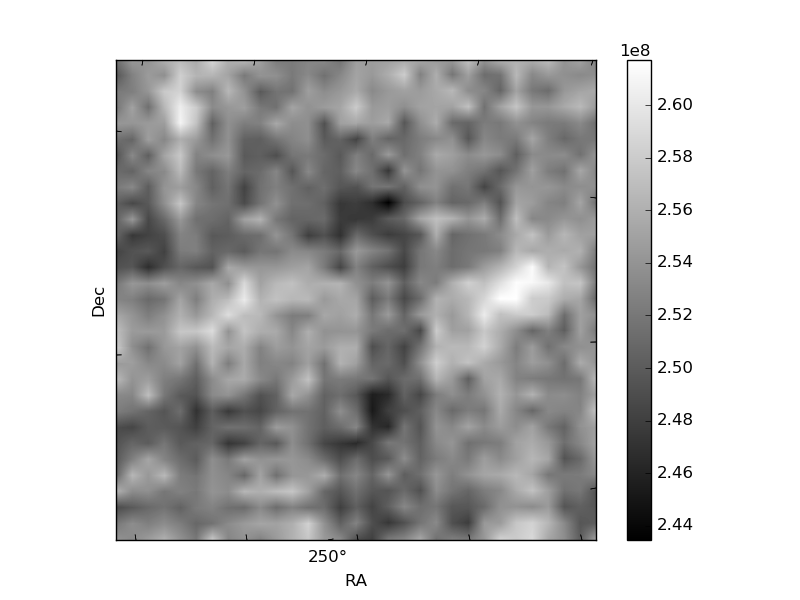
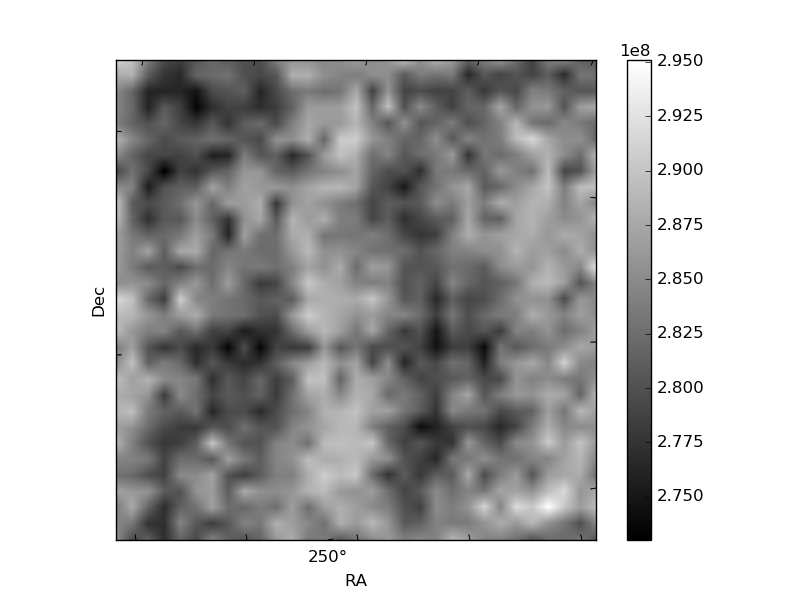
Histogram calculated using DETX and DETY for each event in the final _common_clean file
| Quadrant A |  |
 |
Quadrant B |
|---|---|---|---|
| Quadrant D | 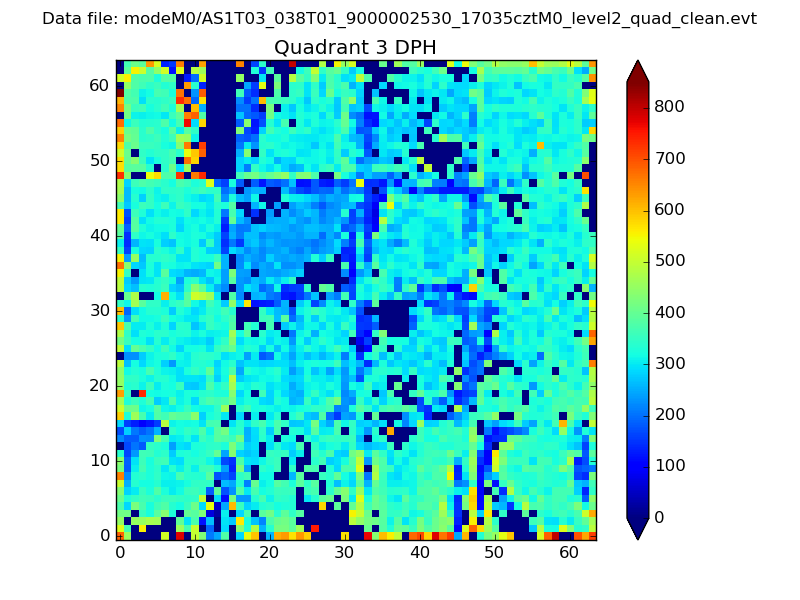 |
 |
Quadrant C |
| Plot type | Count rate plots | Images |
|---|---|---|
| Comparison with Poisson distribution Blue bars denote a histogram of data divided into 1 sec bins. Red curve is a Poisson curve with rate = median count rate of data. |
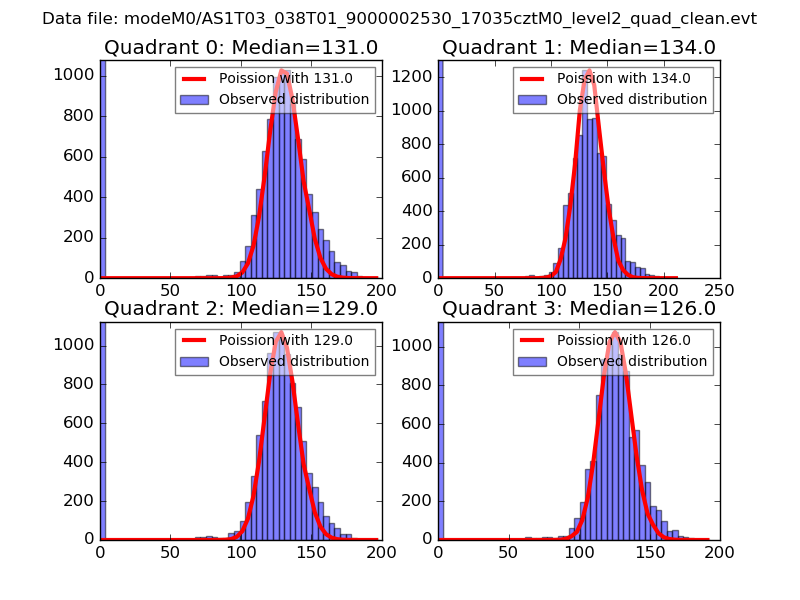 |
 |
| Quadrant-wise count rates Data is divided into 100 sec bins |
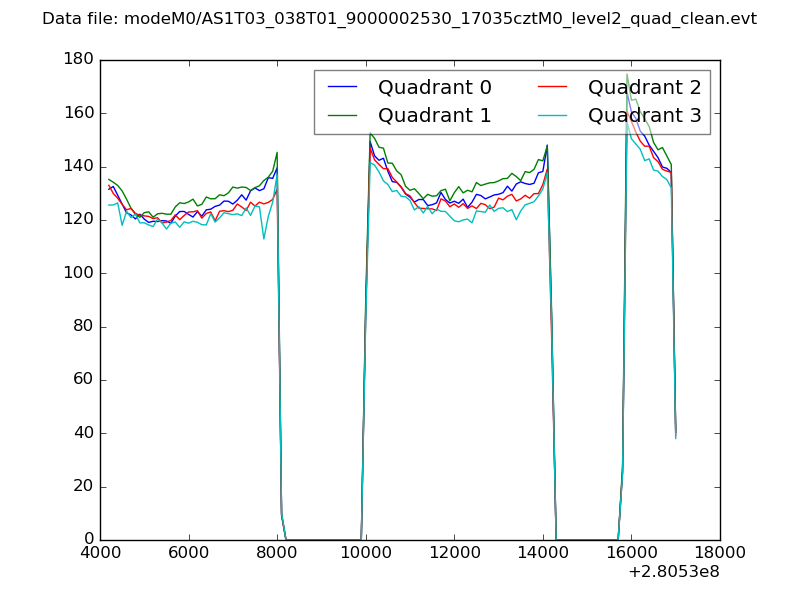 |
|
| Module-wise count rates for Quadrant A Data is divided into 100 sec bins |
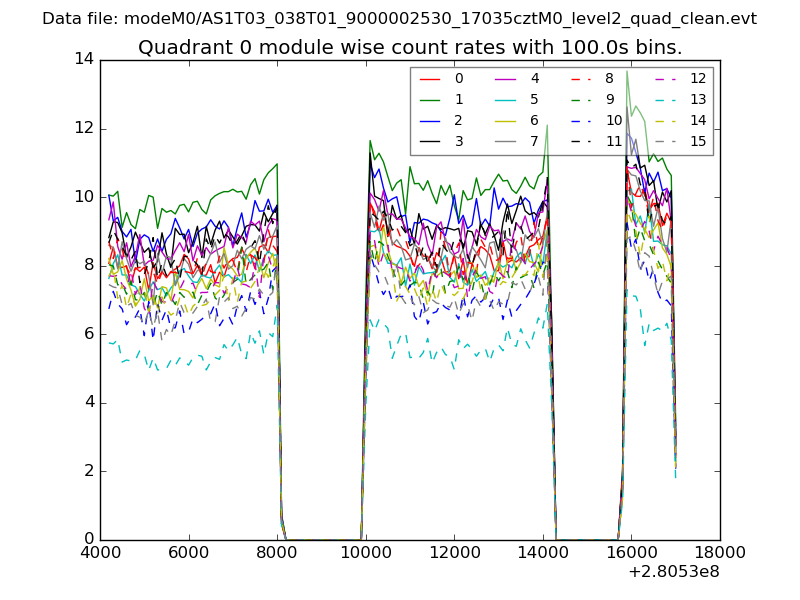 |
 |
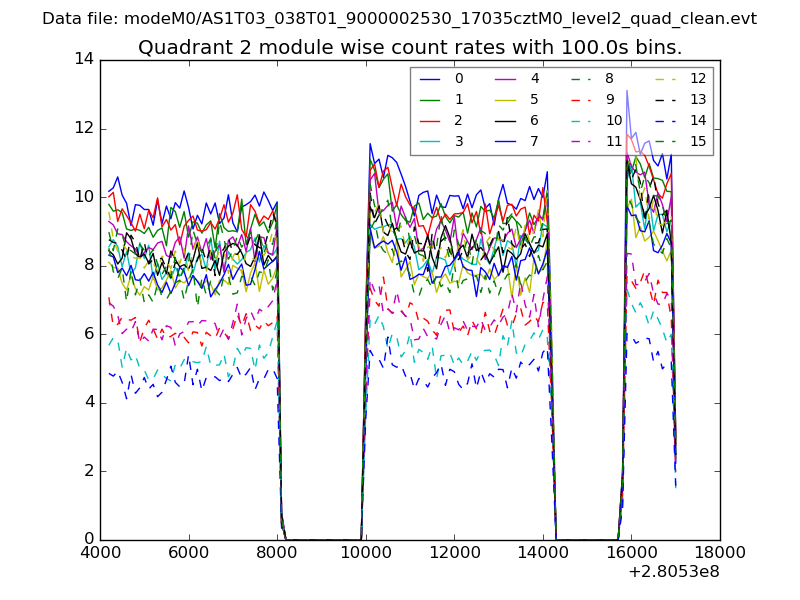
| Module-wise count rates for Quadrant B Data is divided into 100 sec bins |
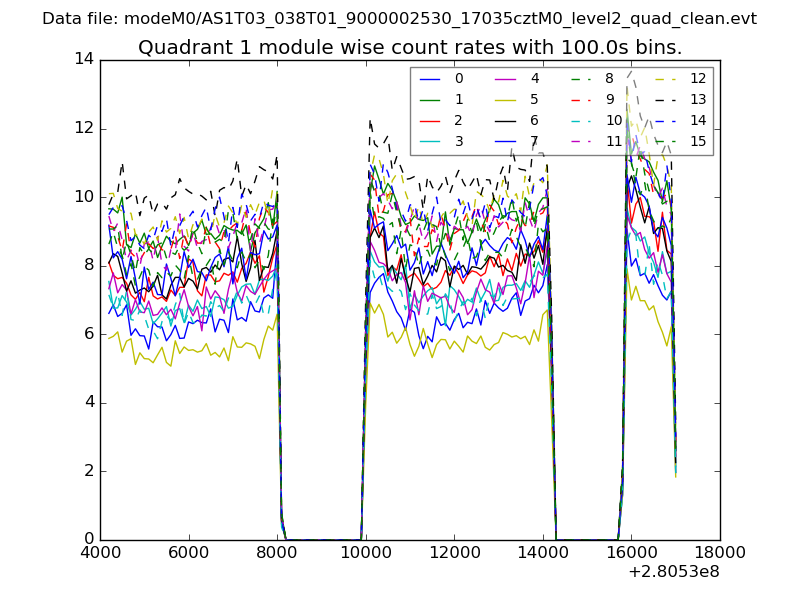 |
 |
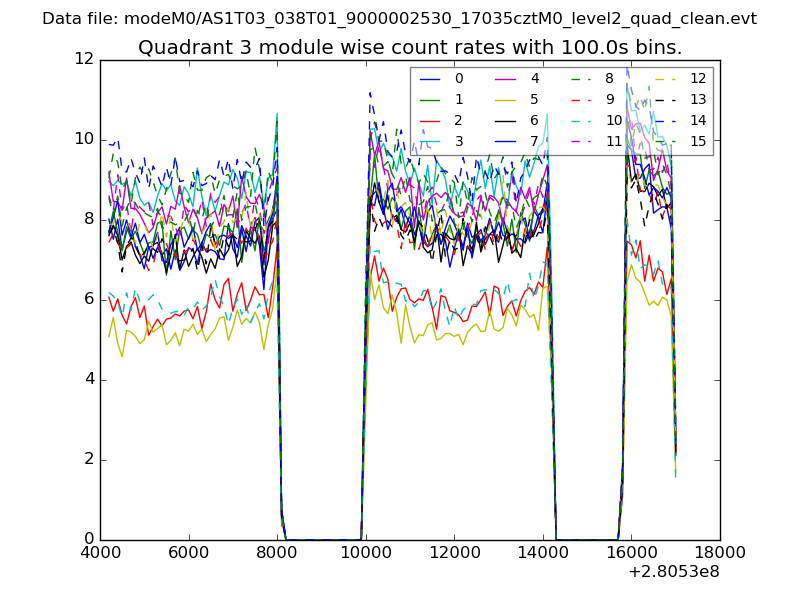
| Module-wise count rates for Quadrant C Data is divided into 100 sec bins |
 |
 |
| Module-wise count rates for Quadrant D Data is divided into 100 sec bins |
 |
 |
| Parameter | Plot |
|---|---|
| CZT HV Monitor | 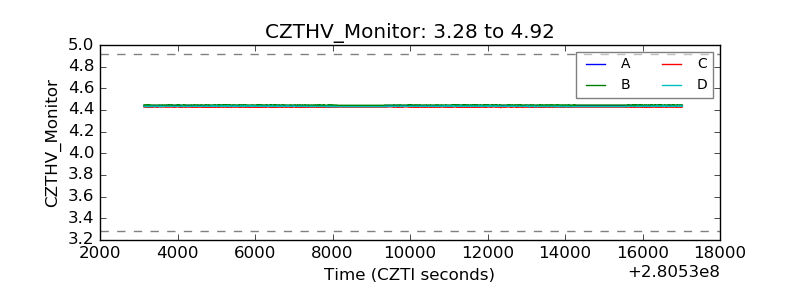 |
| D_VDD | 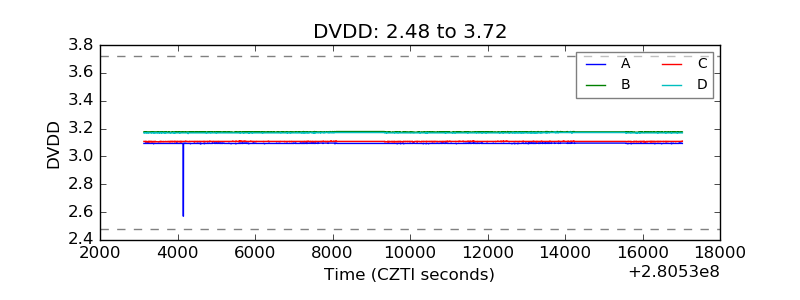 |
| Temperature 1 | 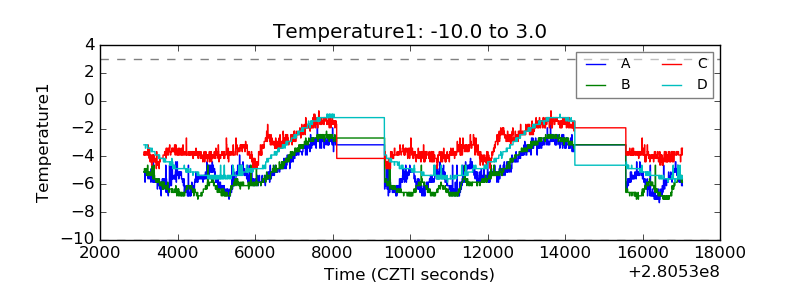 |
| Veto HV Monitor |  |
| Veto LLD | 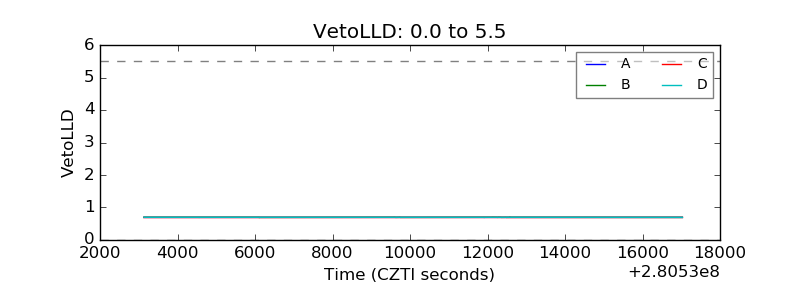 |
| Alpha Counter | 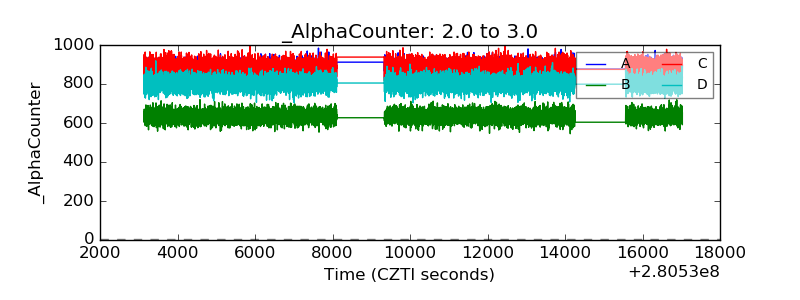 |
| _CPM_Rate |  |
| CZT Counter | 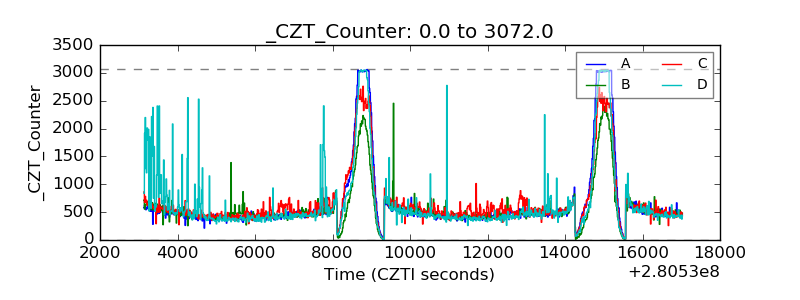 |
| +2.5 Volts monitor | 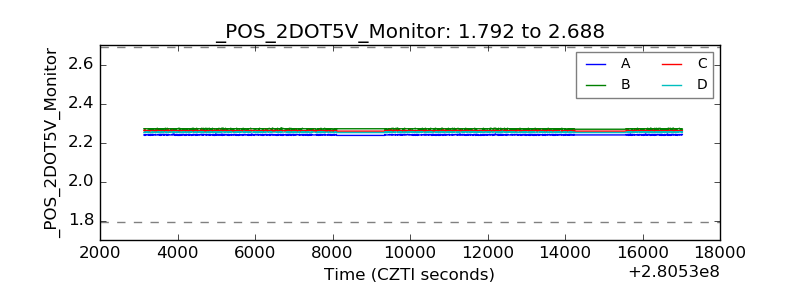 |
| +5 Volts monitor | 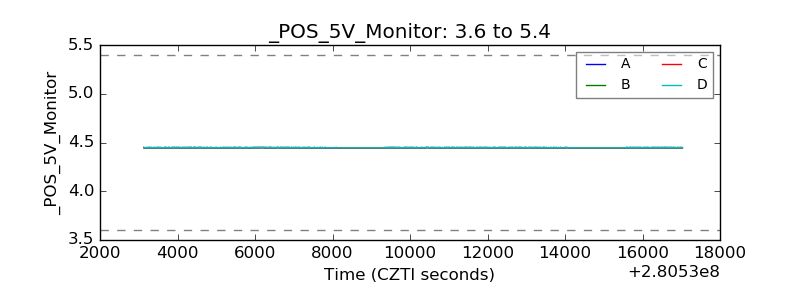 |
| _ROLL_ROT | 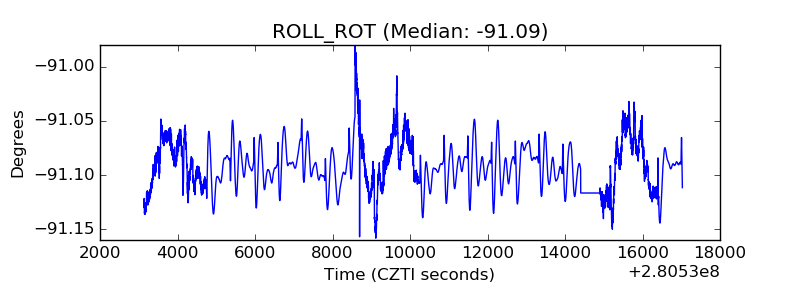 |
| _Roll_DEC | 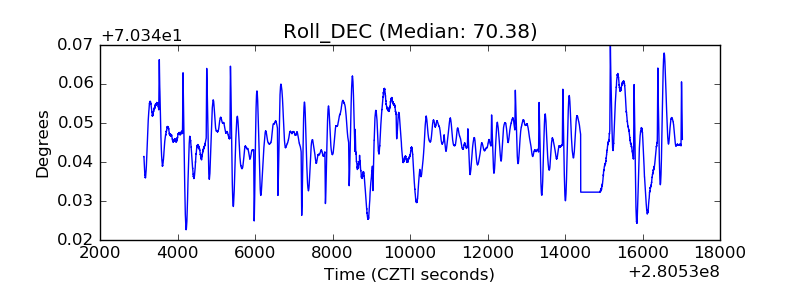 |
| _Roll_RA | 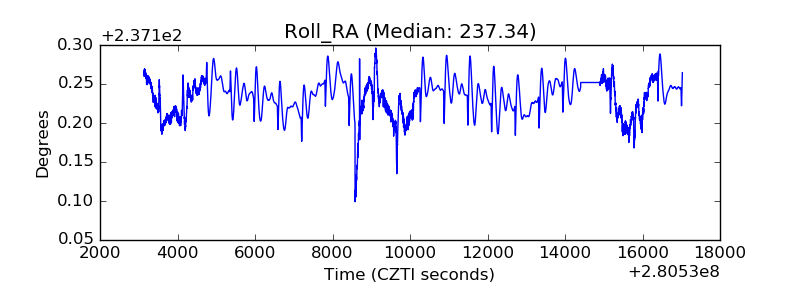 |
| Veto Counter | 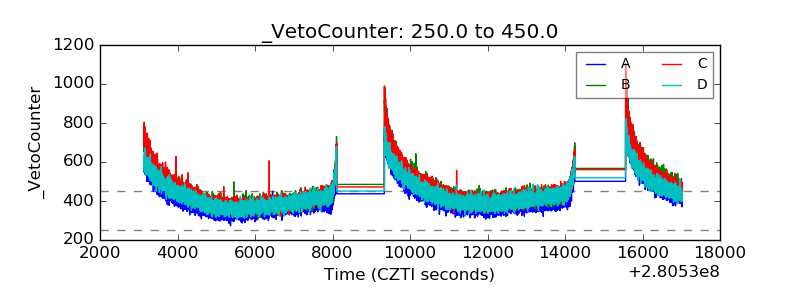 |