| Param | Original file | Final file |
|---|---|---|
| Filename | modeM0/AS1T03_038T01_9000002530_17036cztM0_level2.evt | modeM0/AS1T03_038T01_9000002530_17036cztM0_level2_quad_clean.evt |
| Size (bytes) | 435,225,600 | 125,173,440 |
| Size | 415.1 MB | 119.4 MB |
| Events in quadrant A | 3,104,235 | 849,530 |
| Events in quadrant B | 3,254,862 | 876,978 |
| Events in quadrant C | 3,149,086 | 821,855 |
| Events in quadrant D | 3,240,594 | 799,526 |
| Mode M9 | |||
|---|---|---|---|
| Quadrant | BADHDUFLAG | Total packets | Discarded packets |
| A | 0 | 18 | 0 |
| B | 0 | 19 | 0 |
| C | 0 | 19 | 0 |
| D | 0 | 19 | 0 |
| Mode M0 | |||
|---|---|---|---|
| Quadrant | BADHDUFLAG | Total packets | Discarded packets |
| A | 0 | 13290 | 3 |
| B | 0 | 13655 | 3 |
| C | 0 | 13386 | 3 |
| D | 0 | 13957 | 3 |
| Mode SS | |||
|---|---|---|---|
| Quadrant | BADHDUFLAG | Total packets | Discarded packets |
| A | 0 | 132 | 0 |
| B | 0 | 132 | 0 |
| C | 0 | 132 | 0 |
| D | 0 | 132 | 0 |
| Quadrant | Total seconds | Saturated seconds | Saturation percentage |
|---|---|---|---|
| A | 6345 | 50 | 0.788022% |
| B | 6345 | 66 | 1.040189% |
| C | 6345 | 85 | 1.339638% |
| D | 6345 | 114 | 1.796690% |
Noise dominated data is calculated using 1-second bins in cleaned event files. If a bin has >2000 counts, and if more than 50% of those come from <1% of pixels, then it is considered to be noise-dominated and hence unusable.
| Quadrant | # 1 sec bins | Bins with >0 counts | Bins with >2000 counts | High rate bins dominated by noise | Noise dominated (total time) | Noise dominated (detector-on time) | Marked lightcurve |
|---|---|---|---|---|---|---|---|
| A | 7736 | 6348 | 3 | 3 | 0.04% | 0.05% | 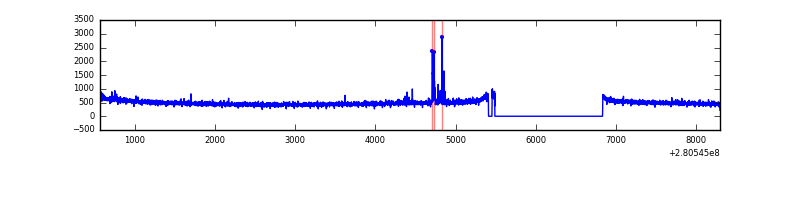 |
| B | 7736 | 6347 | 8 | 8 | 0.10% | 0.13% | 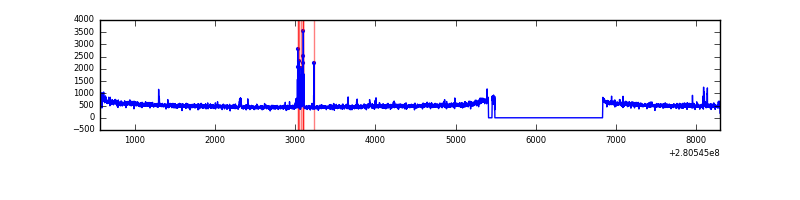 |
| C | 7736 | 6348 | 0 | 0 | 0.00% | 0.00% | 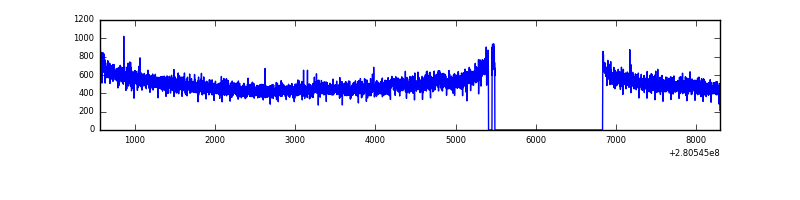 |
| D | 7736 | 6348 | 52 | 52 | 0.67% | 0.82% | 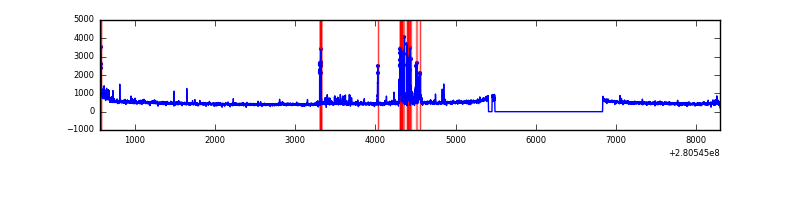 |
Top three noisy pixels from each quadrant. If the there are fewer than three noisy pixels in the level2.evt file, extra rows are filled as -1
| Pixel properties | Quadrant properties | ||||||
|---|---|---|---|---|---|---|---|
| Quadrant | DetID | PixID | Counts | Sigma | Mean | Median | Sigma |
| A | 15 | 174 | 44430 | 277.84 | 796 | 782 | 157.1 |
| A | 0 | 226 | 7030 | 39.77 | 796 | 782 | 157.1 |
| A | 12 | 194 | 5809 | 32.0 | 796 | 782 | 157.1 |
| B | 3 | 64 | 69304 | 461.91 | 800 | 782 | 148.3 |
| B | 0 | 189 | 28981 | 190.09 | 800 | 782 | 148.3 |
| B | 0 | 229 | 21351 | 138.66 | 800 | 782 | 148.3 |
| C | 14 | 238 | 121049 | 693.04 | 757 | 763 | 173.6 |
| C | 3 | 233 | 65569 | 373.39 | 757 | 763 | 173.6 |
| C | 7 | 247 | 12493 | 67.58 | 757 | 763 | 173.6 |
| D | 10 | 70 | 179128 | 974.0 | 759 | 735 | 183.2 |
| D | 1 | 52 | 129834 | 704.86 | 759 | 735 | 183.2 |
| D | 5 | 222 | 38415 | 205.73 | 759 | 735 | 183.2 |
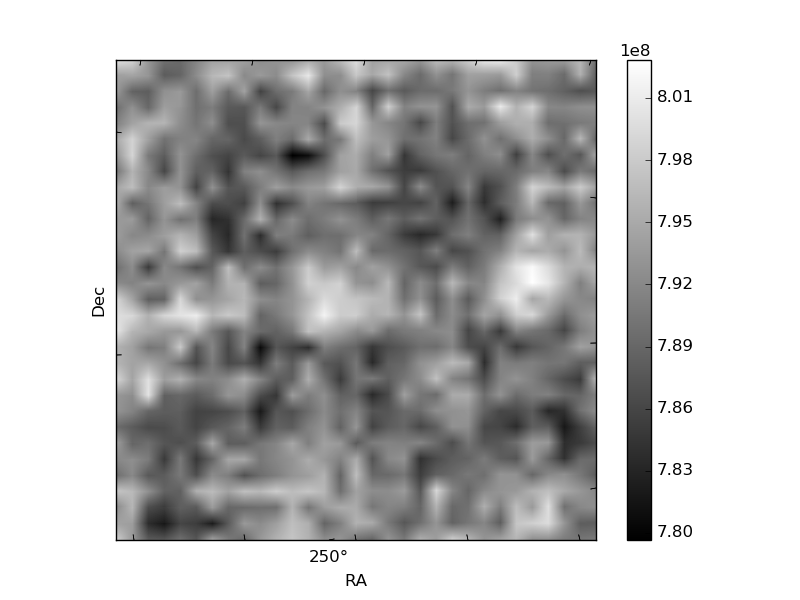
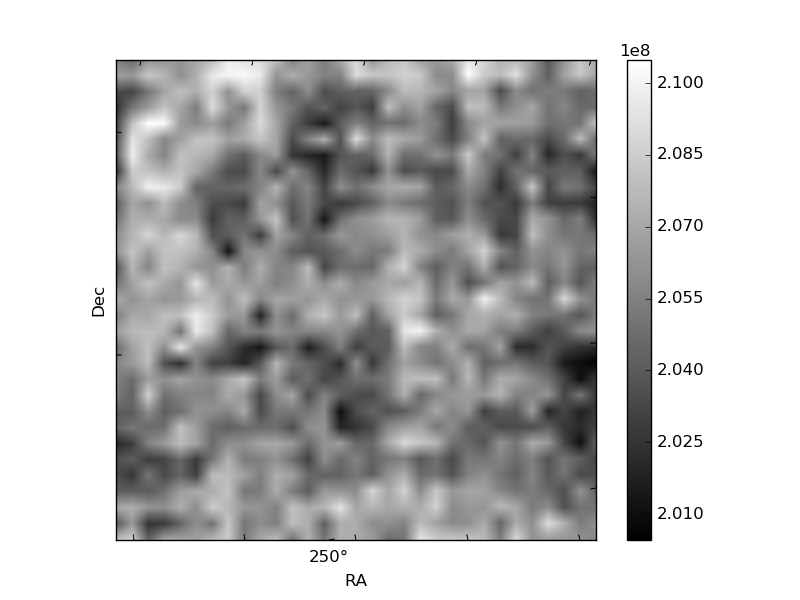
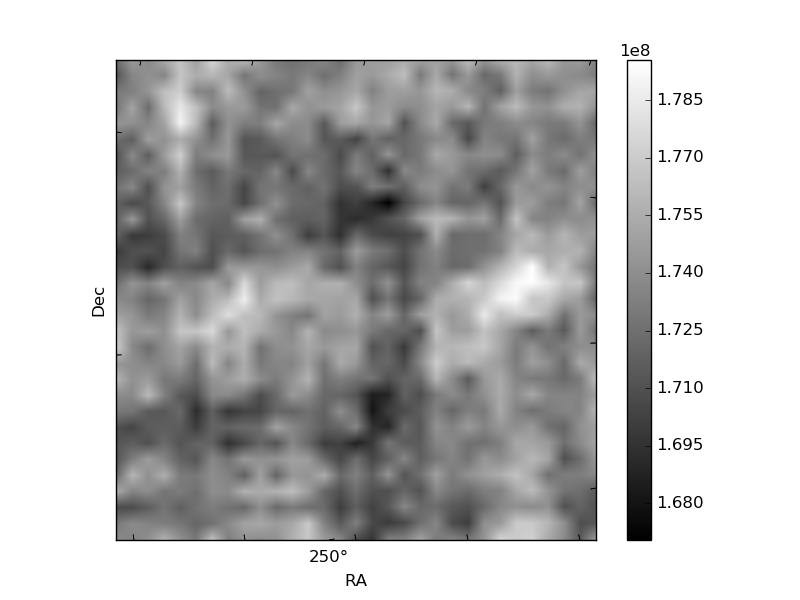
Histogram calculated using DETX and DETY for each event in the final _common_clean file
| Quadrant A | 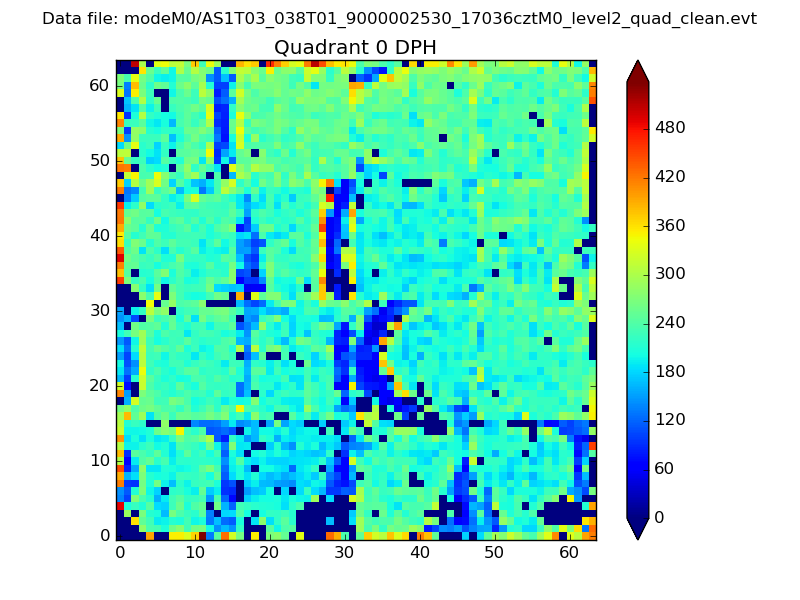 |
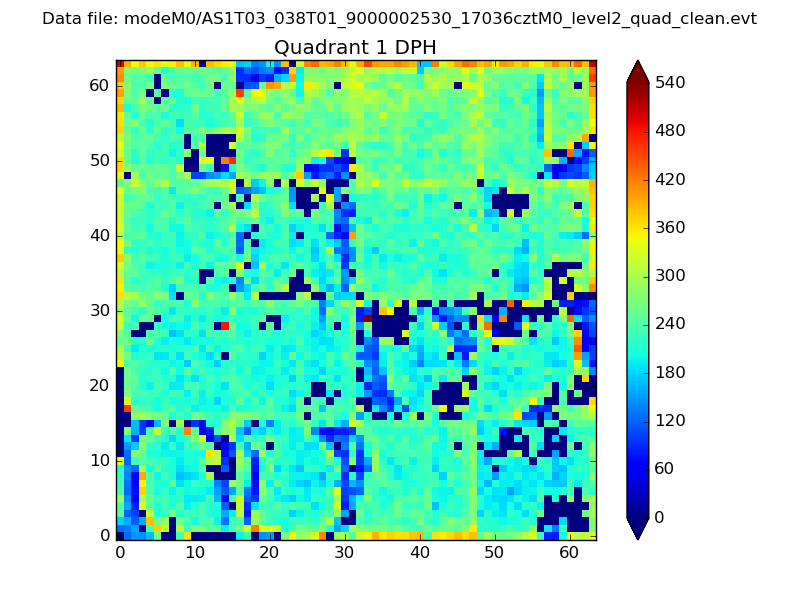 |
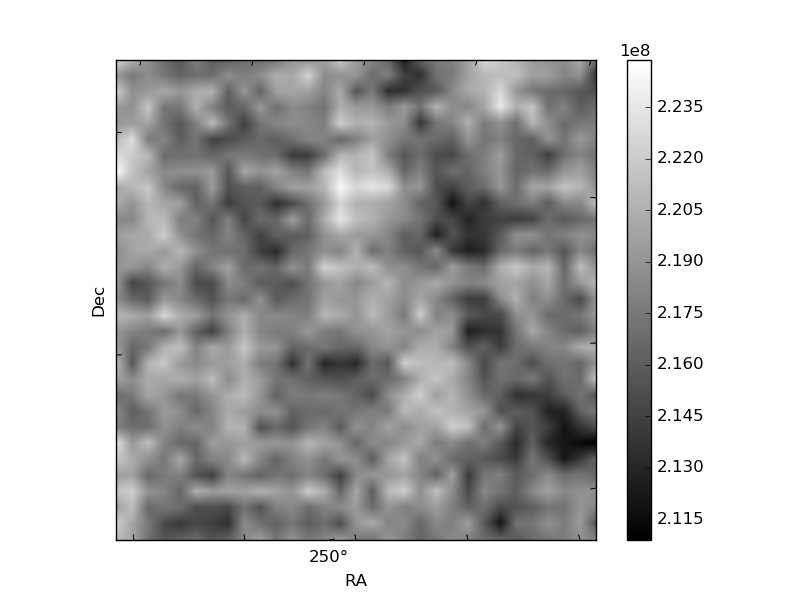
Quadrant B |
|---|---|---|---|
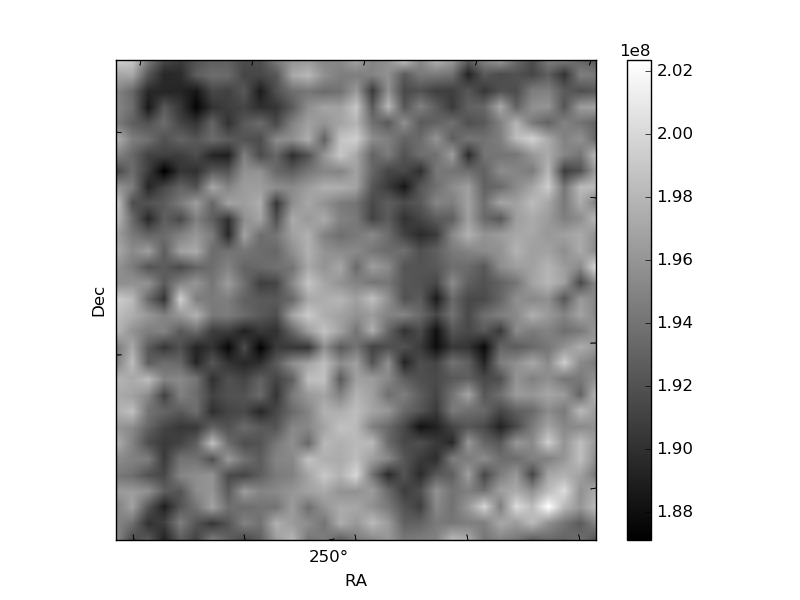
| Quadrant D | 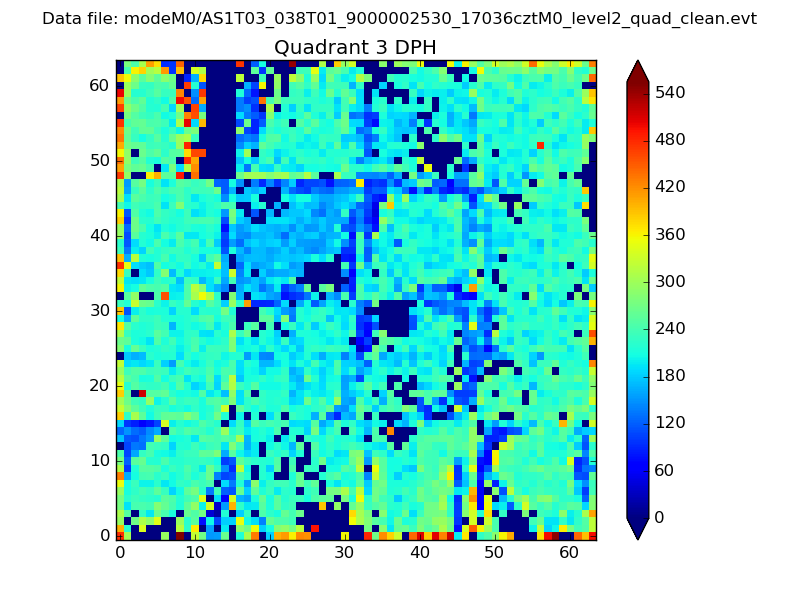 |
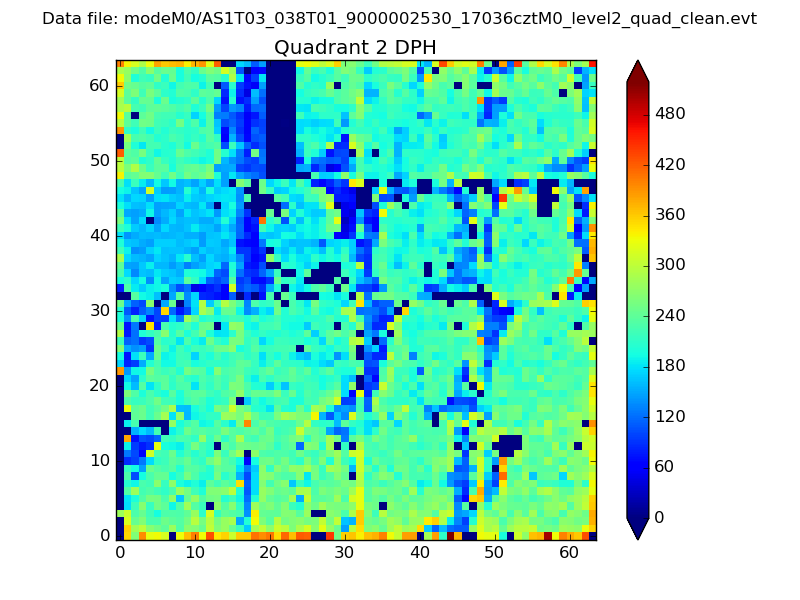 |
Quadrant C |
| Plot type | Count rate plots | Images |
|---|---|---|
| Comparison with Poisson distribution Blue bars denote a histogram of data divided into 1 sec bins. Red curve is a Poisson curve with rate = median count rate of data. |
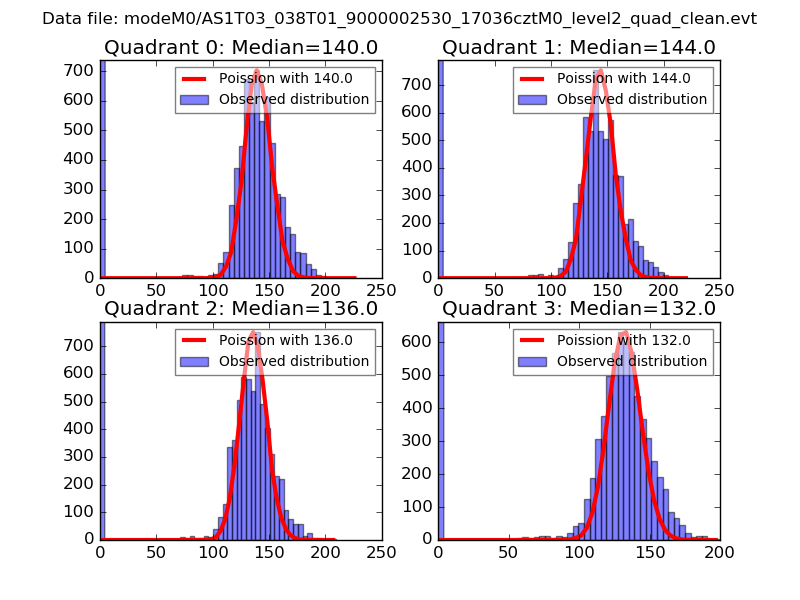 |
 |
| Quadrant-wise count rates Data is divided into 100 sec bins |
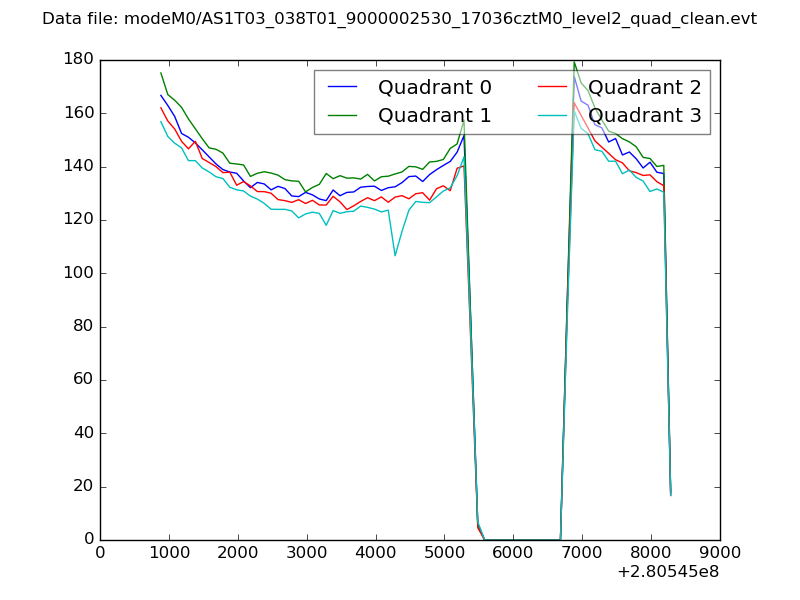 |
|
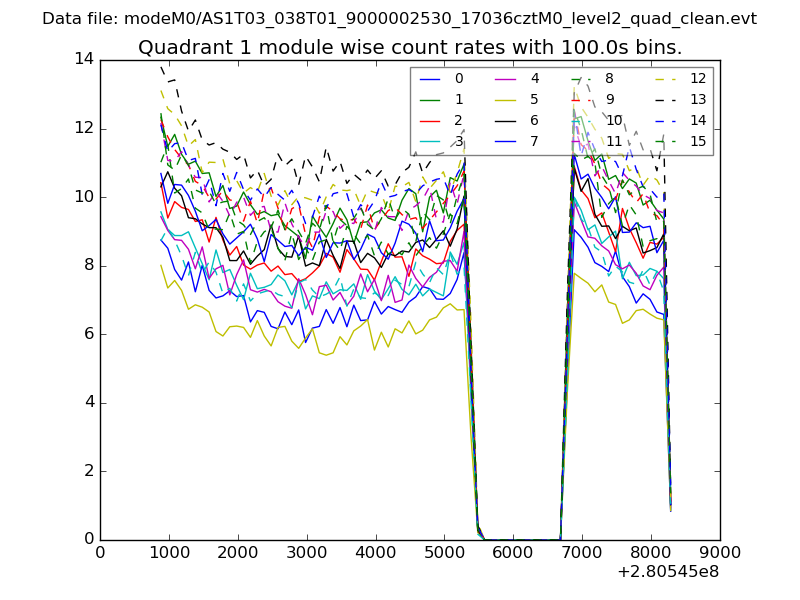
| Module-wise count rates for Quadrant A Data is divided into 100 sec bins |
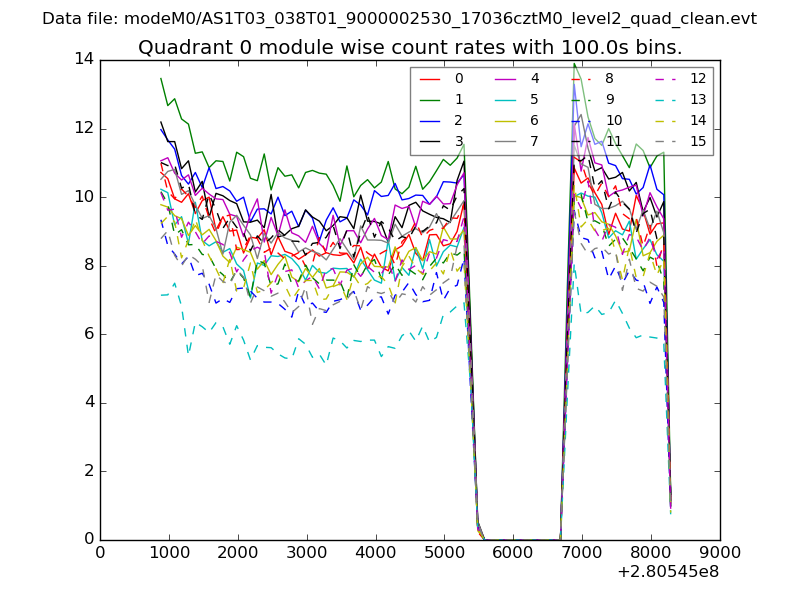 |
 |
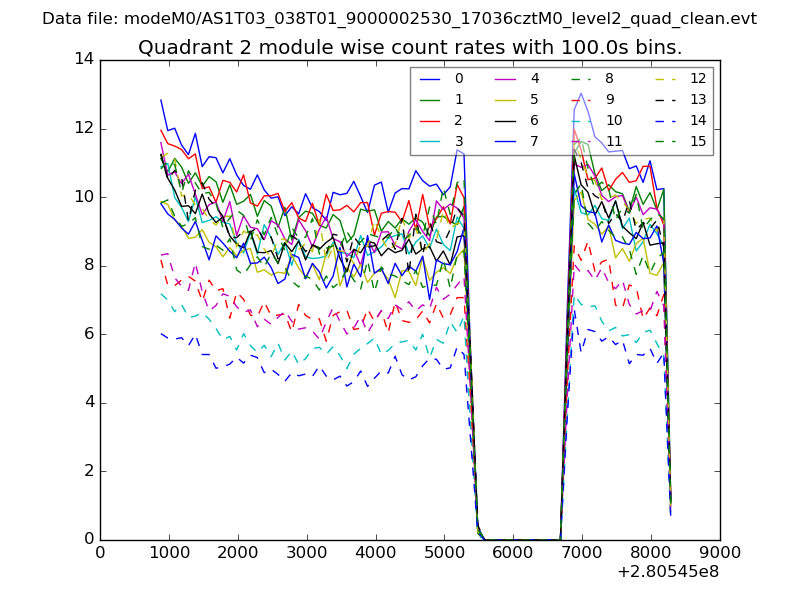
| Module-wise count rates for Quadrant B Data is divided into 100 sec bins |
 |
 |
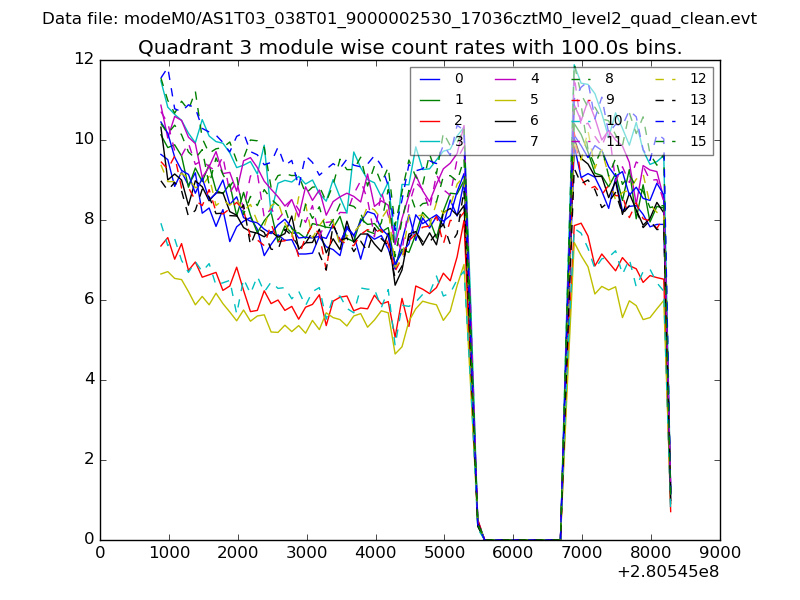
| Module-wise count rates for Quadrant C Data is divided into 100 sec bins |
 |
 |
| Module-wise count rates for Quadrant D Data is divided into 100 sec bins |
 |
 |
| Parameter | Plot |
|---|---|
| CZT HV Monitor | 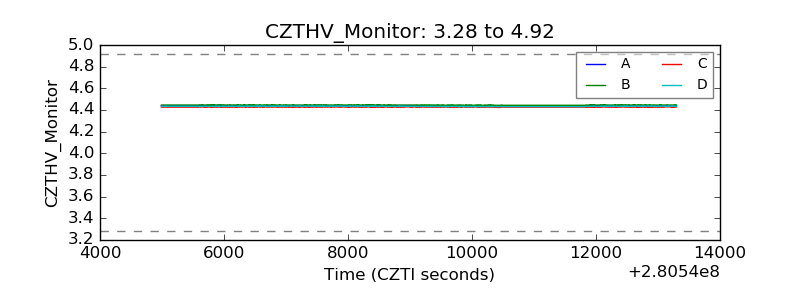 |
| D_VDD | 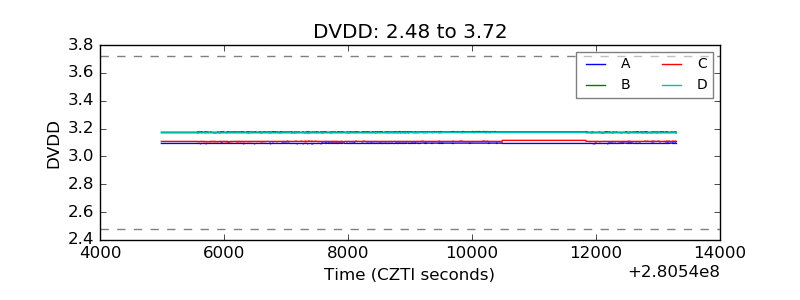 |
| Temperature 1 | 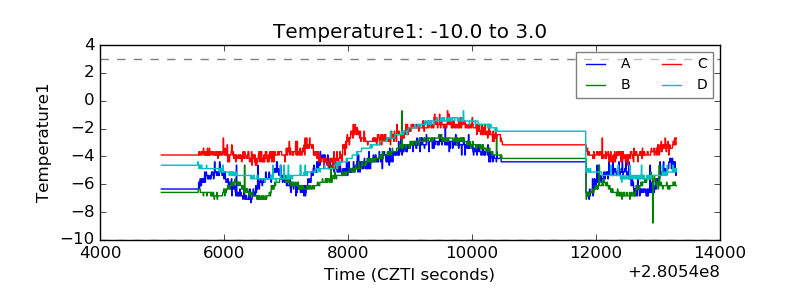 |
| Veto HV Monitor |  |
| Veto LLD | 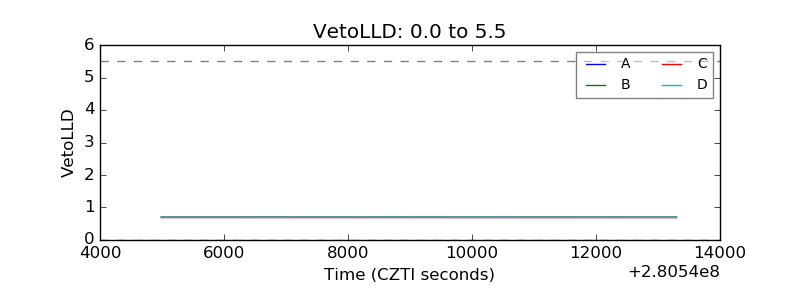 |
| Alpha Counter | 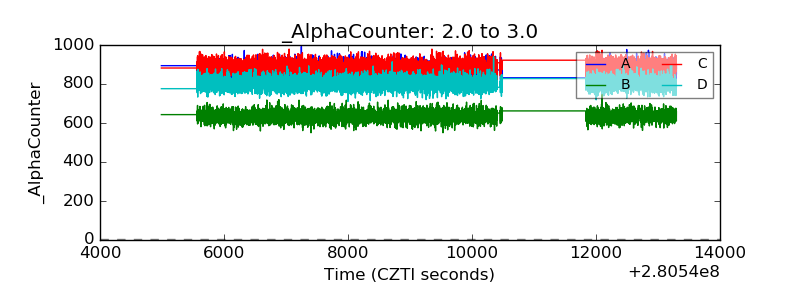 |
| _CPM_Rate | 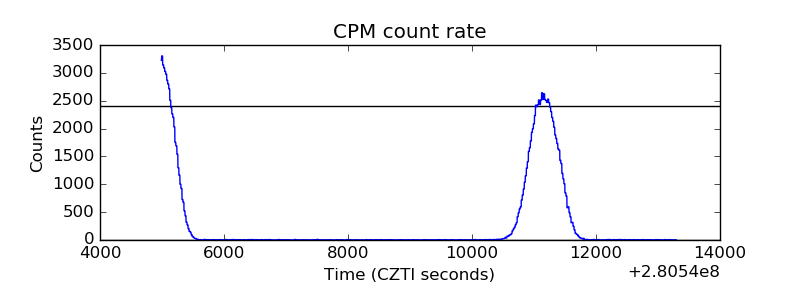 |
| CZT Counter | 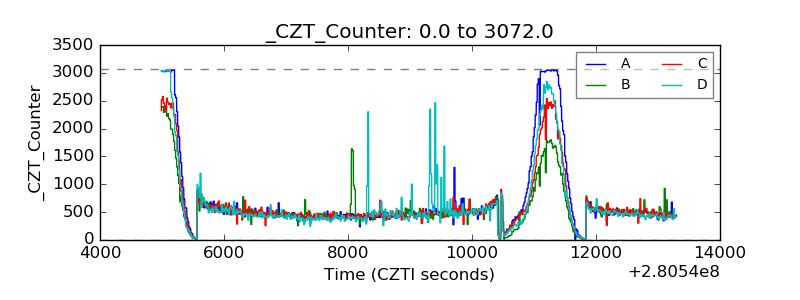 |
| +2.5 Volts monitor | 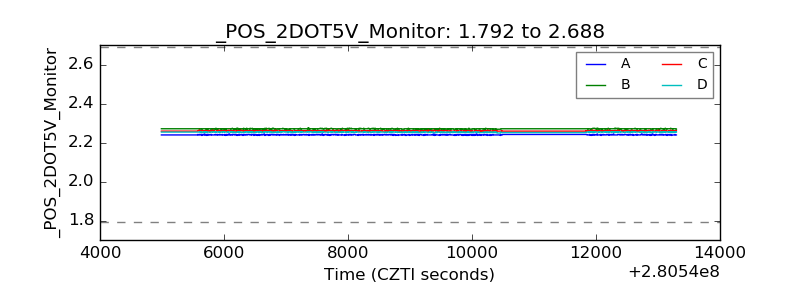 |
| +5 Volts monitor |  |
| _ROLL_ROT | 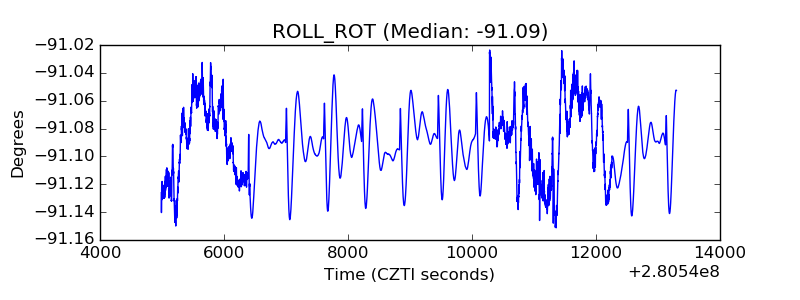 |
| _Roll_DEC | 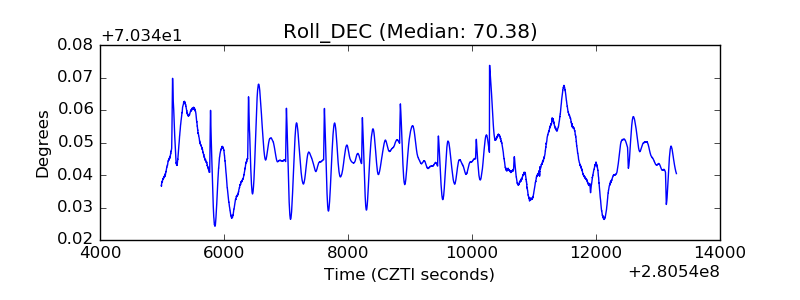 |
| _Roll_RA | 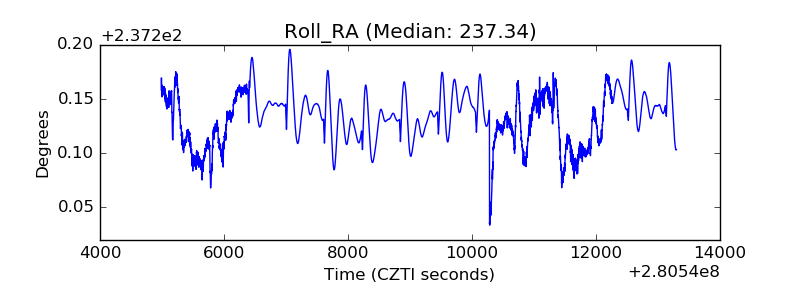 |
| Veto Counter | 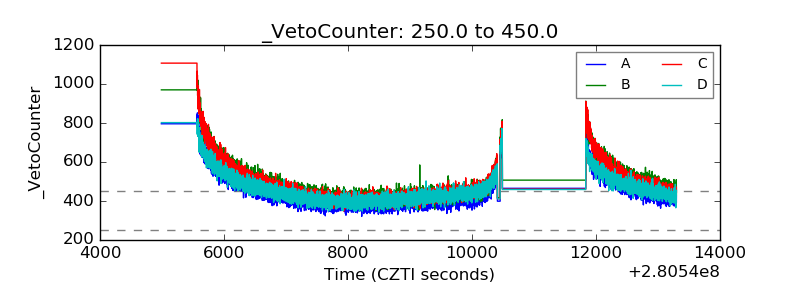 |