| Param | Original file | Final file |
|---|---|---|
| Filename | modeM0/AS1T03_038T01_9000002530_17038cztM0_level2.evt | modeM0/AS1T03_038T01_9000002530_17038cztM0_level2_quad_clean.evt |
| Size (bytes) | 434,574,720 | 101,782,080 |
| Size | 414.4 MB | 97.1 MB |
| Events in quadrant A | 2,975,126 | 677,937 |
| Events in quadrant B | 3,254,384 | 687,760 |
| Events in quadrant C | 2,906,349 | 652,139 |
| Events in quadrant D | 3,603,882 | 632,082 |
| Mode M9 | |||
|---|---|---|---|
| Quadrant | BADHDUFLAG | Total packets | Discarded packets |
| A | 0 | 10 | 0 |
| B | 0 | 10 | 0 |
| C | 0 | 10 | 0 |
| D | 0 | 10 | 0 |
| Mode M0 | |||
|---|---|---|---|
| Quadrant | BADHDUFLAG | Total packets | Discarded packets |
| A | 0 | 13042 | 1 |
| B | 0 | 13710 | 1 |
| C | 0 | 12715 | 1 |
| D | 0 | 15152 | 1 |
| Mode SS | |||
|---|---|---|---|
| Quadrant | BADHDUFLAG | Total packets | Discarded packets |
| A | 0 | 128 | 0 |
| B | 0 | 128 | 0 |
| C | 0 | 128 | 0 |
| D | 0 | 128 | 0 |
| Quadrant | Total seconds | Saturated seconds | Saturation percentage |
|---|---|---|---|
| A | 6189 | 87 | 1.405720% |
| B | 6190 | 152 | 2.455574% |
| C | 6190 | 63 | 1.017771% |
| D | 6190 | 118 | 1.906300% |
Noise dominated data is calculated using 1-second bins in cleaned event files. If a bin has >2000 counts, and if more than 50% of those come from <1% of pixels, then it is considered to be noise-dominated and hence unusable.
| Quadrant | # 1 sec bins | Bins with >0 counts | Bins with >2000 counts | High rate bins dominated by noise | Noise dominated (total time) | Noise dominated (detector-on time) | Marked lightcurve |
|---|---|---|---|---|---|---|---|
| A | 7255 | 6191 | 16 | 16 | 0.22% | 0.26% | 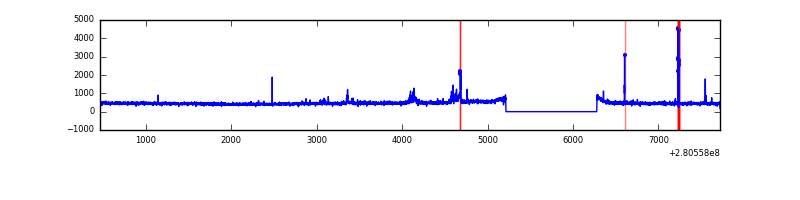 |
| B | 7256 | 6192 | 42 | 42 | 0.58% | 0.68% | 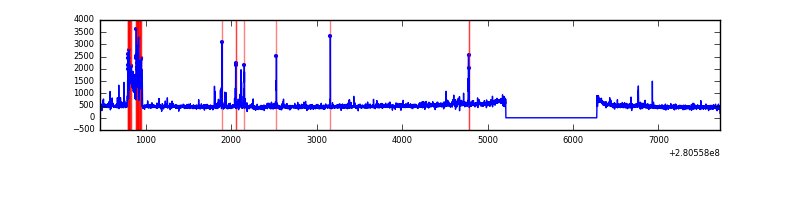 |
| C | 7256 | 6192 | 2 | 2 | 0.03% | 0.03% | 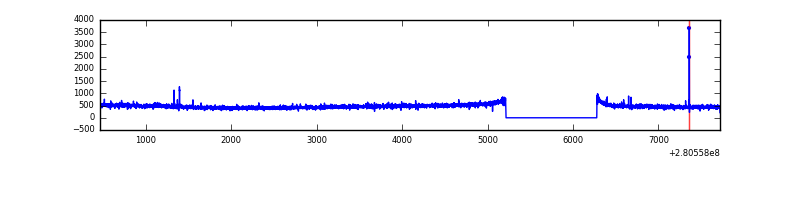 |
| D | 7256 | 6192 | 66 | 66 | 0.91% | 1.07% | 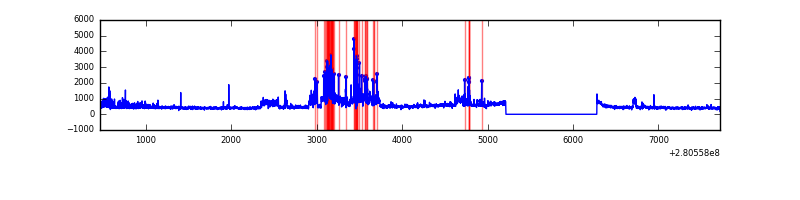 |
Top three noisy pixels from each quadrant. If the there are fewer than three noisy pixels in the level2.evt file, extra rows are filled as -1
| Pixel properties | Quadrant properties | ||||||
|---|---|---|---|---|---|---|---|
| Quadrant | DetID | PixID | Counts | Sigma | Mean | Median | Sigma |
| A | 15 | 174 | 91978 | 615.97 | 735 | 720 | 148.2 |
| A | 4 | 2 | 40694 | 269.81 | 735 | 720 | 148.2 |
| A | 0 | 254 | 16126 | 103.99 | 735 | 720 | 148.2 |
| B | 0 | 229 | 320262 | 2290.53 | 732 | 713 | 139.5 |
| B | 0 | 189 | 38473 | 270.66 | 732 | 713 | 139.5 |
| B | 12 | 111 | 16314 | 111.83 | 732 | 713 | 139.5 |
| C | 14 | 238 | 111435 | 689.66 | 695 | 698 | 160.6 |
| C | 3 | 233 | 62508 | 384.95 | 695 | 698 | 160.6 |
| C | 9 | 160 | 13253 | 78.19 | 695 | 698 | 160.6 |
| D | 1 | 52 | 473898 | 2784.74 | 703 | 682 | 169.9 |
| D | 5 | 222 | 309895 | 1819.63 | 703 | 682 | 169.9 |
| D | 10 | 70 | 99399 | 580.92 | 703 | 682 | 169.9 |
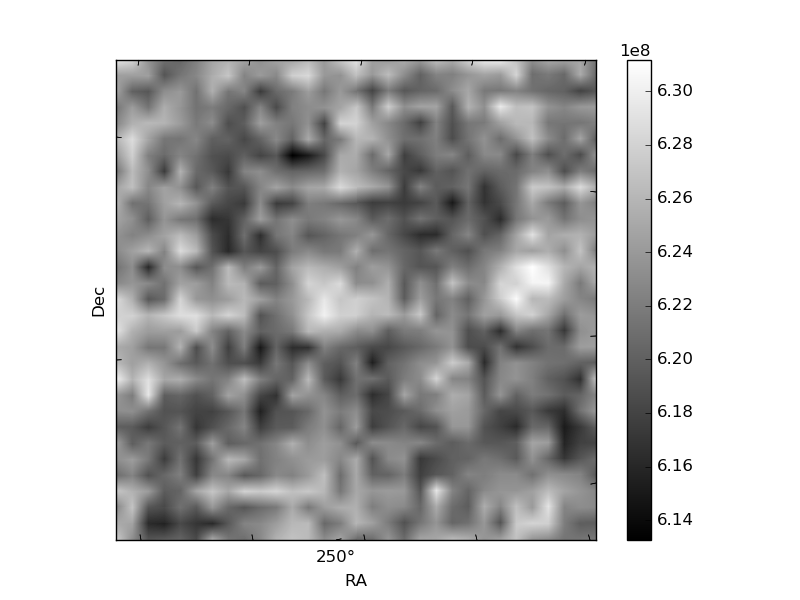
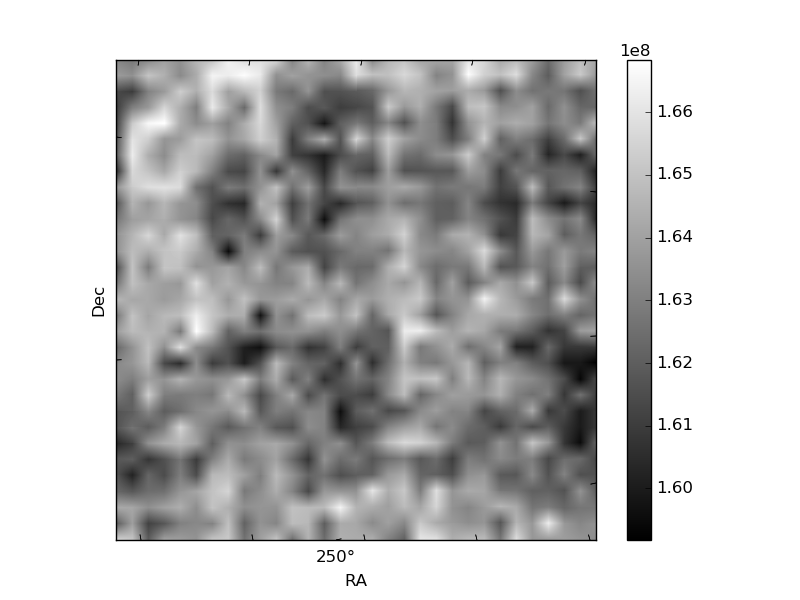
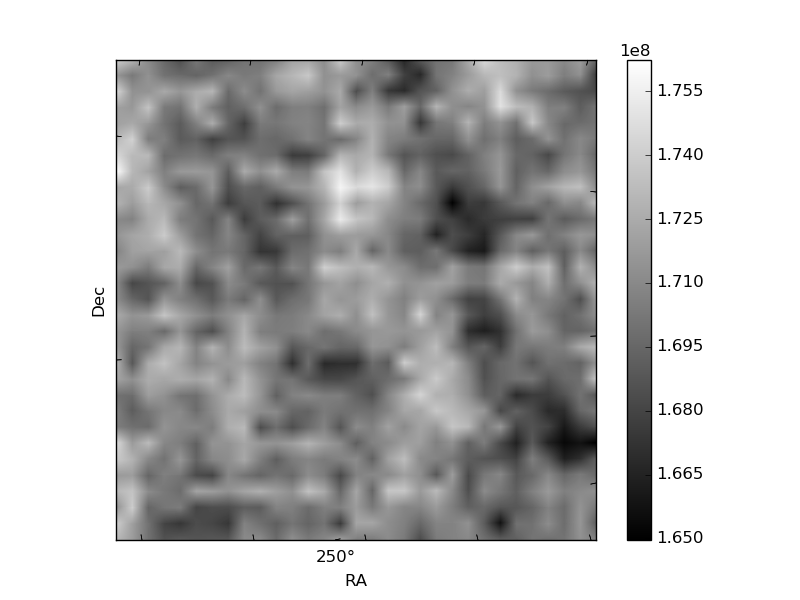
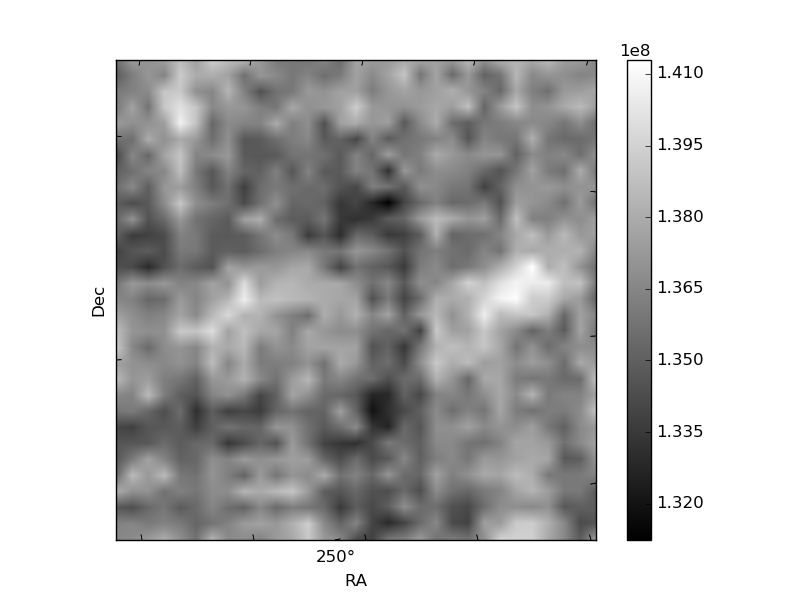
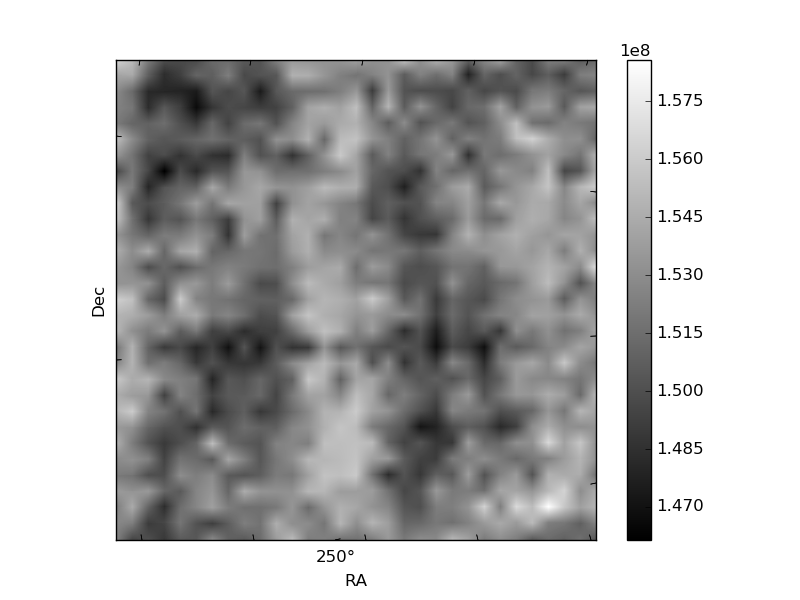
Histogram calculated using DETX and DETY for each event in the final _common_clean file
| Quadrant A | 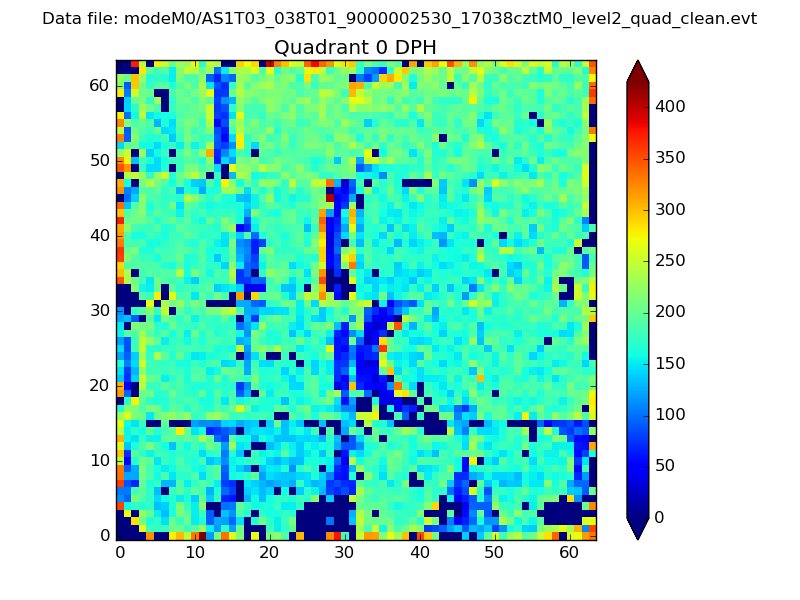 |
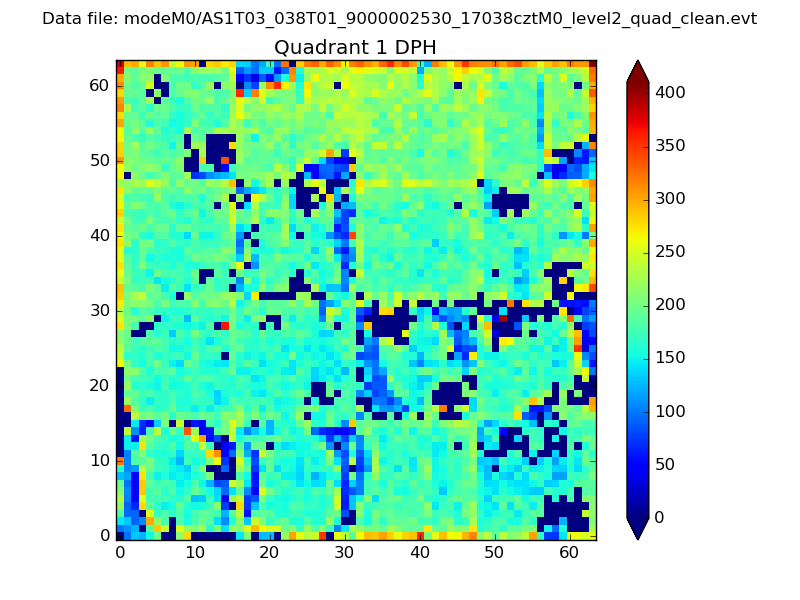 |
Quadrant B |
|---|---|---|---|
| Quadrant D | 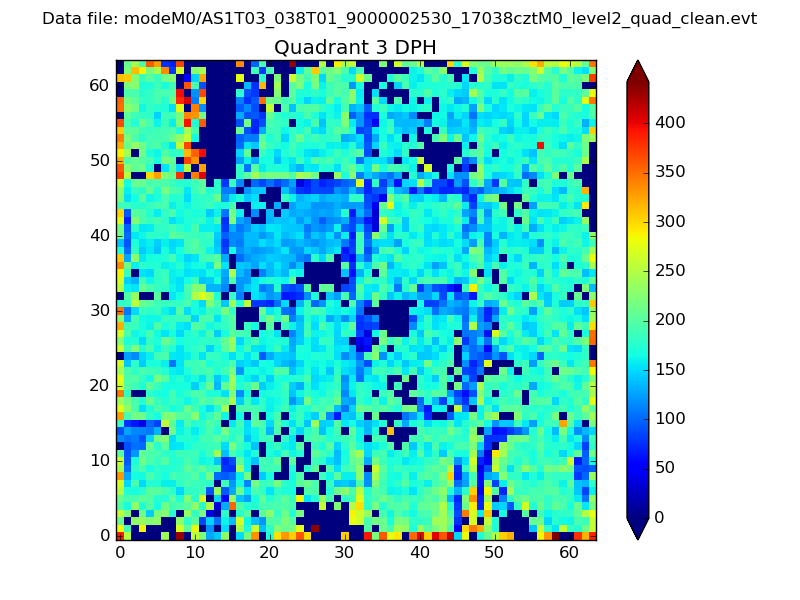 |
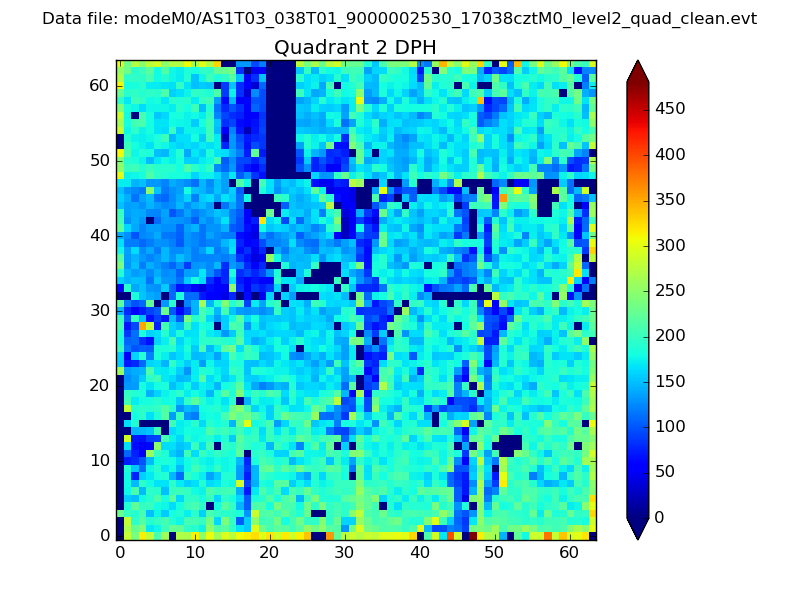 |
Quadrant C |
| Plot type | Count rate plots | Images |
|---|---|---|
| Comparison with Poisson distribution Blue bars denote a histogram of data divided into 1 sec bins. Red curve is a Poisson curve with rate = median count rate of data. |
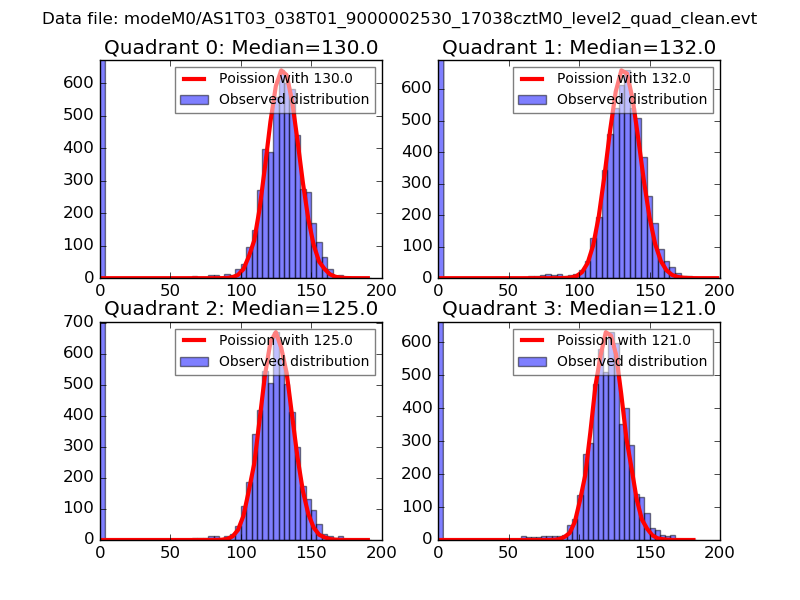 |
 |
| Quadrant-wise count rates Data is divided into 100 sec bins |
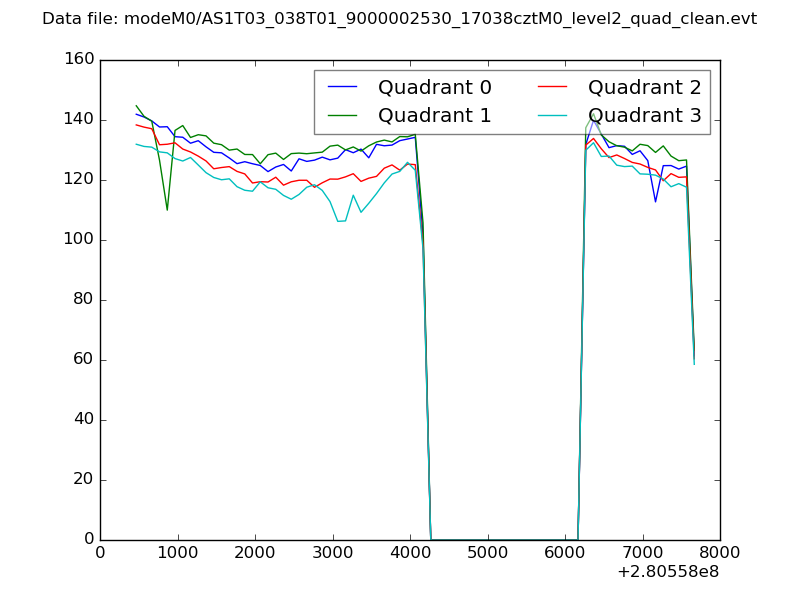 |
|
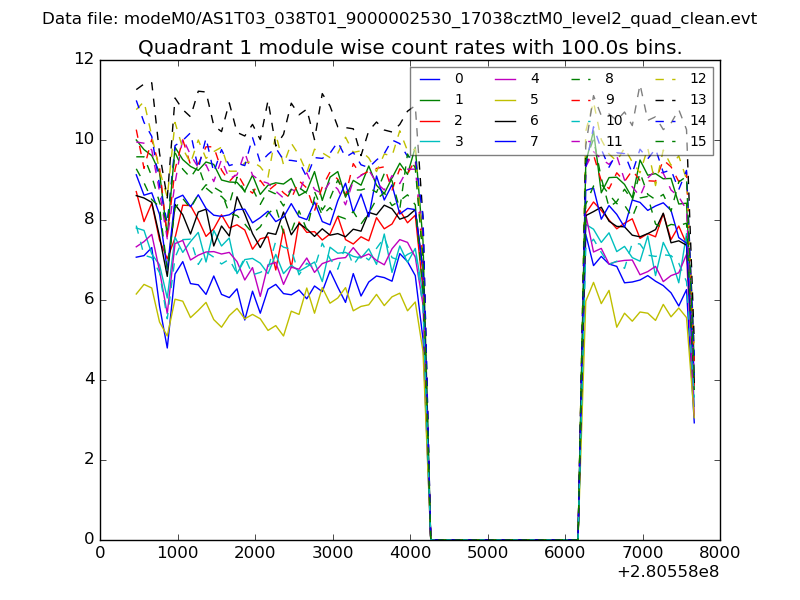
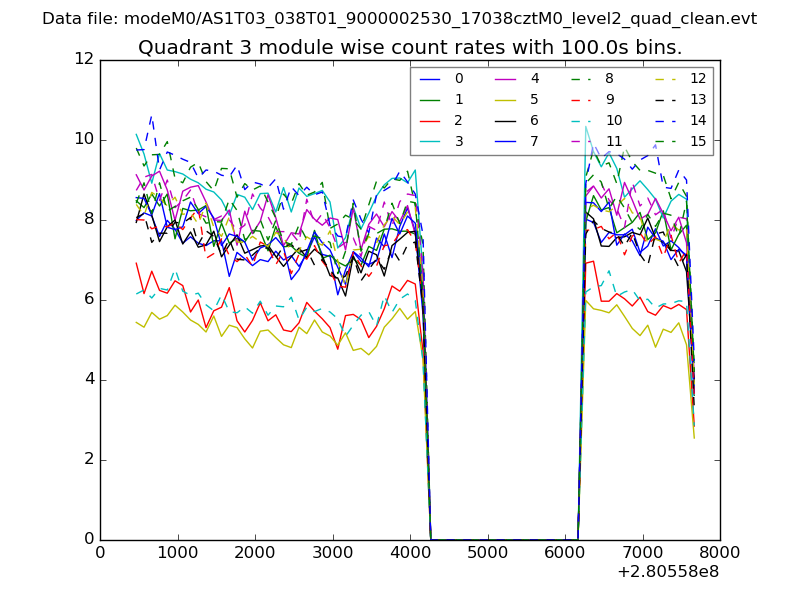
| Module-wise count rates for Quadrant A Data is divided into 100 sec bins |
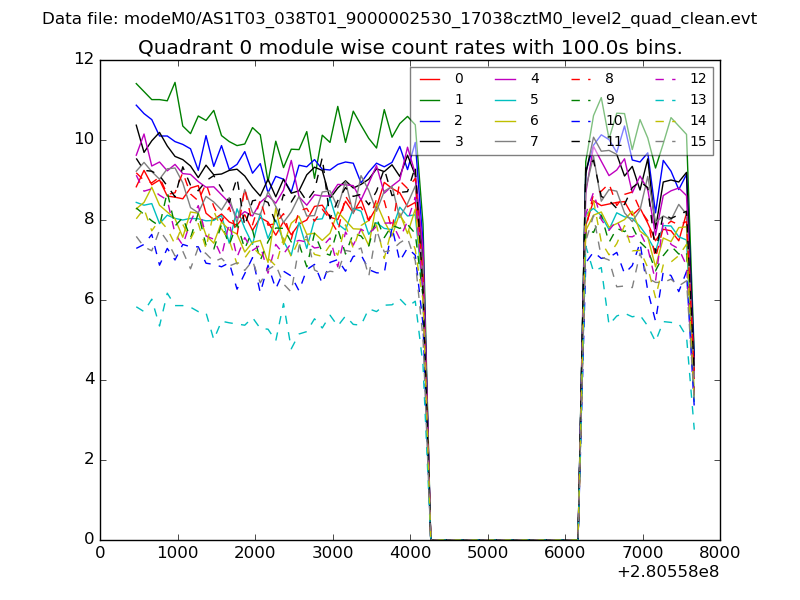 |
 |
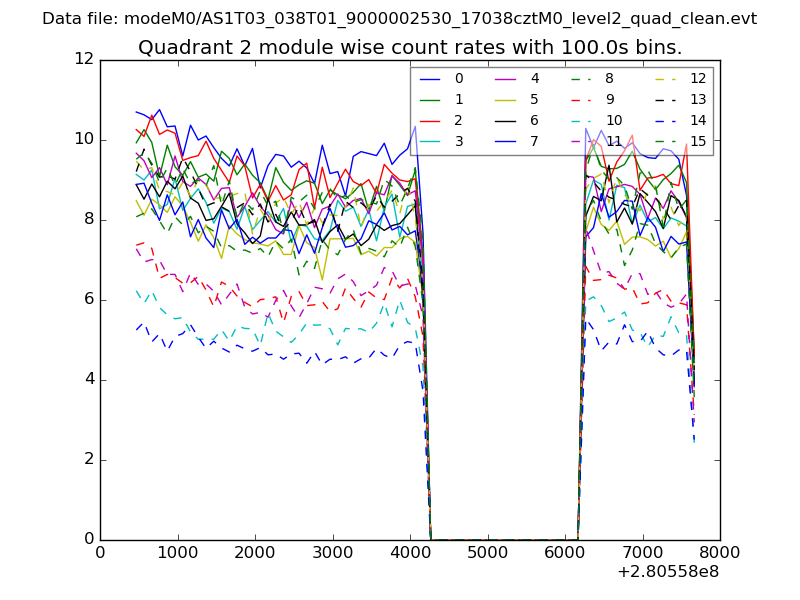
| Module-wise count rates for Quadrant B Data is divided into 100 sec bins |
 |
 |
| Module-wise count rates for Quadrant C Data is divided into 100 sec bins |
 |
 |
| Module-wise count rates for Quadrant D Data is divided into 100 sec bins |
 |
 |
| Parameter | Plot |
|---|---|
| CZT HV Monitor |  |
| D_VDD | 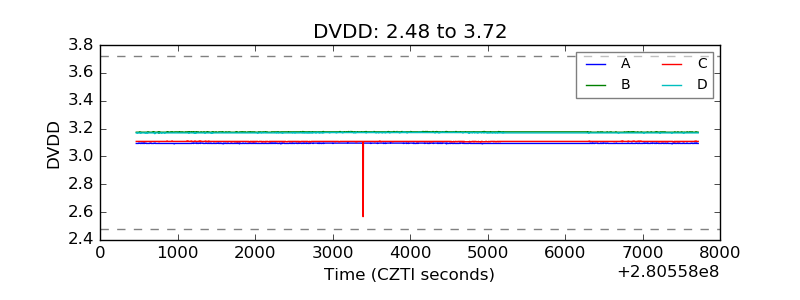 |
| Temperature 1 | 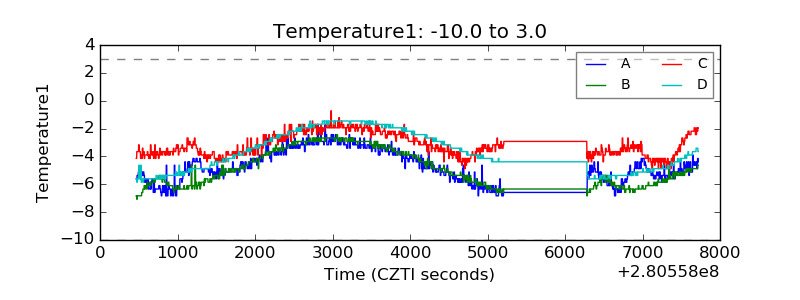 |
| Veto HV Monitor | 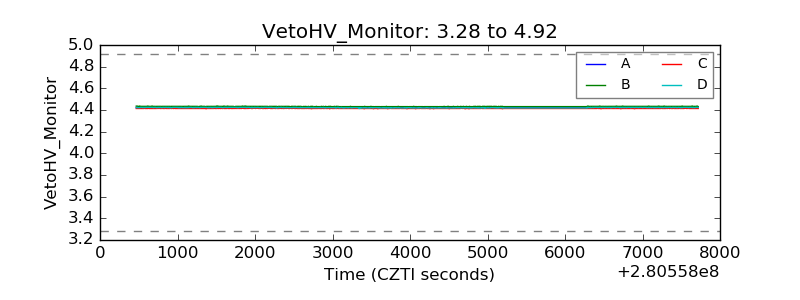 |
| Veto LLD | 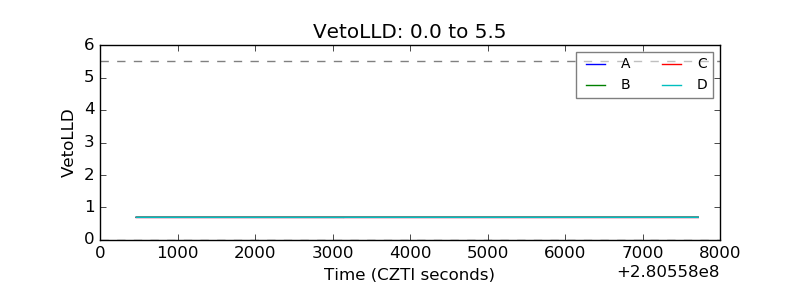 |
| Alpha Counter | 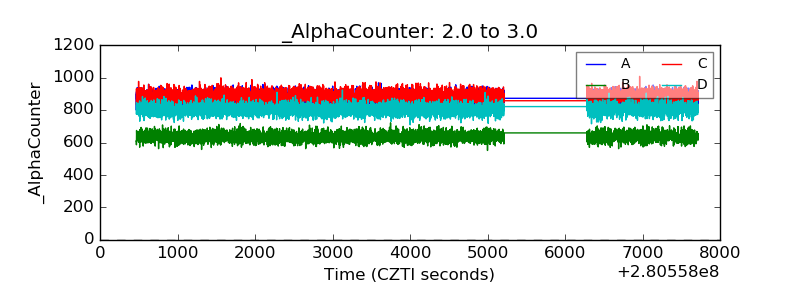 |
| _CPM_Rate | 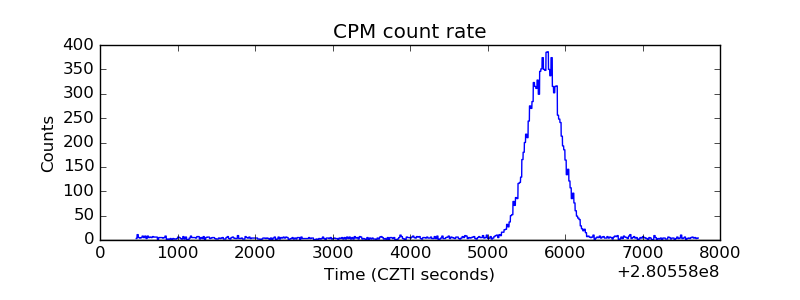 |
| CZT Counter | 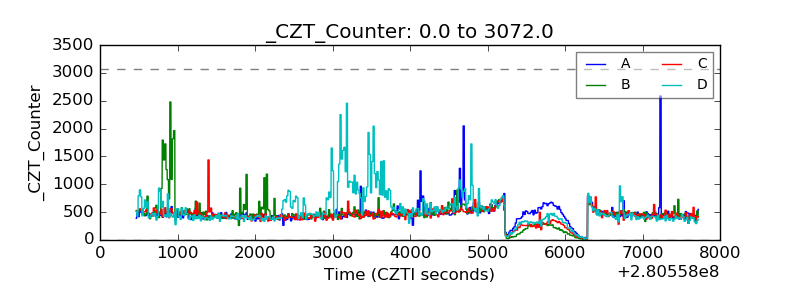 |
| +2.5 Volts monitor | 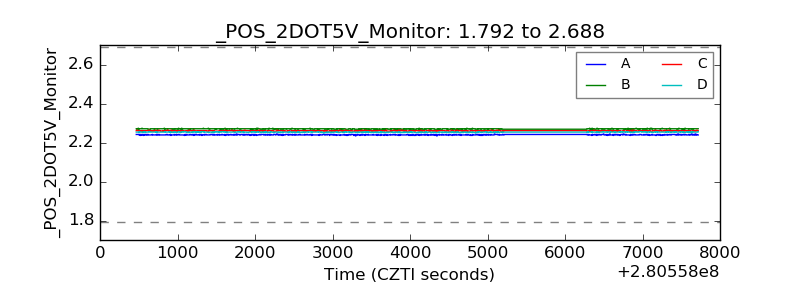 |
| +5 Volts monitor | 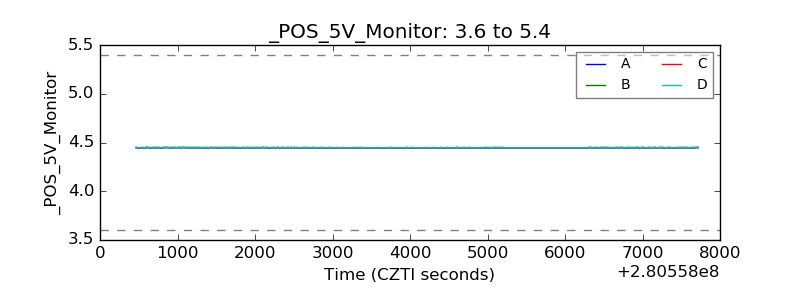 |
| _ROLL_ROT | 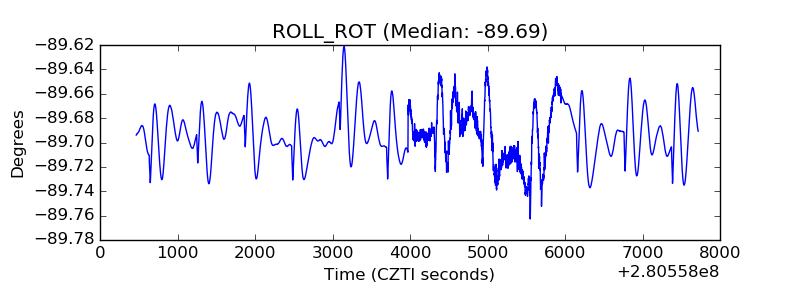 |
| _Roll_DEC |  |
| _Roll_RA | 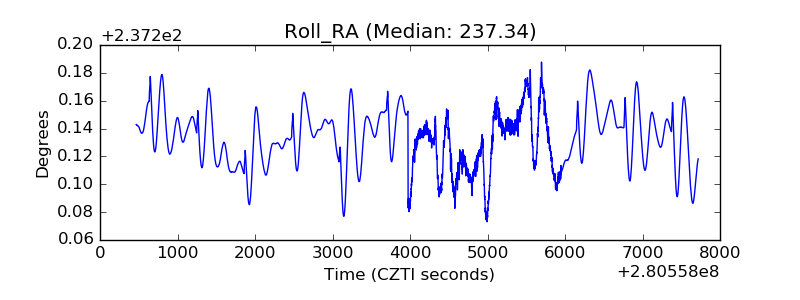 |
| Veto Counter | 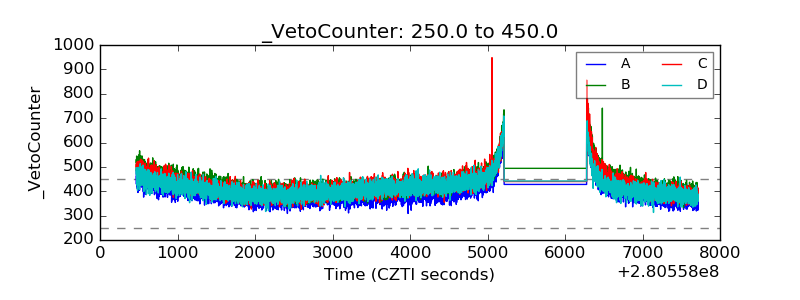 |