| Param | Original file | Final file |
|---|---|---|
| Filename | modeM0/AS1T03_038T01_9000002530_17040cztM0_level2.evt | modeM0/AS1T03_038T01_9000002530_17040cztM0_level2_quad_clean.evt |
| Size (bytes) | 527,140,800 | 116,089,920 |
| Size | 502.7 MB | 110.7 MB |
| Events in quadrant A | 3,749,209 | 761,770 |
| Events in quadrant B | 3,497,342 | 783,108 |
| Events in quadrant C | 4,457,530 | 732,516 |
| Events in quadrant D | 3,758,518 | 723,918 |
| Mode M9 | |||
|---|---|---|---|
| Quadrant | BADHDUFLAG | Total packets | Discarded packets |
| A | 0 | 2 | 0 |
| B | 0 | 2 | 0 |
| C | 0 | 2 | 0 |
| D | 0 | 2 | 0 |
| Mode M0 | |||
|---|---|---|---|
| Quadrant | BADHDUFLAG | Total packets | Discarded packets |
| A | 0 | 16223 | 1 |
| B | 0 | 15368 | 1 |
| C | 0 | 18185 | 1 |
| D | 0 | 16315 | 1 |
| Mode SS | |||
|---|---|---|---|
| Quadrant | BADHDUFLAG | Total packets | Discarded packets |
| A | 0 | 150 | 0 |
| B | 0 | 150 | 0 |
| C | 0 | 150 | 0 |
| D | 0 | 150 | 0 |
| Quadrant | Total seconds | Saturated seconds | Saturation percentage |
|---|---|---|---|
| A | 7396 | 259 | 3.501893% |
| B | 7397 | 171 | 2.311748% |
| C | 7397 | 258 | 3.487901% |
| D | 7397 | 244 | 3.298635% |
Noise dominated data is calculated using 1-second bins in cleaned event files. If a bin has >2000 counts, and if more than 50% of those come from <1% of pixels, then it is considered to be noise-dominated and hence unusable.
| Quadrant | # 1 sec bins | Bins with >0 counts | Bins with >2000 counts | High rate bins dominated by noise | Noise dominated (total time) | Noise dominated (detector-on time) | Marked lightcurve |
|---|---|---|---|---|---|---|---|
| A | 7542 | 7399 | 79 | 79 | 1.05% | 1.07% | 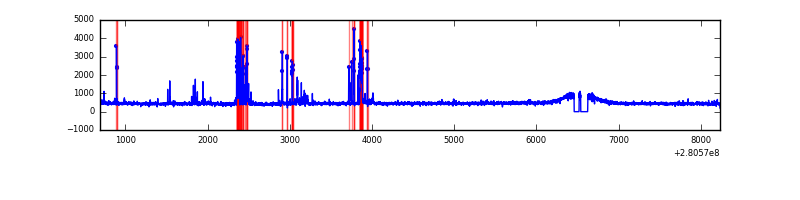 |
| B | 7543 | 7400 | 1 | 1 | 0.01% | 0.01% | 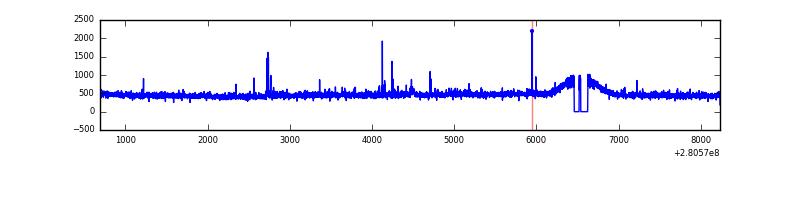 |
| C | 7543 | 7400 | 0 | 0 | 0.00% | 0.00% | 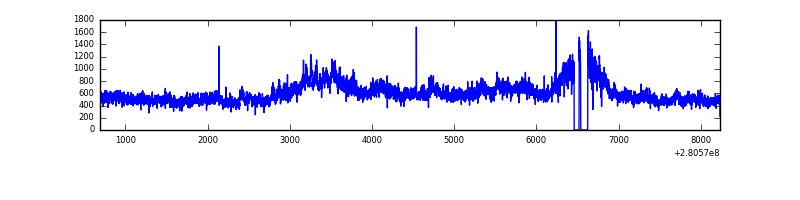 |
| D | 7543 | 7400 | 68 | 68 | 0.90% | 0.92% | 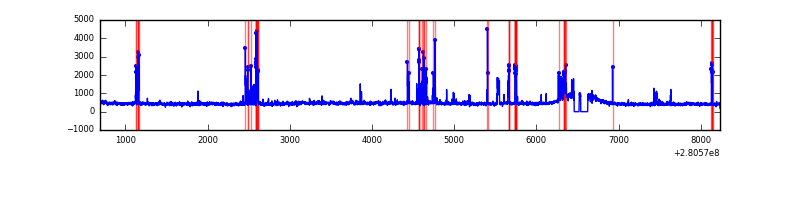 |
Top three noisy pixels from each quadrant. If the there are fewer than three noisy pixels in the level2.evt file, extra rows are filled as -1
| Pixel properties | Quadrant properties | ||||||
|---|---|---|---|---|---|---|---|
| Quadrant | DetID | PixID | Counts | Sigma | Mean | Median | Sigma |
| A | 4 | 2 | 257944 | 1454.17 | 871 | 850 | 176.8 |
| A | 15 | 174 | 73428 | 410.51 | 871 | 850 | 176.8 |
| A | 0 | 254 | 53819 | 299.6 | 871 | 850 | 176.8 |
| B | 0 | 229 | 35945 | 208.9 | 870 | 847 | 168.0 |
| B | 0 | 189 | 20780 | 118.64 | 870 | 847 | 168.0 |
| B | 12 | 111 | 20004 | 114.02 | 870 | 847 | 168.0 |
| C | 3 | 233 | 1113012 | 5771.21 | 822 | 823 | 192.7 |
| C | 14 | 238 | 126463 | 651.95 | 822 | 823 | 192.7 |
| C | 9 | 160 | 6839 | 31.22 | 822 | 823 | 192.7 |
| D | 1 | 52 | 280233 | 1372.53 | 843 | 816 | 203.6 |
| D | 10 | 70 | 145124 | 708.86 | 843 | 816 | 203.6 |
| D | 12 | 235 | 93304 | 454.31 | 843 | 816 | 203.6 |
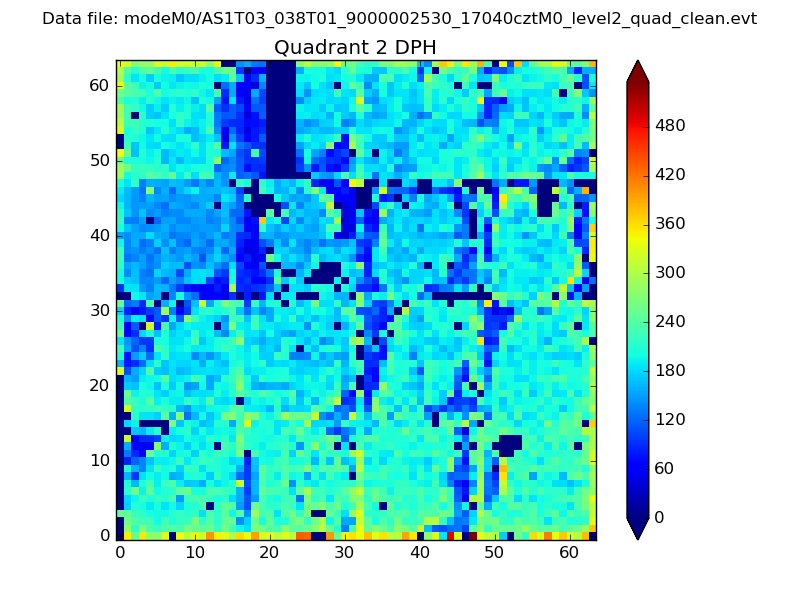
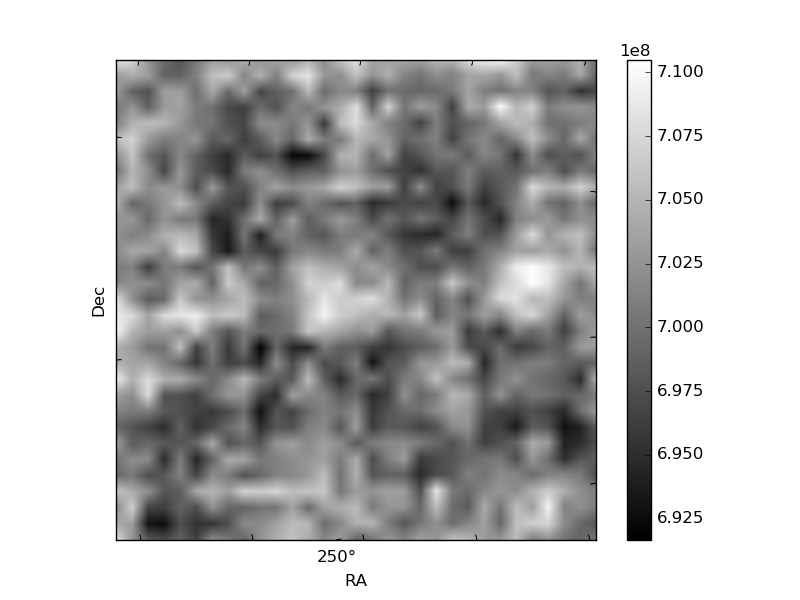
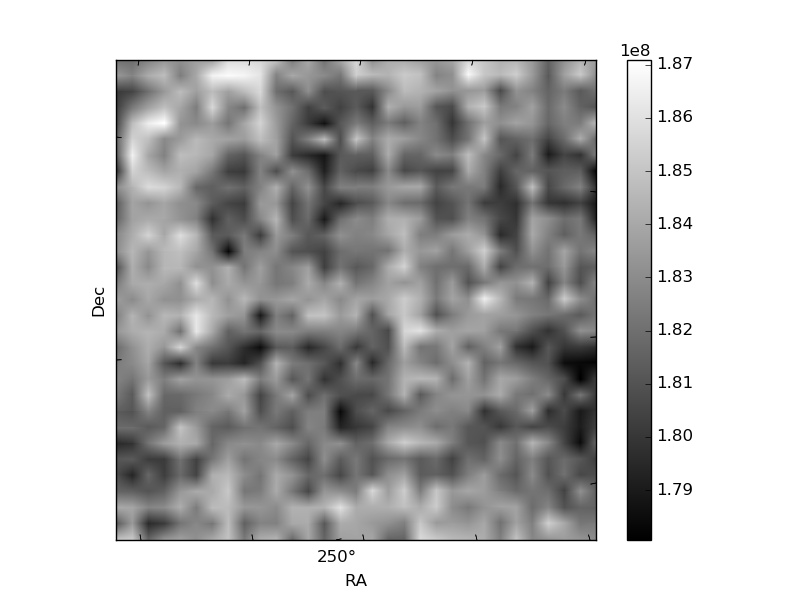
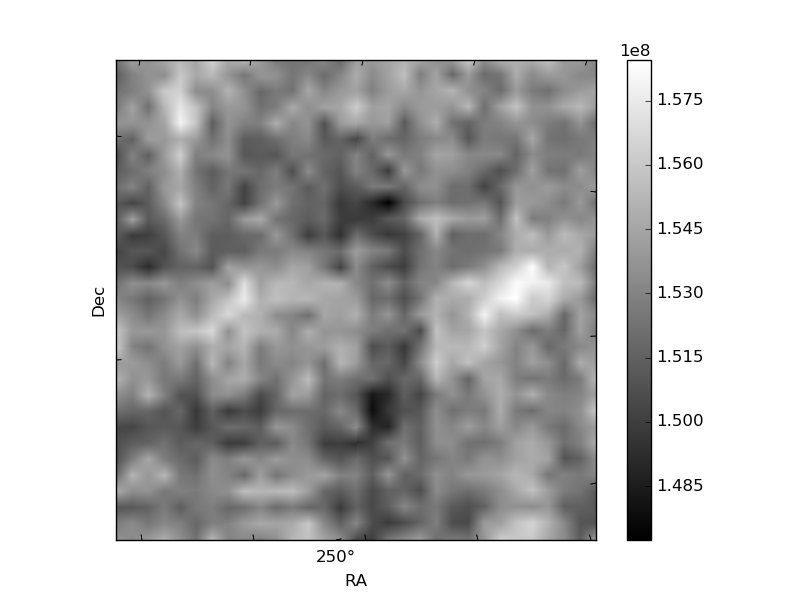
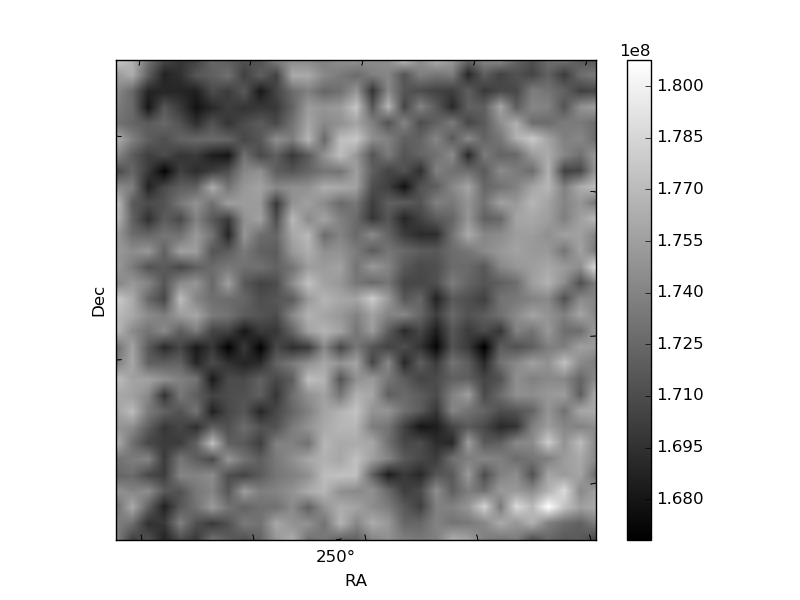
Histogram calculated using DETX and DETY for each event in the final _common_clean file
| Quadrant A | 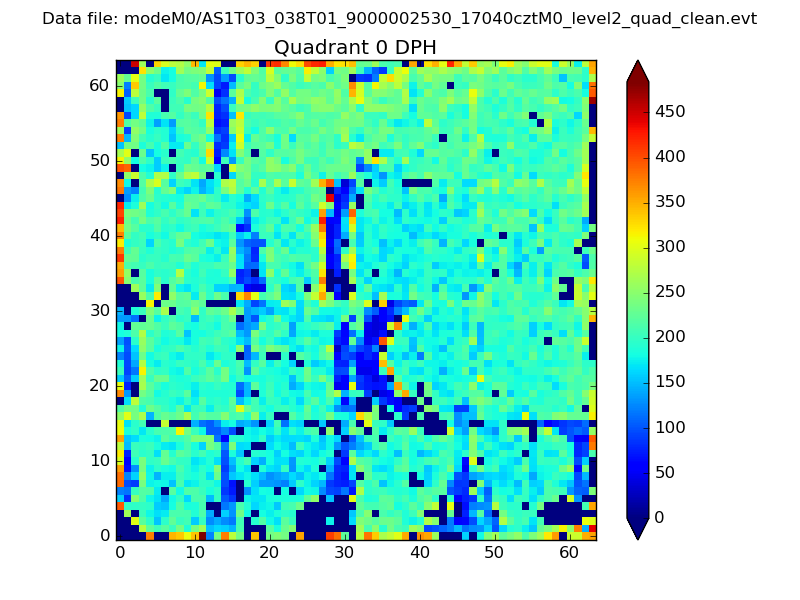 |
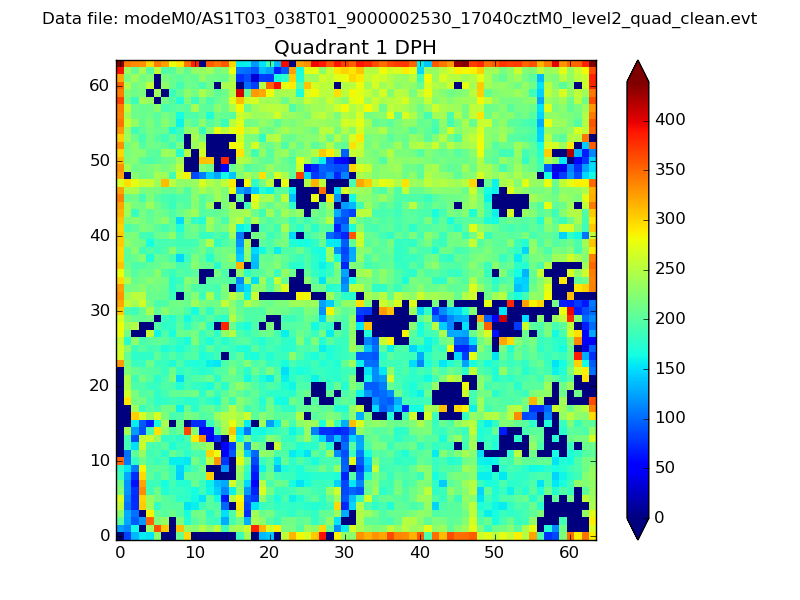 |
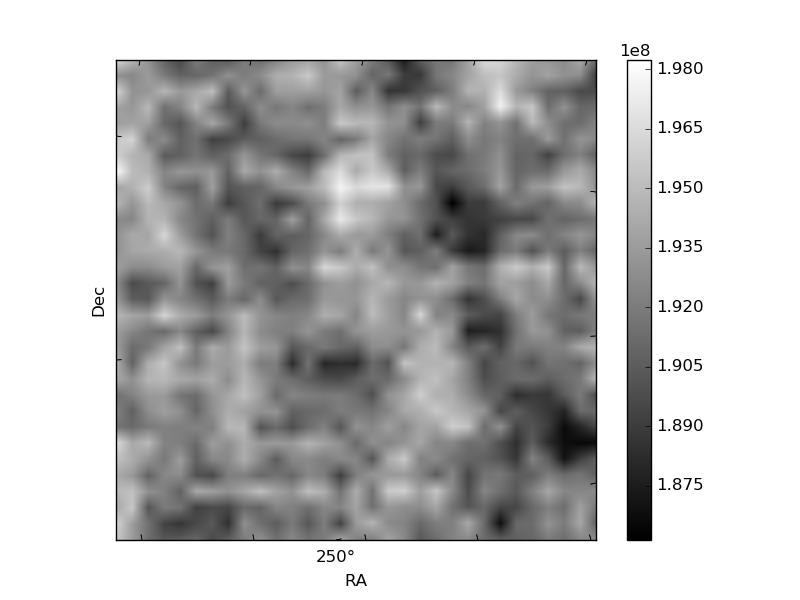
Quadrant B |
|---|---|---|---|
| Quadrant D | 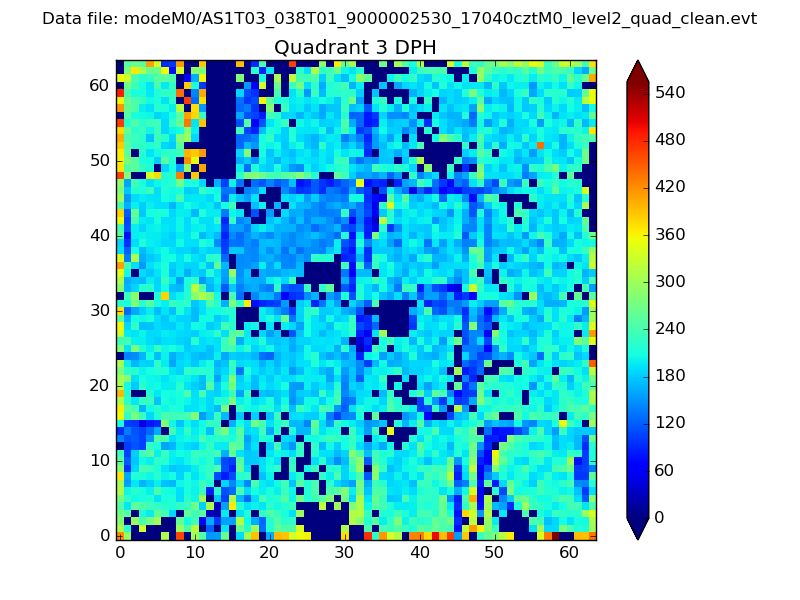 |
 |
Quadrant C |
| Plot type | Count rate plots | Images |
|---|---|---|
| Comparison with Poisson distribution Blue bars denote a histogram of data divided into 1 sec bins. Red curve is a Poisson curve with rate = median count rate of data. |
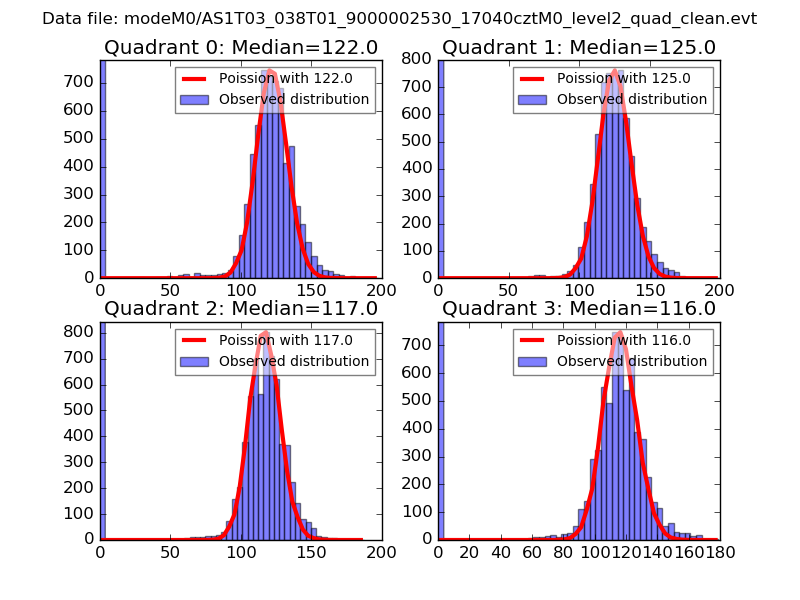 |
 |
| Quadrant-wise count rates Data is divided into 100 sec bins |
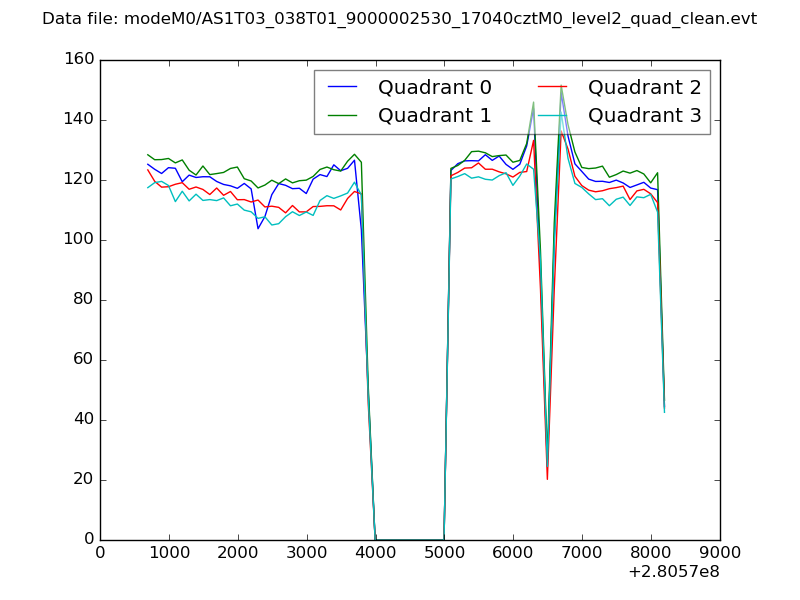 |
|
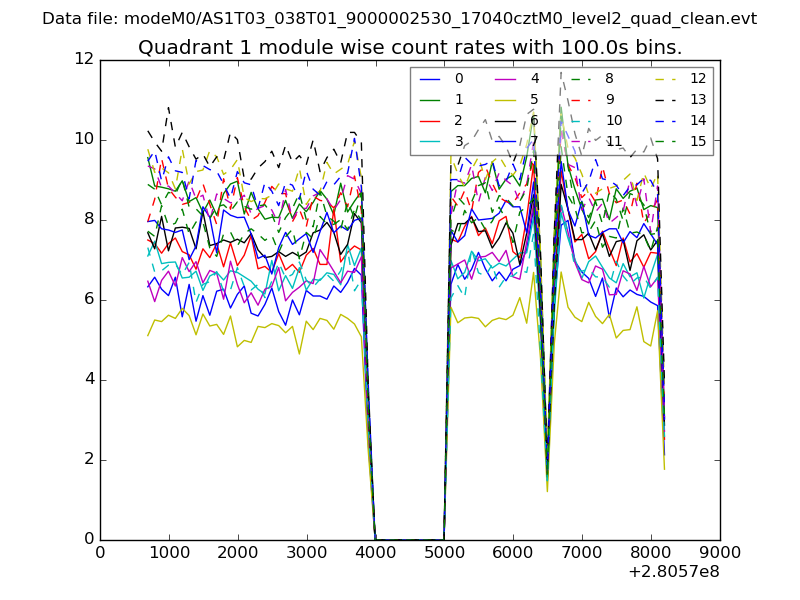
| Module-wise count rates for Quadrant A Data is divided into 100 sec bins |
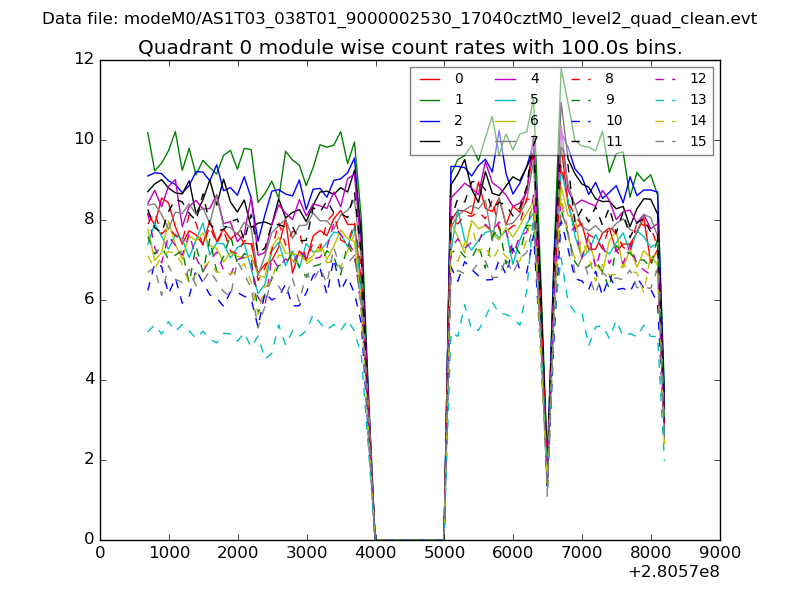 |
 |
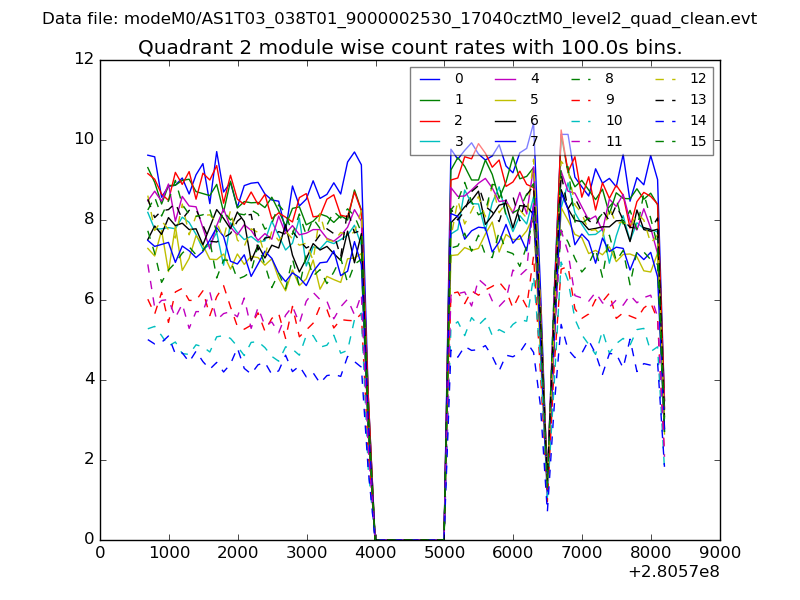
| Module-wise count rates for Quadrant B Data is divided into 100 sec bins |
 |
 |
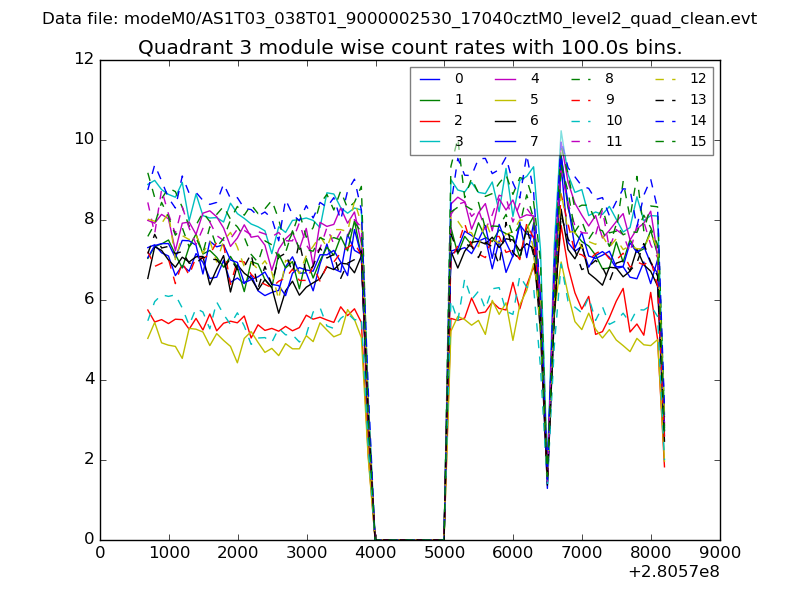
| Module-wise count rates for Quadrant C Data is divided into 100 sec bins |
 |
 |
| Module-wise count rates for Quadrant D Data is divided into 100 sec bins |
 |
 |
| Parameter | Plot |
|---|---|
| CZT HV Monitor | 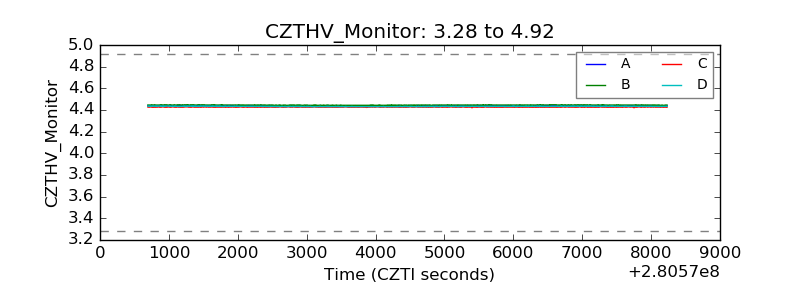 |
| D_VDD | 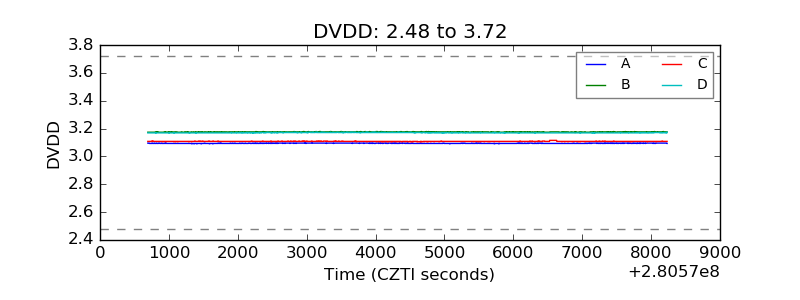 |
| Temperature 1 | 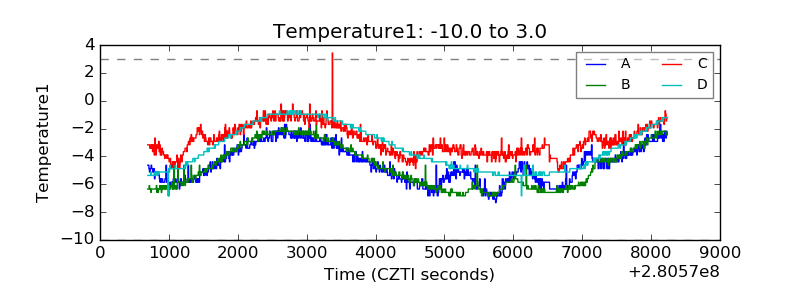 |
| Veto HV Monitor |  |
| Veto LLD | 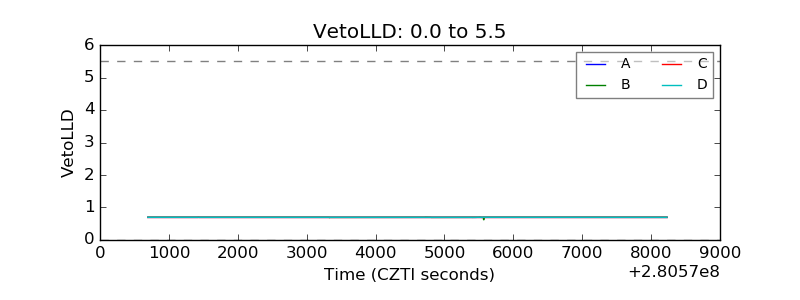 |
| Alpha Counter | 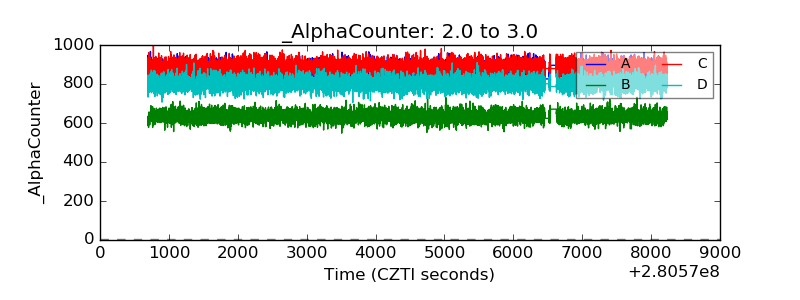 |
| _CPM_Rate | 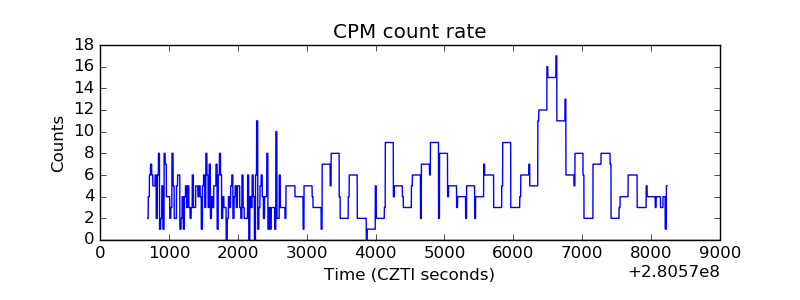 |
| CZT Counter | 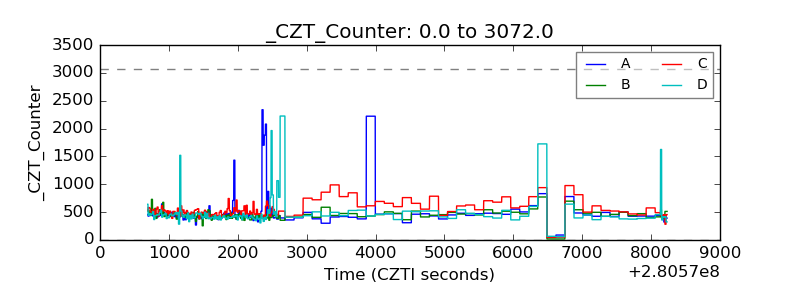 |
| +2.5 Volts monitor |  |
| +5 Volts monitor |  |
| _ROLL_ROT | 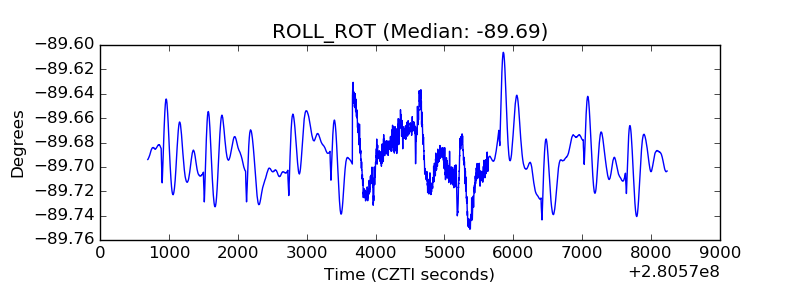 |
| _Roll_DEC |  |
| _Roll_RA | 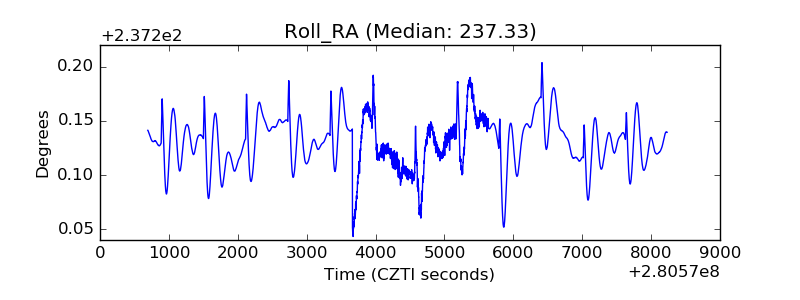 |
| Veto Counter | 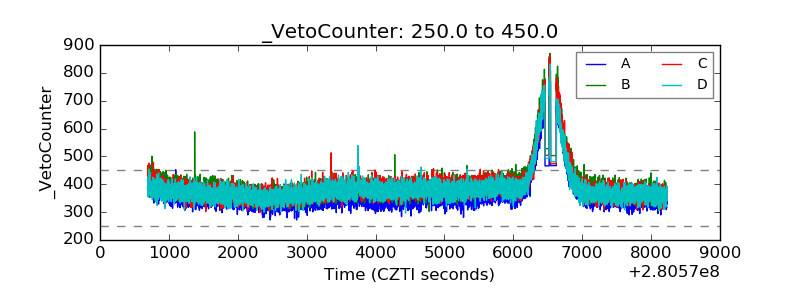 |