| Param | Original file | Final file |
|---|---|---|
| Filename | modeM0/AS1T03_038T01_9000002530_17041cztM0_level2.evt | modeM0/AS1T03_038T01_9000002530_17041cztM0_level2_quad_clean.evt |
| Size (bytes) | 593,867,520 | 115,842,240 |
| Size | 566.4 MB | 110.5 MB |
| Events in quadrant A | 3,968,546 | 761,469 |
| Events in quadrant B | 3,571,114 | 781,136 |
| Events in quadrant C | 5,739,566 | 724,672 |
| Events in quadrant D | 4,203,071 | 724,543 |
| Mode M9 | |||
|---|---|---|---|
| Quadrant | BADHDUFLAG | Total packets | Discarded packets |
| A | 0 | 1 | 0 |
| B | 0 | 1 | 0 |
| C | 0 | 1 | 0 |
| D | 0 | 1 | 0 |
| Mode M0 | |||
|---|---|---|---|
| Quadrant | BADHDUFLAG | Total packets | Discarded packets |
| A | 0 | 16859 | 2 |
| B | 0 | 15549 | 2 |
| C | 0 | 22286 | 2 |
| D | 0 | 17730 | 2 |
| Mode SS | |||
|---|---|---|---|
| Quadrant | BADHDUFLAG | Total packets | Discarded packets |
| A | 0 | 150 | 0 |
| B | 0 | 150 | 0 |
| C | 0 | 150 | 0 |
| D | 0 | 150 | 0 |
| Quadrant | Total seconds | Saturated seconds | Saturation percentage |
|---|---|---|---|
| A | 7421 | 182 | 2.452500% |
| B | 7422 | 109 | 1.468607% |
| C | 7422 | 320 | 4.311506% |
| D | 7422 | 384 | 5.173808% |
Noise dominated data is calculated using 1-second bins in cleaned event files. If a bin has >2000 counts, and if more than 50% of those come from <1% of pixels, then it is considered to be noise-dominated and hence unusable.
| Quadrant | # 1 sec bins | Bins with >0 counts | Bins with >2000 counts | High rate bins dominated by noise | Noise dominated (total time) | Noise dominated (detector-on time) | Marked lightcurve |
|---|---|---|---|---|---|---|---|
| A | 7482 | 7424 | 68 | 68 | 0.91% | 0.92% | 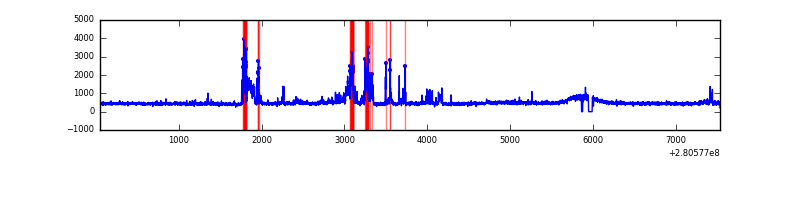 |
| B | 7483 | 7425 | 2 | 2 | 0.03% | 0.03% | 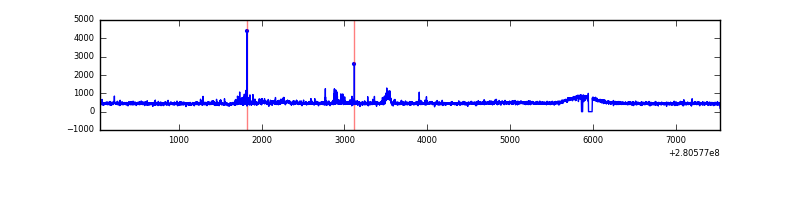 |
| C | 7483 | 7425 | 2 | 2 | 0.03% | 0.03% | 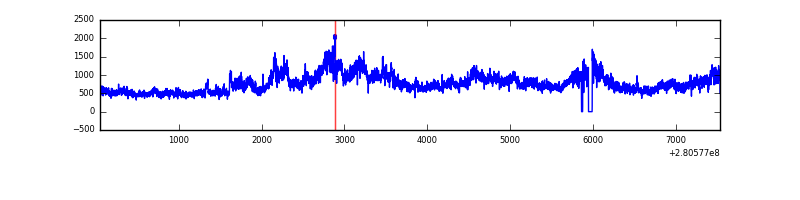 |
| D | 7483 | 7425 | 208 | 208 | 2.78% | 2.80% | 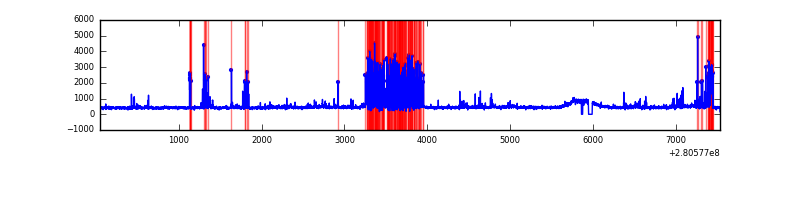 |
Top three noisy pixels from each quadrant. If the there are fewer than three noisy pixels in the level2.evt file, extra rows are filled as -1
| Pixel properties | Quadrant properties | ||||||
|---|---|---|---|---|---|---|---|
| Quadrant | DetID | PixID | Counts | Sigma | Mean | Median | Sigma |
| A | 15 | 174 | 620349 | 3524.64 | 866 | 847 | 175.8 |
| A | 12 | 189 | 14498 | 77.67 | 866 | 847 | 175.8 |
| A | 0 | 226 | 7543 | 38.1 | 866 | 847 | 175.8 |
| B | 0 | 189 | 46951 | 275.22 | 866 | 842 | 167.5 |
| B | 0 | 197 | 32166 | 186.97 | 866 | 842 | 167.5 |
| B | 6 | 36 | 30898 | 179.4 | 866 | 842 | 167.5 |
| C | 3 | 233 | 2419358 | 12606.41 | 818 | 820 | 191.8 |
| C | 14 | 238 | 125547 | 650.13 | 818 | 820 | 191.8 |
| C | 13 | 61 | 5888 | 26.42 | 818 | 820 | 191.8 |
| D | 1 | 52 | 836034 | 4181.52 | 828 | 801 | 199.7 |
| D | 10 | 70 | 180722 | 900.76 | 828 | 801 | 199.7 |
| D | 2 | 234 | 29736 | 144.86 | 828 | 801 | 199.7 |
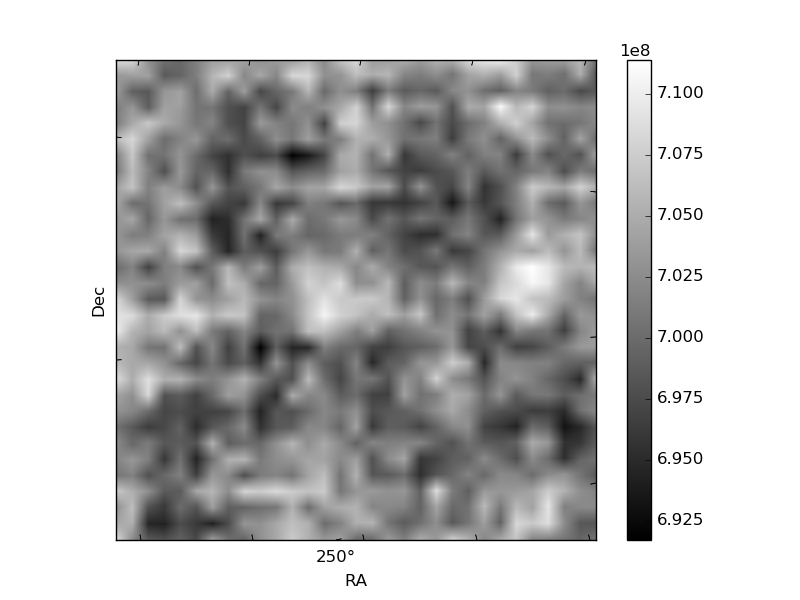
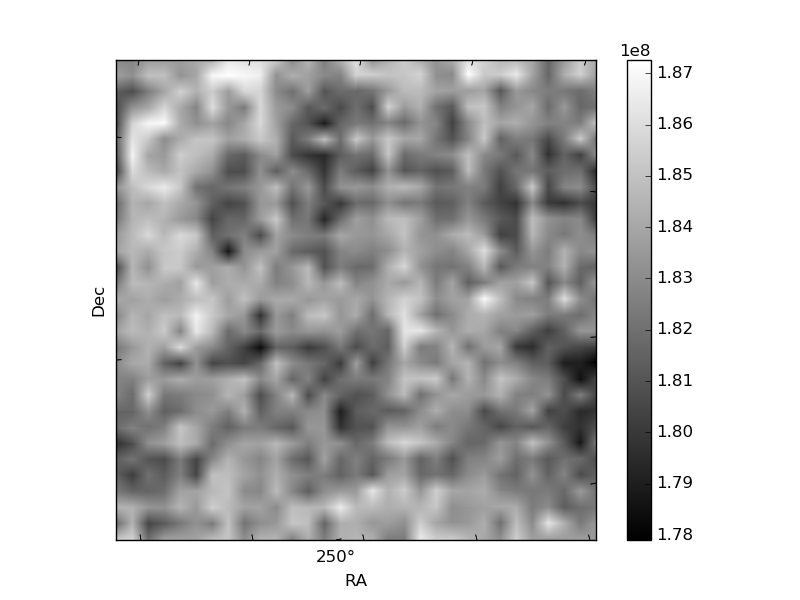
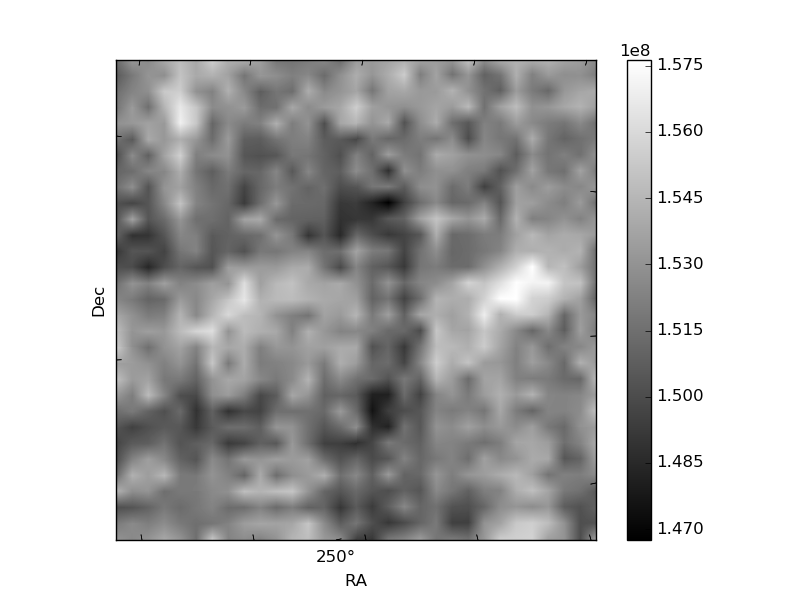
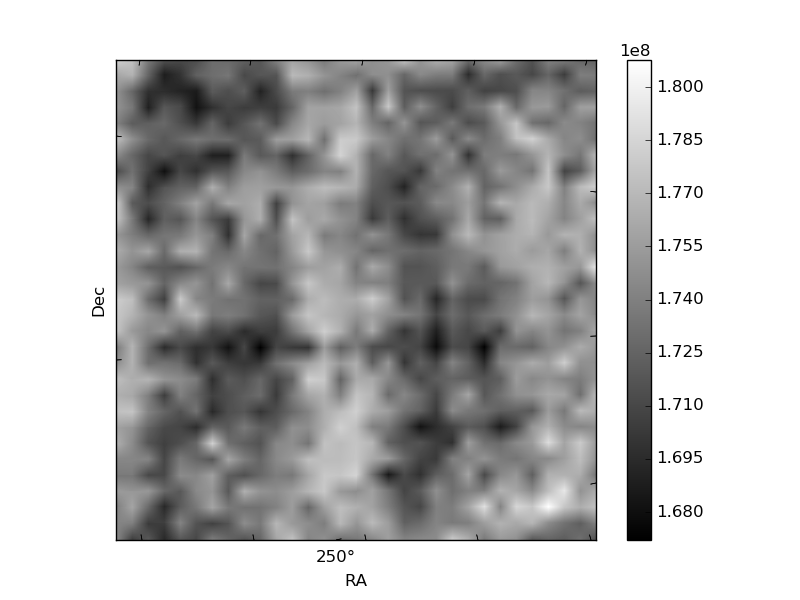
Histogram calculated using DETX and DETY for each event in the final _common_clean file
| Quadrant A | 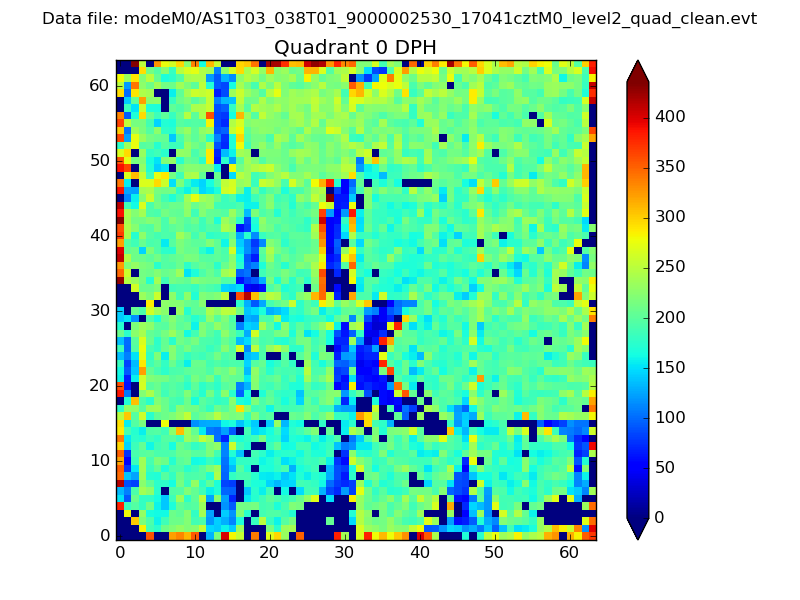 |
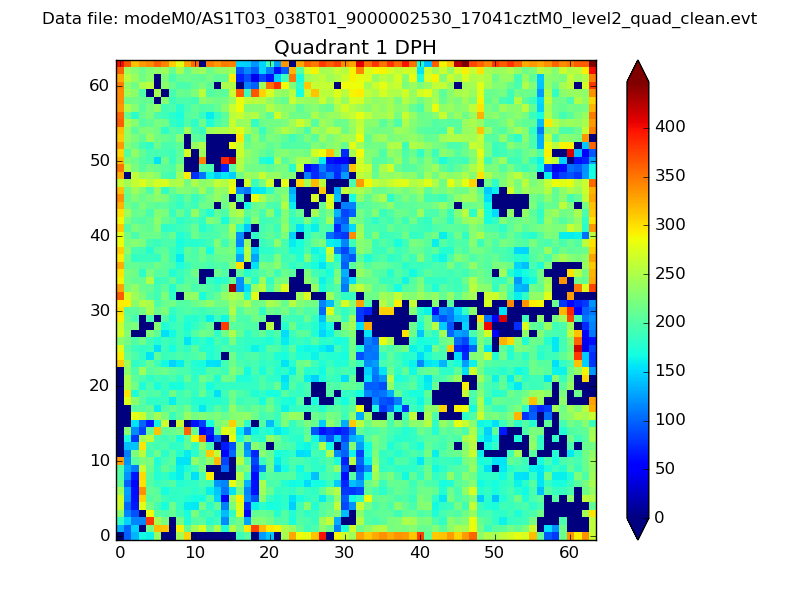 |
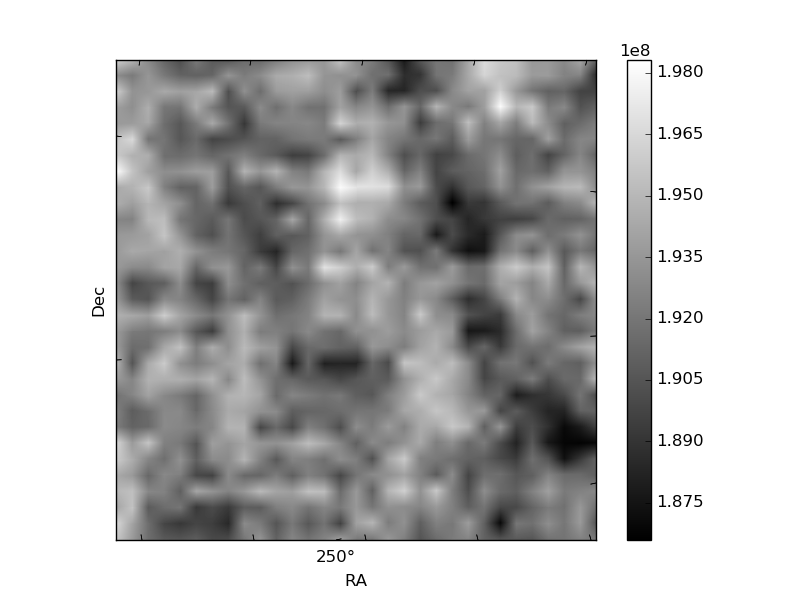
Quadrant B |
|---|---|---|---|
| Quadrant D | 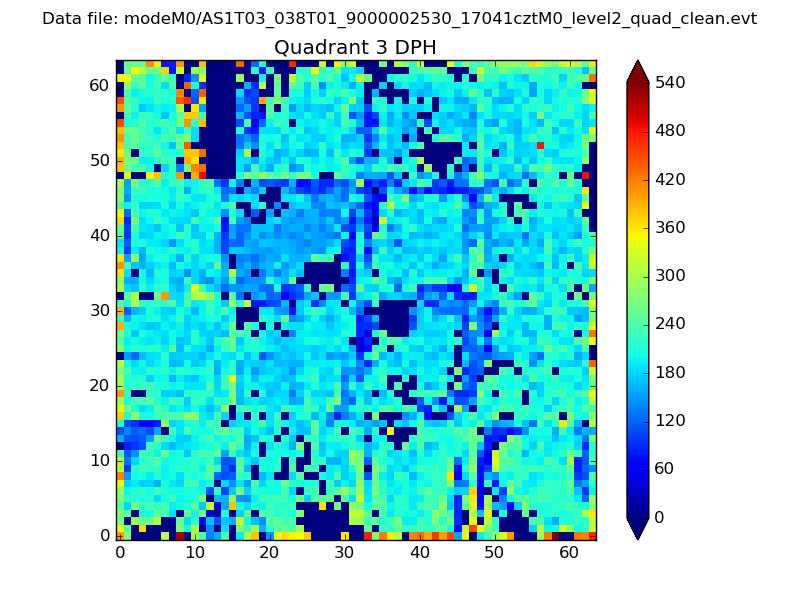 |
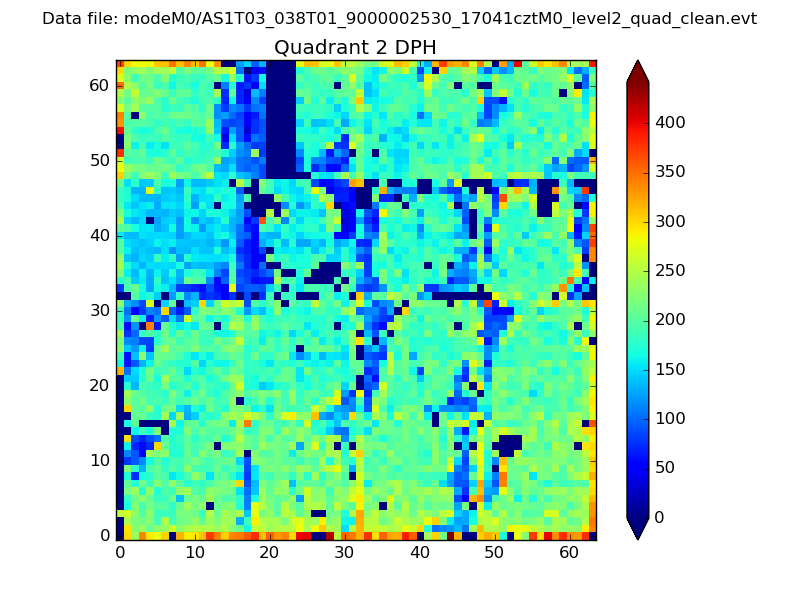 |
Quadrant C |
| Plot type | Count rate plots | Images |
|---|---|---|
| Comparison with Poisson distribution Blue bars denote a histogram of data divided into 1 sec bins. Red curve is a Poisson curve with rate = median count rate of data. |
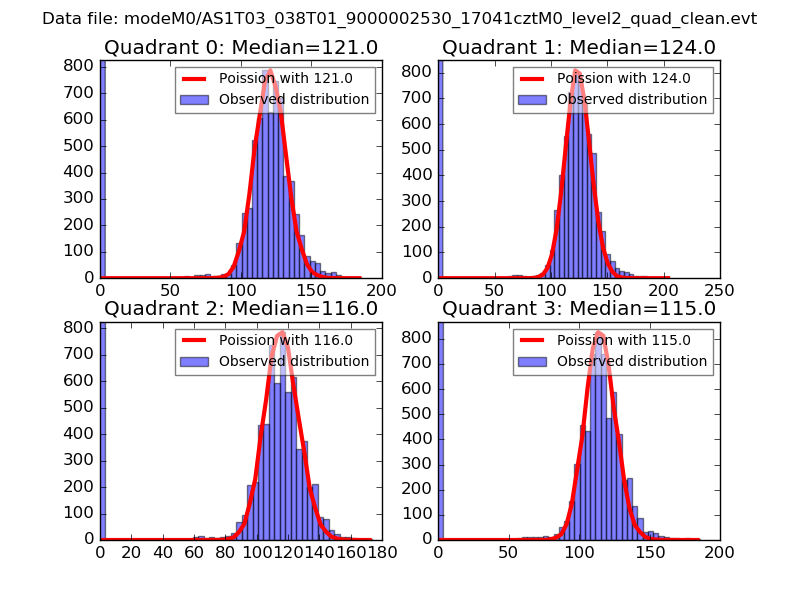 |
 |
| Quadrant-wise count rates Data is divided into 100 sec bins |
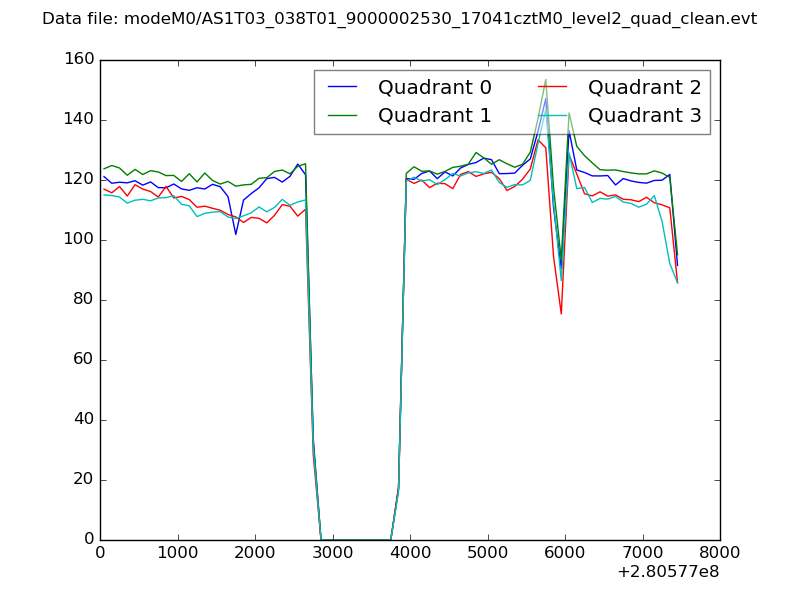 |
|
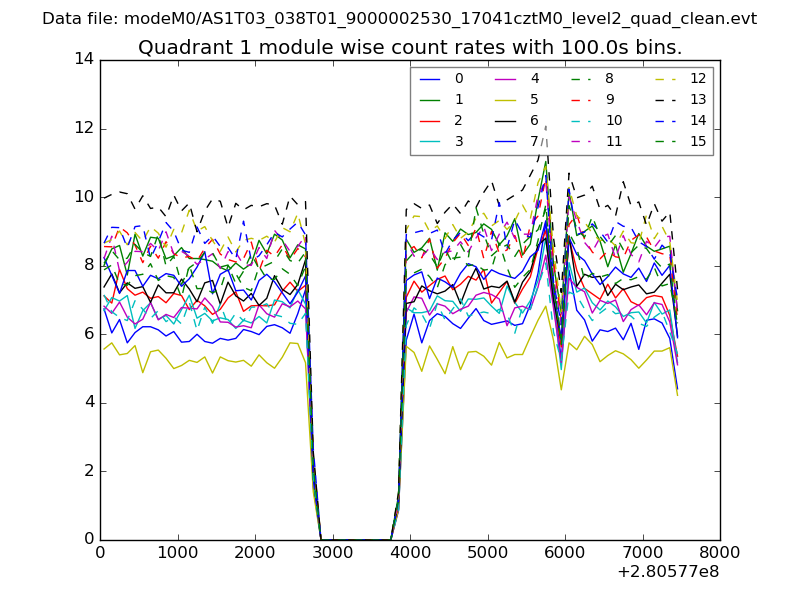
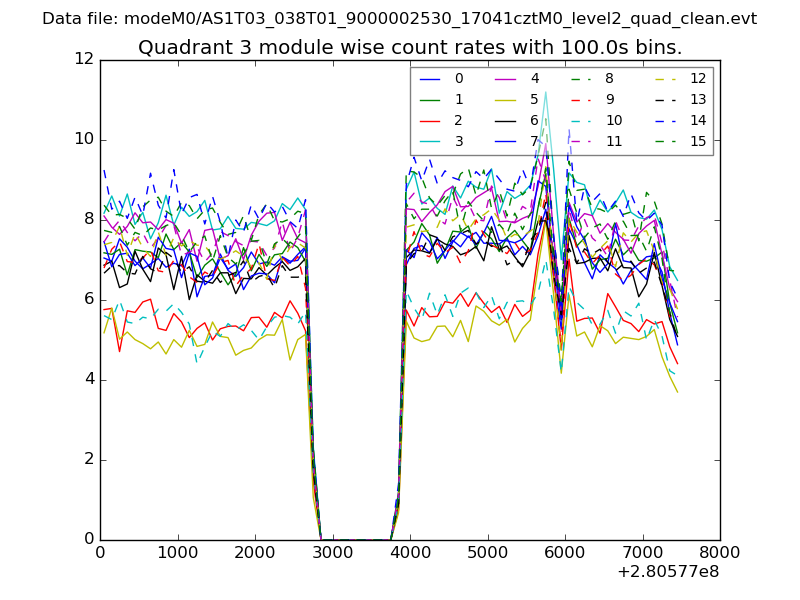
| Module-wise count rates for Quadrant A Data is divided into 100 sec bins |
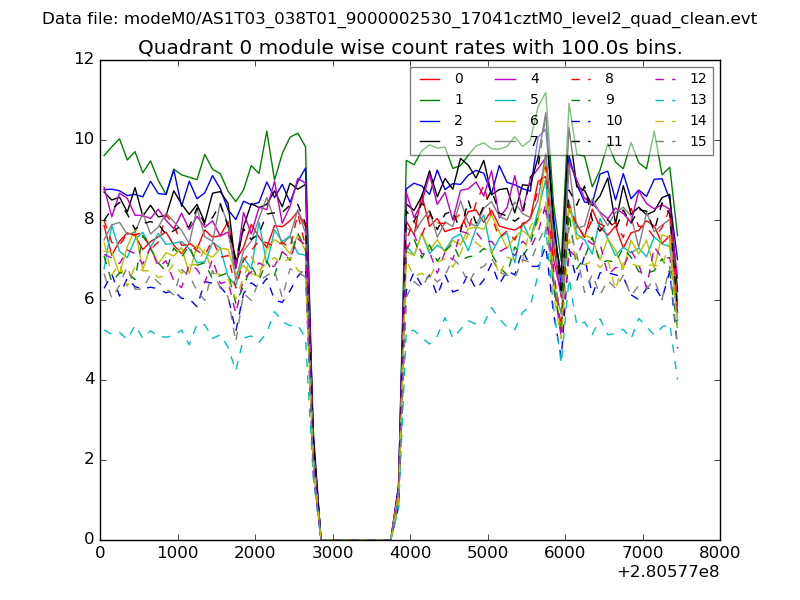 |
 |
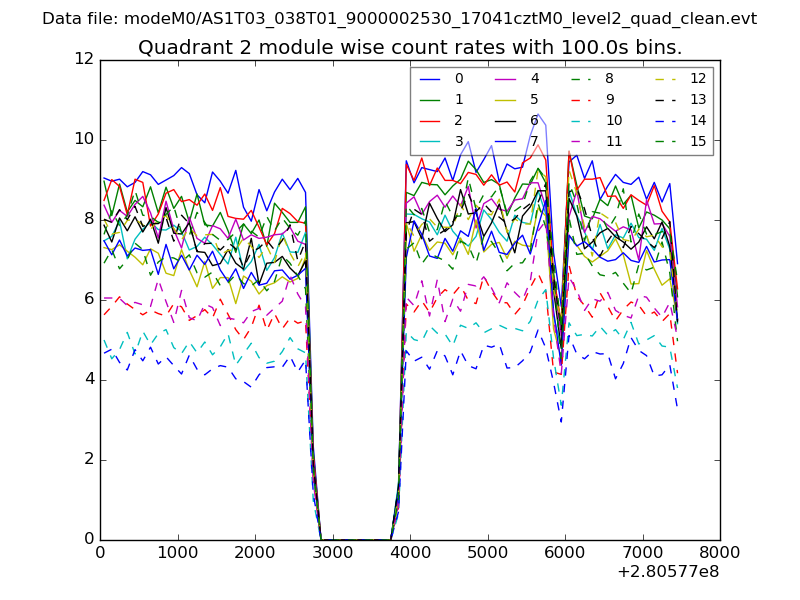
| Module-wise count rates for Quadrant B Data is divided into 100 sec bins |
 |
 |
| Module-wise count rates for Quadrant C Data is divided into 100 sec bins |
 |
 |
| Module-wise count rates for Quadrant D Data is divided into 100 sec bins |
 |
 |
| Parameter | Plot |
|---|---|
| CZT HV Monitor | 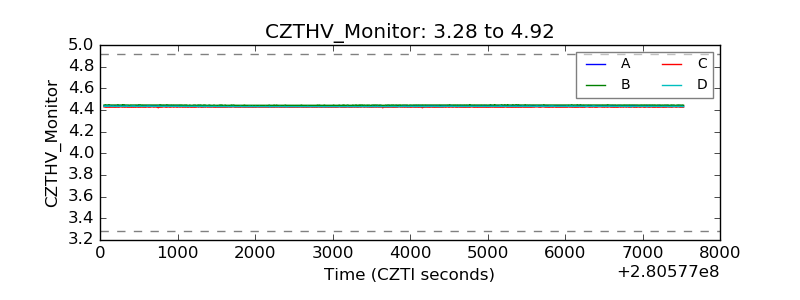 |
| D_VDD | 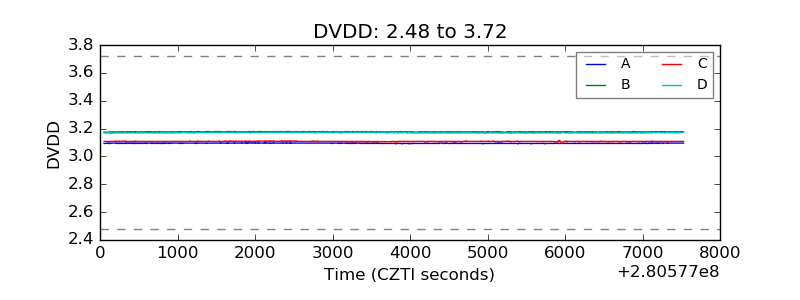 |
| Temperature 1 | 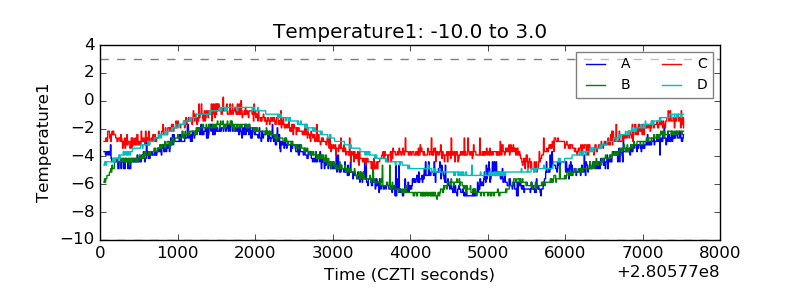 |
| Veto HV Monitor |  |
| Veto LLD | 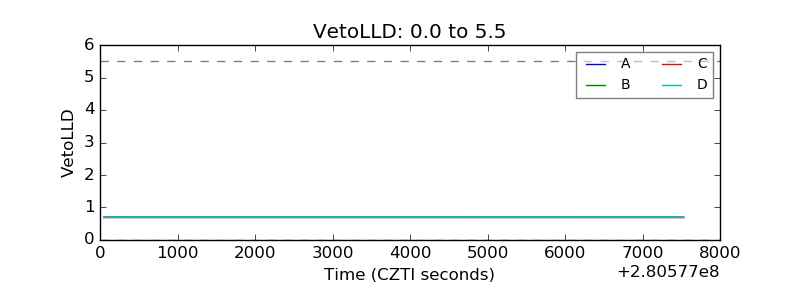 |
| Alpha Counter | 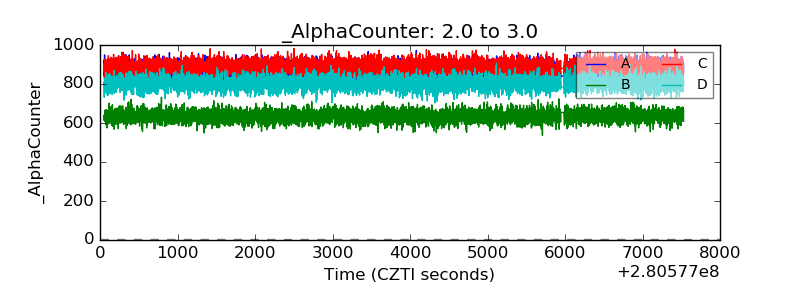 |
| _CPM_Rate |  |
| CZT Counter | 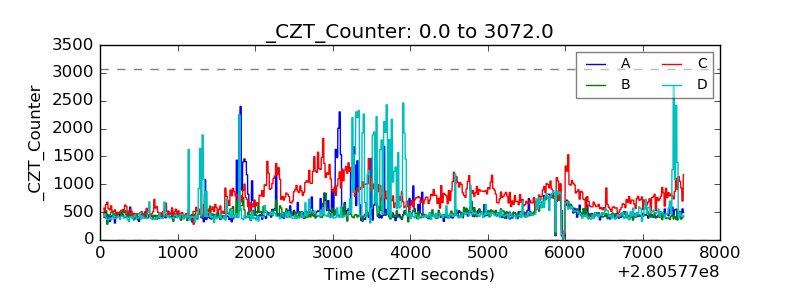 |
| +2.5 Volts monitor |  |
| +5 Volts monitor |  |
| _ROLL_ROT | 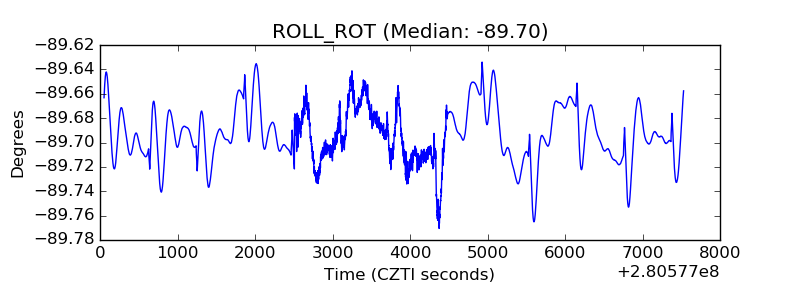 |
| _Roll_DEC | 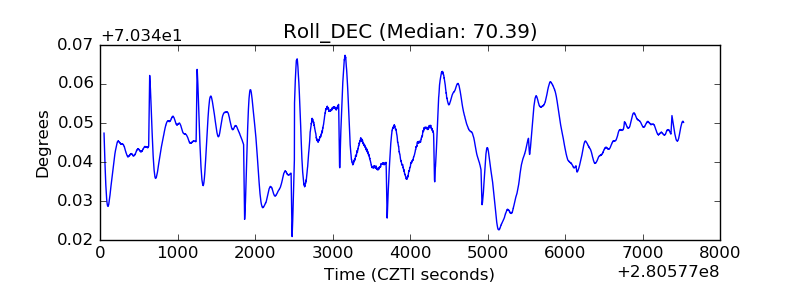 |
| _Roll_RA | 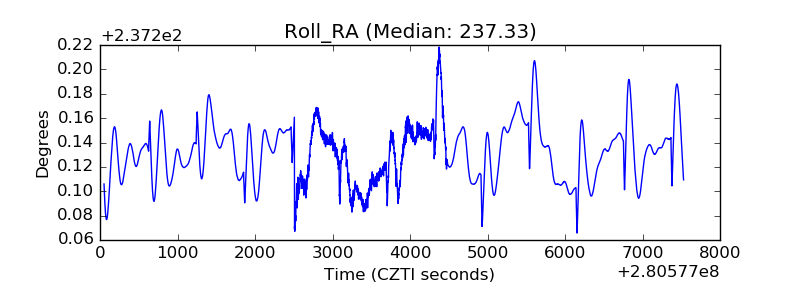 |
| Veto Counter | 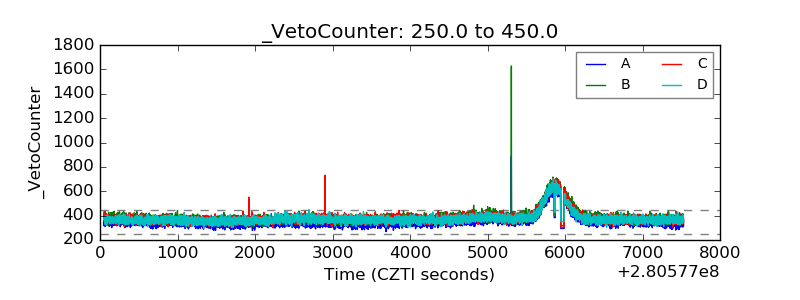 |