| Param | Original file | Final file |
|---|---|---|
| Filename | modeM0/AS1T03_038T01_9000002530_17042cztM0_level2.evt | modeM0/AS1T03_038T01_9000002530_17042cztM0_level2_quad_clean.evt |
| Size (bytes) | 592,747,200 | 112,708,800 |
| Size | 565.3 MB | 107.5 MB |
| Events in quadrant A | 3,635,874 | 748,131 |
| Events in quadrant B | 3,398,301 | 761,929 |
| Events in quadrant C | 5,718,396 | 707,355 |
| Events in quadrant D | 4,702,436 | 685,913 |
| Mode M9 | |||
|---|---|---|---|
| Quadrant | BADHDUFLAG | Total packets | Discarded packets |
| A | 0 | 3 | 0 |
| B | 0 | 3 | 0 |
| C | 0 | 3 | 0 |
| D | 0 | 3 | 0 |
| Mode M0 | |||
|---|---|---|---|
| Quadrant | BADHDUFLAG | Total packets | Discarded packets |
| A | 0 | 15793 | 1 |
| B | 0 | 15010 | 1 |
| C | 0 | 22330 | 1 |
| D | 0 | 18959 | 1 |
| Mode SS | |||
|---|---|---|---|
| Quadrant | BADHDUFLAG | Total packets | Discarded packets |
| A | 0 | 150 | 0 |
| B | 0 | 150 | 0 |
| C | 0 | 150 | 0 |
| D | 0 | 150 | 0 |
| Quadrant | Total seconds | Saturated seconds | Saturation percentage |
|---|---|---|---|
| A | 7321 | 69 | 0.942494% |
| B | 7322 | 32 | 0.437039% |
| C | 7322 | 128 | 1.748156% |
| D | 7322 | 388 | 5.299099% |
Noise dominated data is calculated using 1-second bins in cleaned event files. If a bin has >2000 counts, and if more than 50% of those come from <1% of pixels, then it is considered to be noise-dominated and hence unusable.
| Quadrant | # 1 sec bins | Bins with >0 counts | Bins with >2000 counts | High rate bins dominated by noise | Noise dominated (total time) | Noise dominated (detector-on time) | Marked lightcurve |
|---|---|---|---|---|---|---|---|
| A | 7672 | 7323 | 30 | 30 | 0.39% | 0.41% | 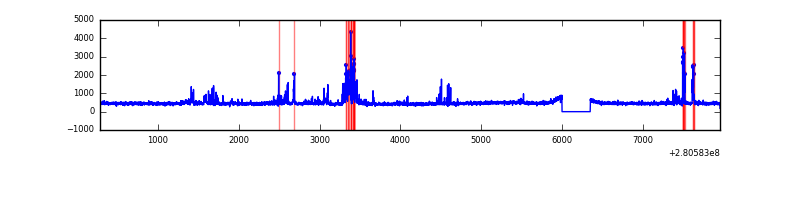 |
| B | 7673 | 7324 | 2 | 2 | 0.03% | 0.03% | 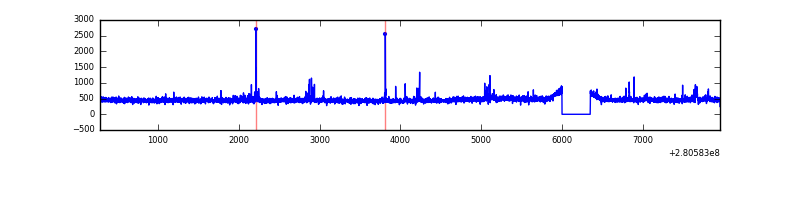 |
| C | 7673 | 7324 | 0 | 0 | 0.00% | 0.00% | 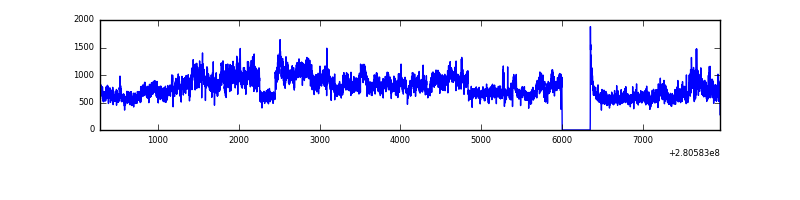 |
| D | 7673 | 7324 | 285 | 285 | 3.71% | 3.89% | 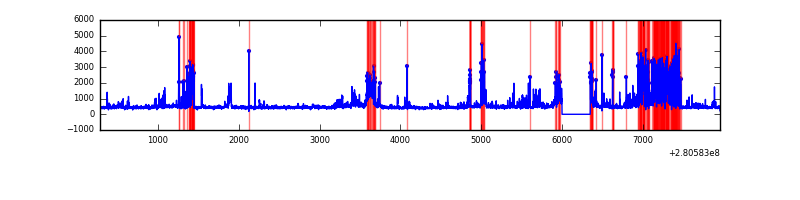 |
Top three noisy pixels from each quadrant. If the there are fewer than three noisy pixels in the level2.evt file, extra rows are filled as -1
| Pixel properties | Quadrant properties | ||||||
|---|---|---|---|---|---|---|---|
| Quadrant | DetID | PixID | Counts | Sigma | Mean | Median | Sigma |
| A | 15 | 174 | 295898 | 1720.65 | 842 | 821 | 171.5 |
| A | 0 | 254 | 67093 | 386.44 | 842 | 821 | 171.5 |
| A | 4 | 2 | 30353 | 172.21 | 842 | 821 | 171.5 |
| B | 4 | 216 | 31718 | 189.65 | 842 | 819 | 162.9 |
| B | 0 | 229 | 21835 | 128.99 | 842 | 819 | 162.9 |
| B | 12 | 111 | 19345 | 113.71 | 842 | 819 | 162.9 |
| C | 3 | 233 | 2463518 | 13181.78 | 799 | 801 | 186.8 |
| C | 14 | 238 | 123318 | 655.78 | 799 | 801 | 186.8 |
| C | 7 | 247 | 10111 | 49.83 | 799 | 801 | 186.8 |
| D | 1 | 52 | 1021915 | 5250.36 | 799 | 775 | 194.5 |
| D | 5 | 222 | 377316 | 1936.05 | 799 | 775 | 194.5 |
| D | 10 | 70 | 211225 | 1082.06 | 799 | 775 | 194.5 |
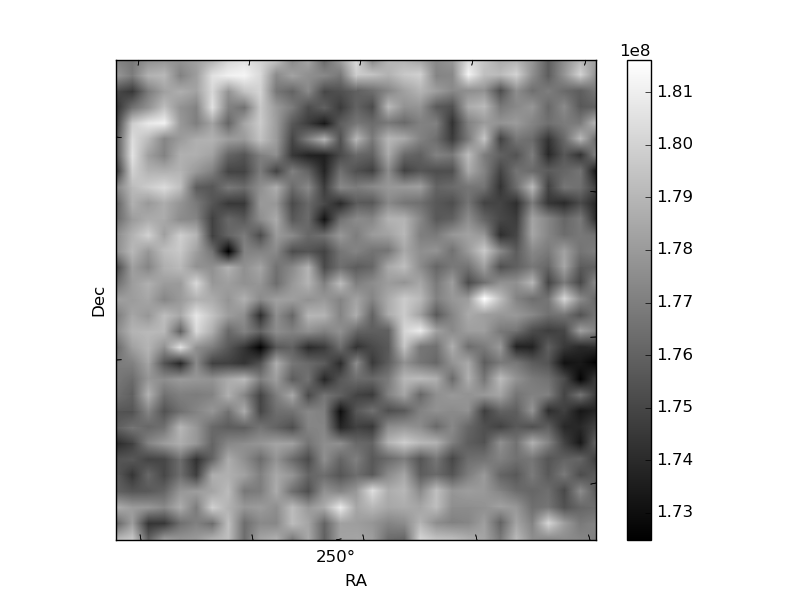
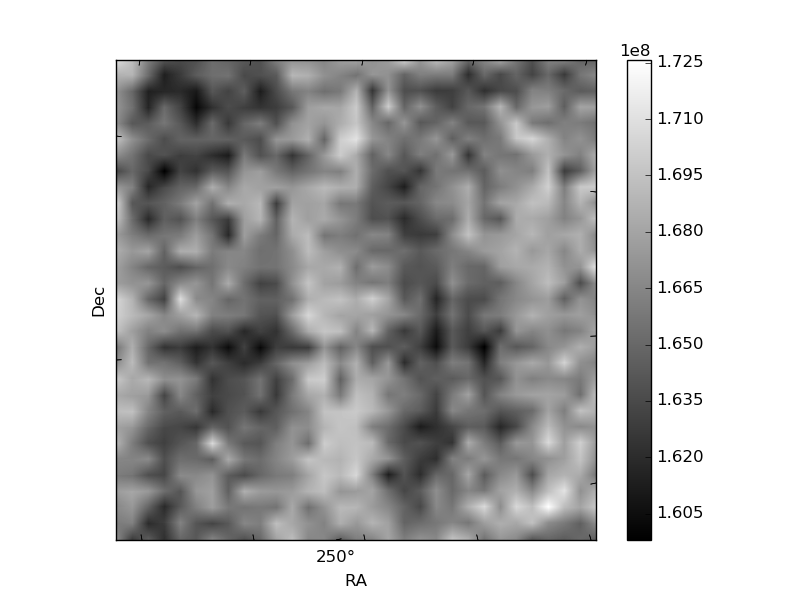
Histogram calculated using DETX and DETY for each event in the final _common_clean file
| Quadrant A | 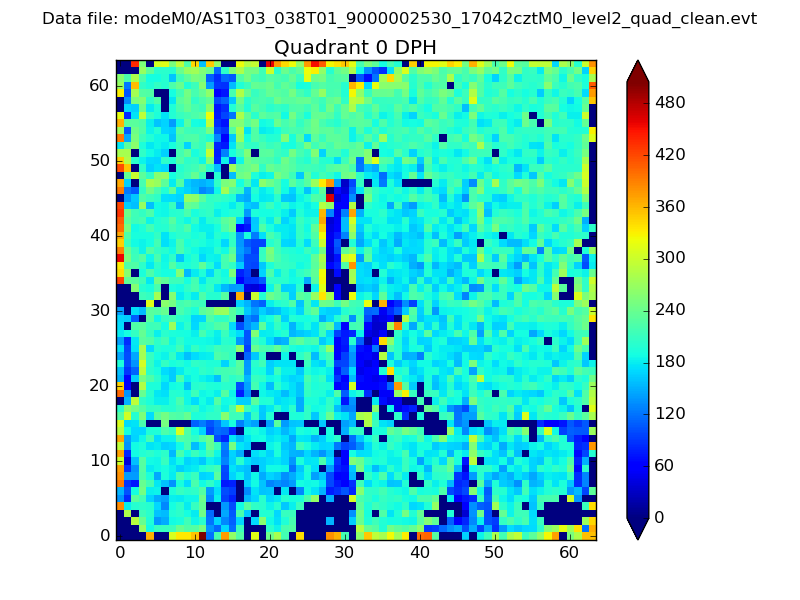 |
 |
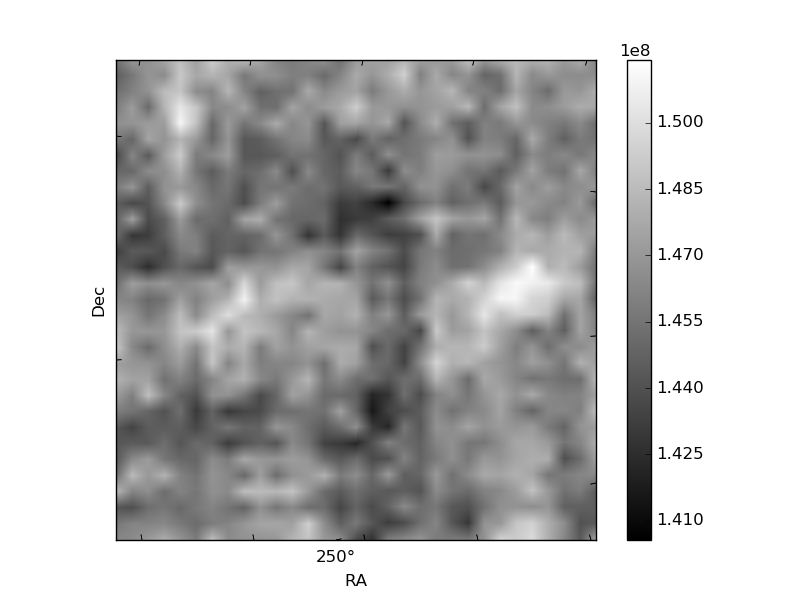
Quadrant B |
|---|---|---|---|
| Quadrant D | 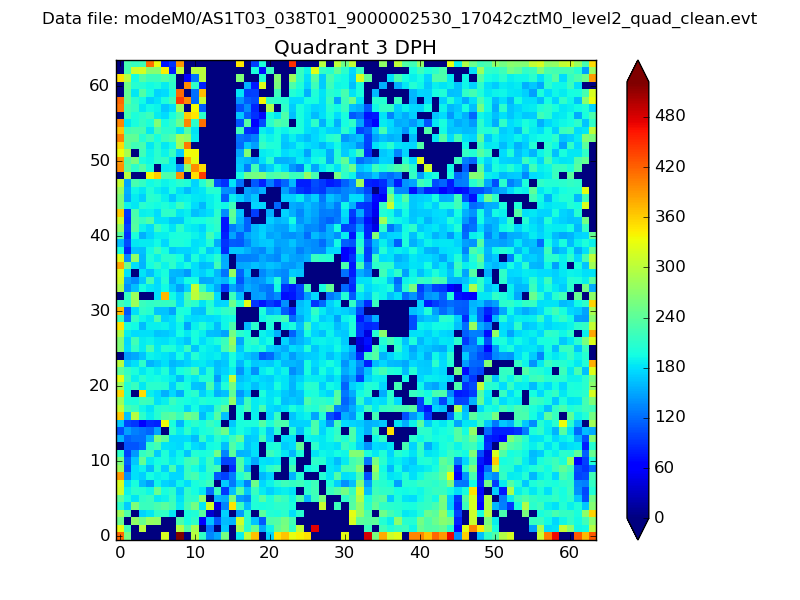 |
 |
Quadrant C |
| Plot type | Count rate plots | Images |
|---|---|---|
| Comparison with Poisson distribution Blue bars denote a histogram of data divided into 1 sec bins. Red curve is a Poisson curve with rate = median count rate of data. |
 |
 |
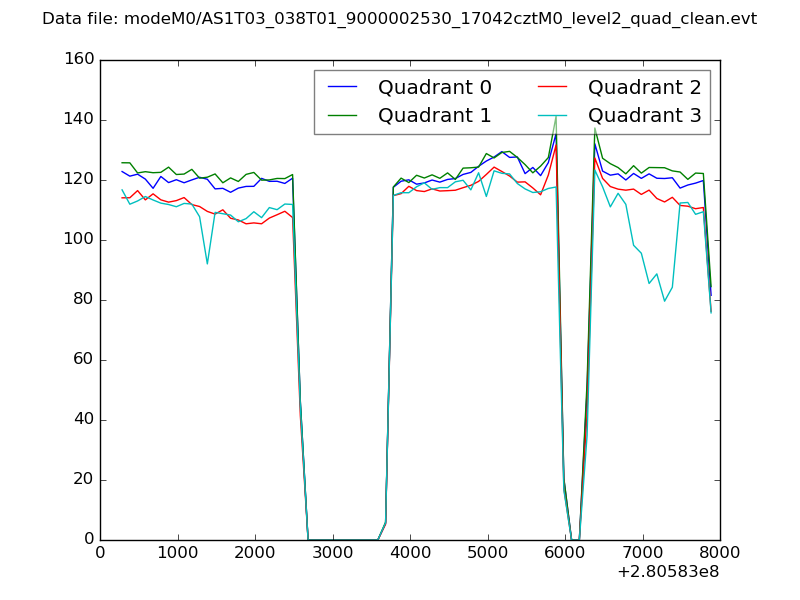
| Quadrant-wise count rates Data is divided into 100 sec bins |
 |
|
| Module-wise count rates for Quadrant A Data is divided into 100 sec bins |
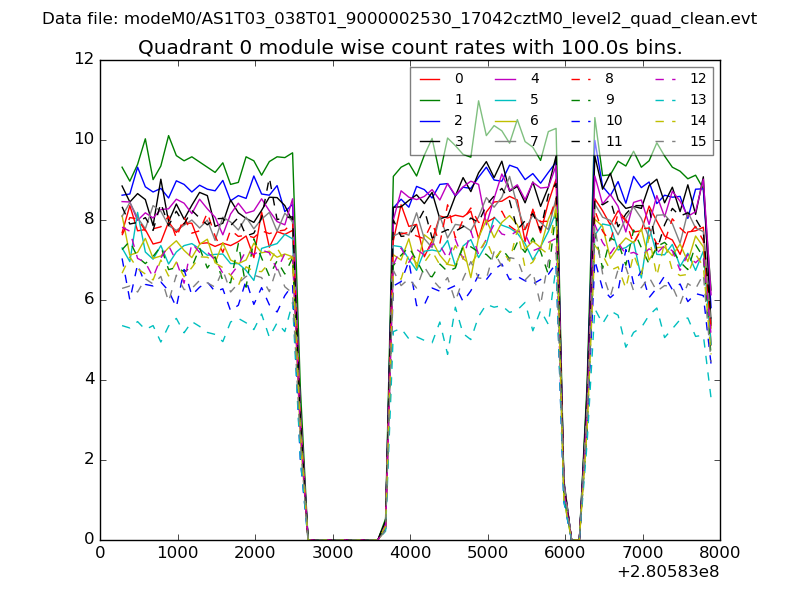 |
 |
| Module-wise count rates for Quadrant B Data is divided into 100 sec bins |
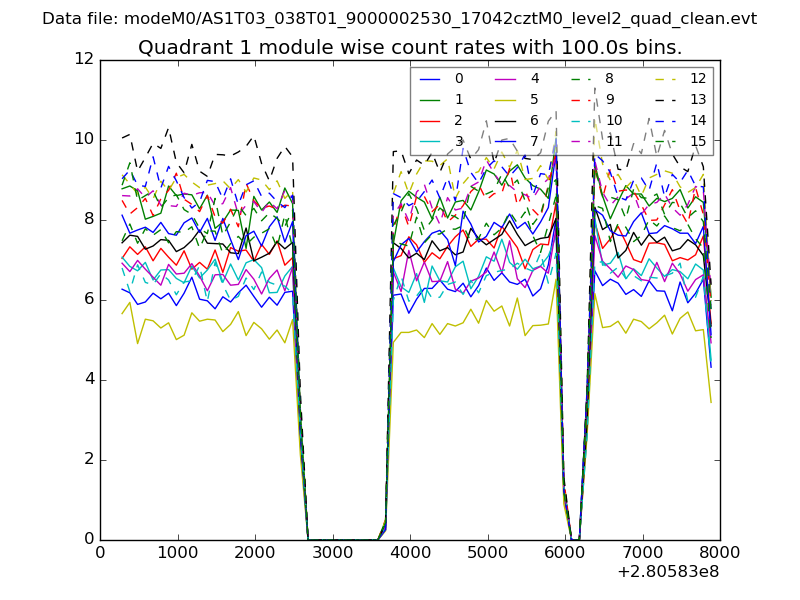 |
 |
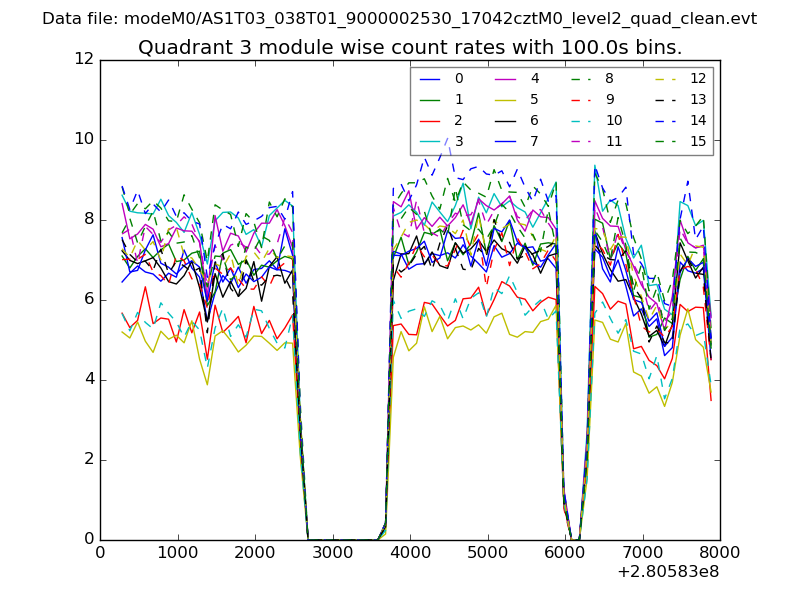
| Module-wise count rates for Quadrant C Data is divided into 100 sec bins |
 |
 |
| Module-wise count rates for Quadrant D Data is divided into 100 sec bins |
 |
 |
| Parameter | Plot |
|---|---|
| CZT HV Monitor | 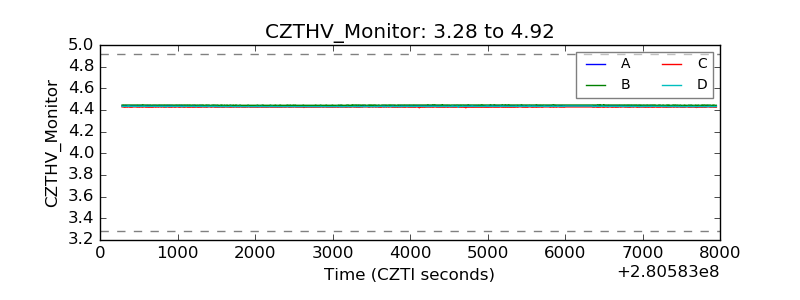 |
| D_VDD | 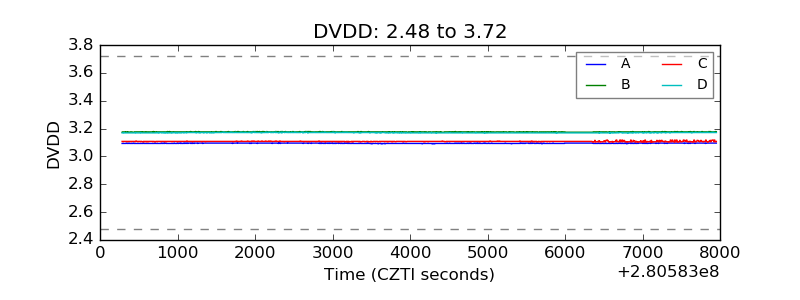 |
| Temperature 1 | 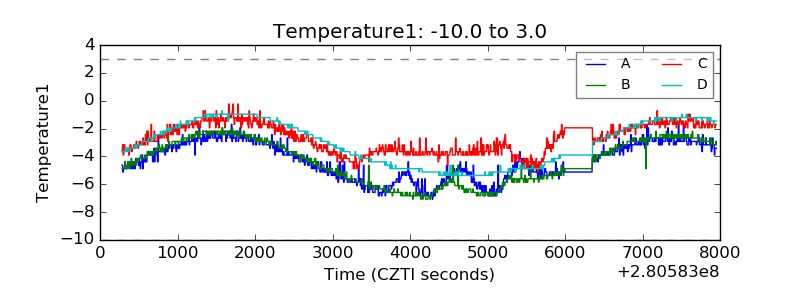 |
| Veto HV Monitor | 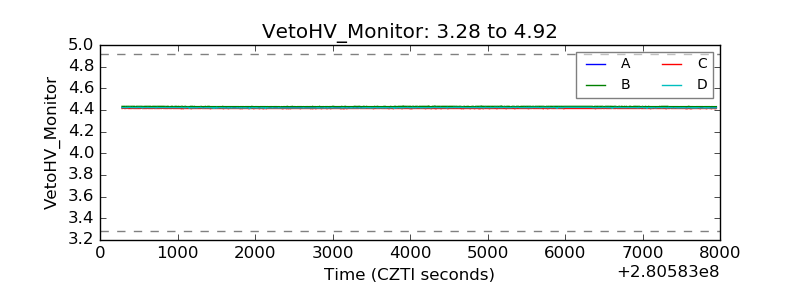 |
| Veto LLD | 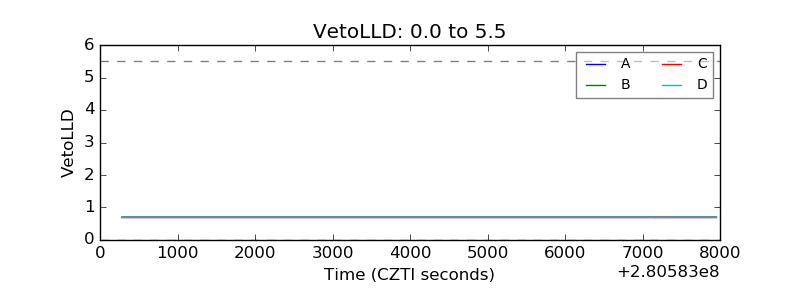 |
| Alpha Counter |  |
| _CPM_Rate | 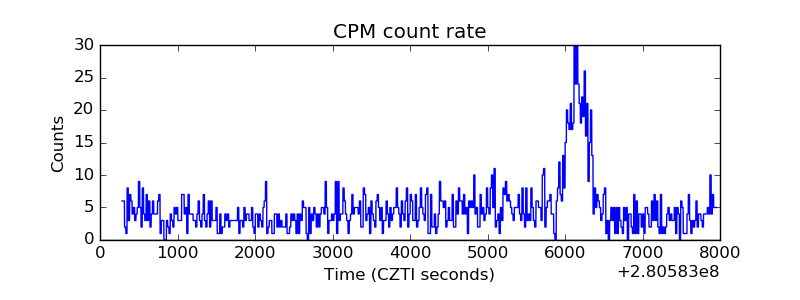 |
| CZT Counter |  |
| +2.5 Volts monitor |  |
| +5 Volts monitor |  |
| _ROLL_ROT | 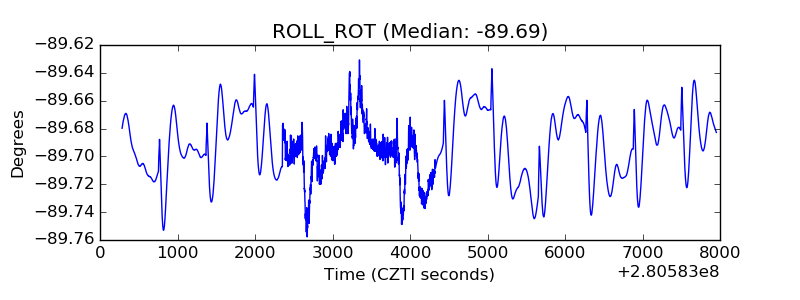 |
| _Roll_DEC | 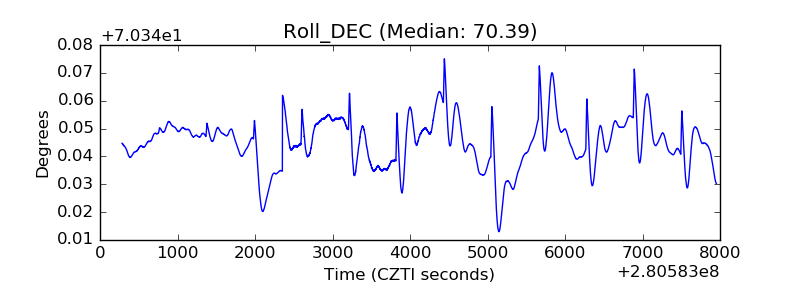 |
| _Roll_RA | 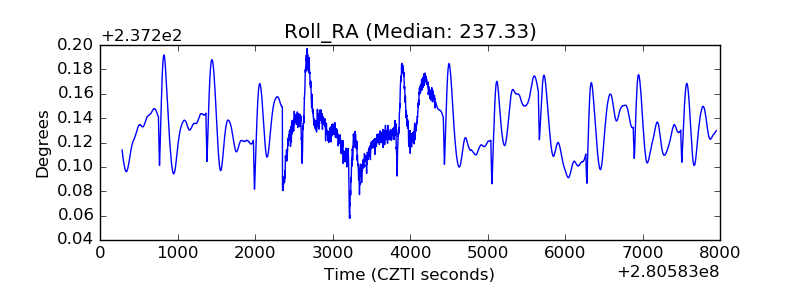 |
| Veto Counter | 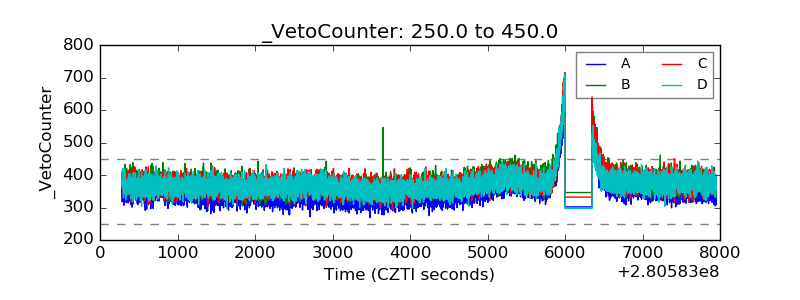 |