| Param | Original file | Final file |
|---|---|---|
| Filename | modeM0/AS1T03_004T01_9000002532_17048cztM0_level2.evt | modeM0/AS1T03_004T01_9000002532_17048cztM0_level2_quad_clean.evt |
| Size (bytes) | 283,982,400 | 53,968,320 |
| Size | 270.8 MB | 51.5 MB |
| Events in quadrant A | 1,712,766 | 352,526 |
| Events in quadrant B | 1,815,007 | 364,899 |
| Events in quadrant C | 2,853,213 | 342,756 |
| Events in quadrant D | 1,984,337 | 329,777 |
| Mode SS | |||
|---|---|---|---|
| Quadrant | BADHDUFLAG | Total packets | Discarded packets |
| A | 0 | 70 | 0 |
| B | 0 | 70 | 0 |
| C | 0 | 70 | 0 |
| D | 0 | 70 | 0 |
| Mode M9 | |||
|---|---|---|---|
| Quadrant | BADHDUFLAG | Total packets | Discarded packets |
| A | 0 | 12 | 0 |
| B | 0 | 12 | 0 |
| C | 0 | 12 | 0 |
| D | 0 | 12 | 0 |
| Mode M0 | |||
|---|---|---|---|
| Quadrant | BADHDUFLAG | Total packets | Discarded packets |
| A | 0 | 7167 | 1 |
| B | 0 | 7456 | 1 |
| C | 0 | 10858 | 1 |
| D | 0 | 8126 | 1 |
| Quadrant | Total seconds | Saturated seconds | Saturation percentage |
|---|---|---|---|
| A | 3445 | 22 | 0.638607% |
| B | 3445 | 34 | 0.986938% |
| C | 3445 | 185 | 5.370102% |
| D | 3445 | 104 | 3.018868% |
Noise dominated data is calculated using 1-second bins in cleaned event files. If a bin has >2000 counts, and if more than 50% of those come from <1% of pixels, then it is considered to be noise-dominated and hence unusable.
| Quadrant | # 1 sec bins | Bins with >0 counts | Bins with >2000 counts | High rate bins dominated by noise | Noise dominated (total time) | Noise dominated (detector-on time) | Marked lightcurve |
|---|---|---|---|---|---|---|---|
| A | 4621 | 3447 | 0 | 0 | 0.00% | 0.00% | 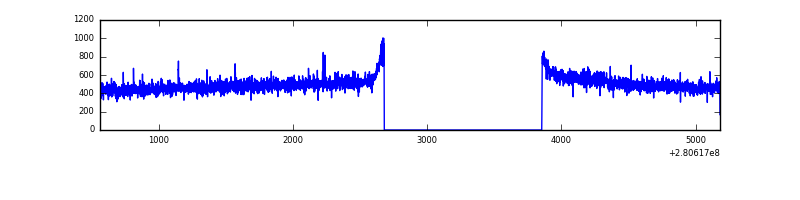 |
| B | 4621 | 3447 | 4 | 4 | 0.09% | 0.12% | 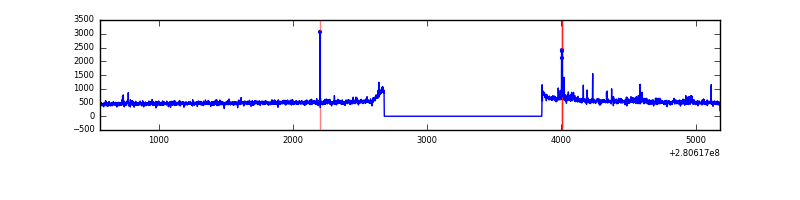 |
| C | 4621 | 3446 | 31 | 31 | 0.67% | 0.90% | 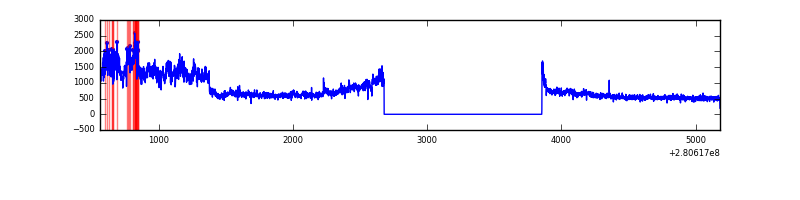 |
| D | 4621 | 3447 | 52 | 52 | 1.13% | 1.51% | 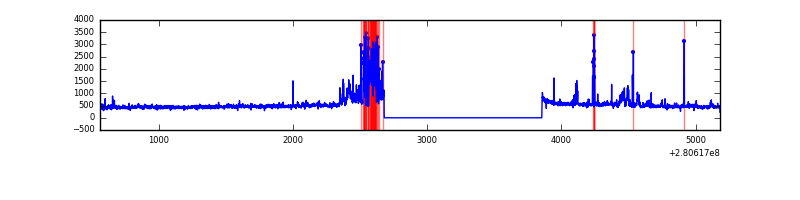 |
Top three noisy pixels from each quadrant. If the there are fewer than three noisy pixels in the level2.evt file, extra rows are filled as -1
| Pixel properties | Quadrant properties | ||||||
|---|---|---|---|---|---|---|---|
| Quadrant | DetID | PixID | Counts | Sigma | Mean | Median | Sigma |
| A | 0 | 226 | 3944 | 38.36 | 444 | 434 | 91.5 |
| A | 3 | 137 | 3217 | 30.41 | 444 | 434 | 91.5 |
| A | 12 | 194 | 3121 | 29.36 | 444 | 434 | 91.5 |
| B | 0 | 197 | 23268 | 264.22 | 447 | 437 | 86.4 |
| B | 0 | 219 | 14374 | 161.29 | 447 | 437 | 86.4 |
| B | 12 | 111 | 10061 | 111.38 | 447 | 437 | 86.4 |
| C | 3 | 233 | 1130769 | 11373.64 | 423 | 426 | 99.4 |
| C | 14 | 238 | 64828 | 648.02 | 423 | 426 | 99.4 |
| C | 7 | 247 | 6936 | 65.5 | 423 | 426 | 99.4 |
| D | 10 | 70 | 182057 | 1720.43 | 428 | 415 | 105.6 |
| D | 5 | 222 | 114897 | 1084.32 | 428 | 415 | 105.6 |
| D | 1 | 52 | 70319 | 662.1 | 428 | 415 | 105.6 |
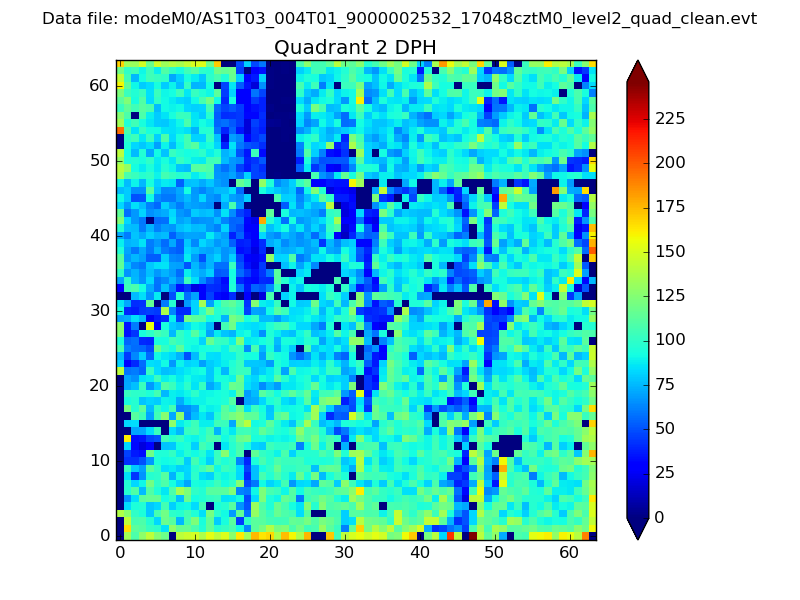
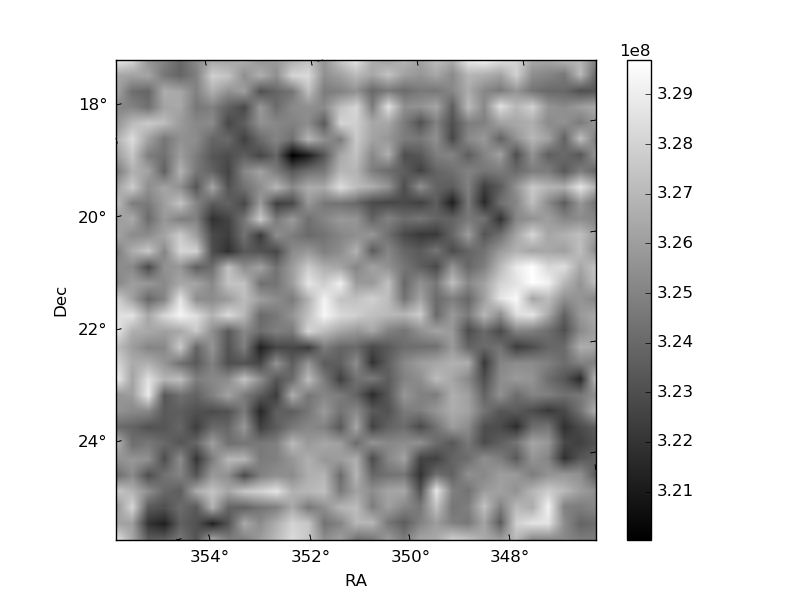
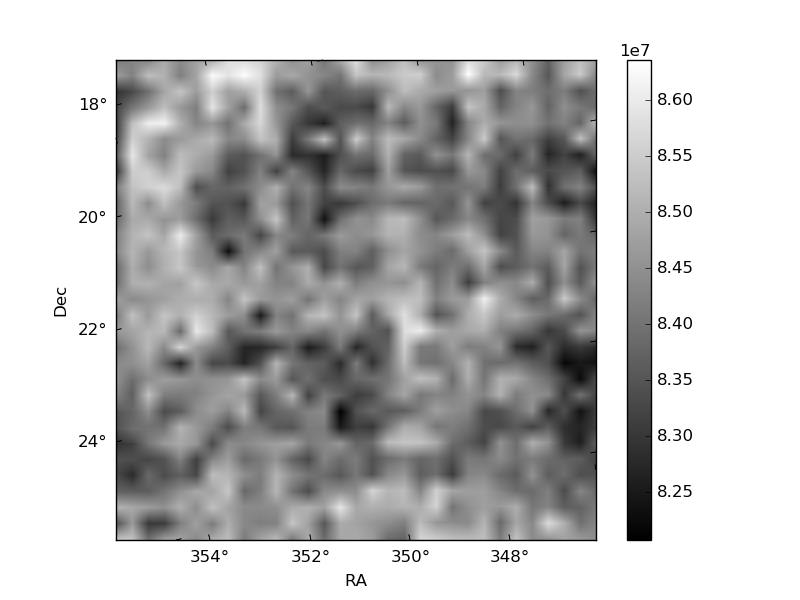
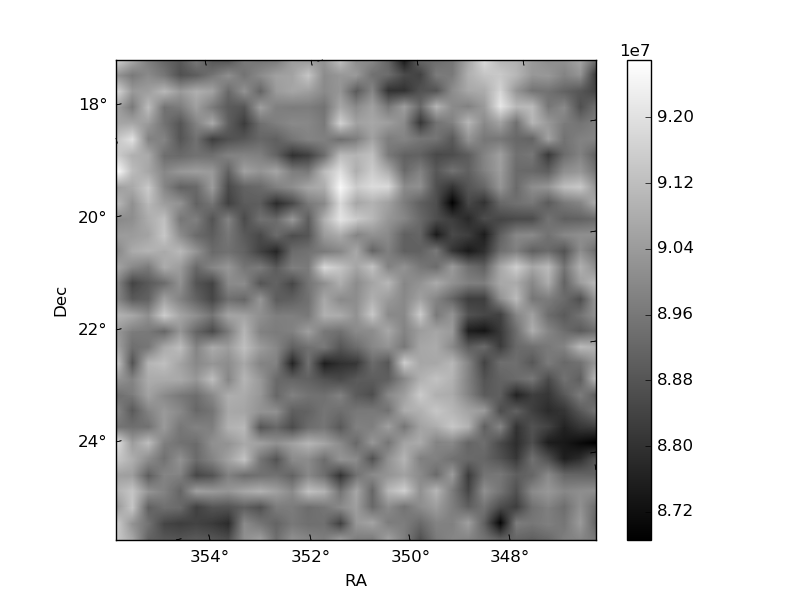
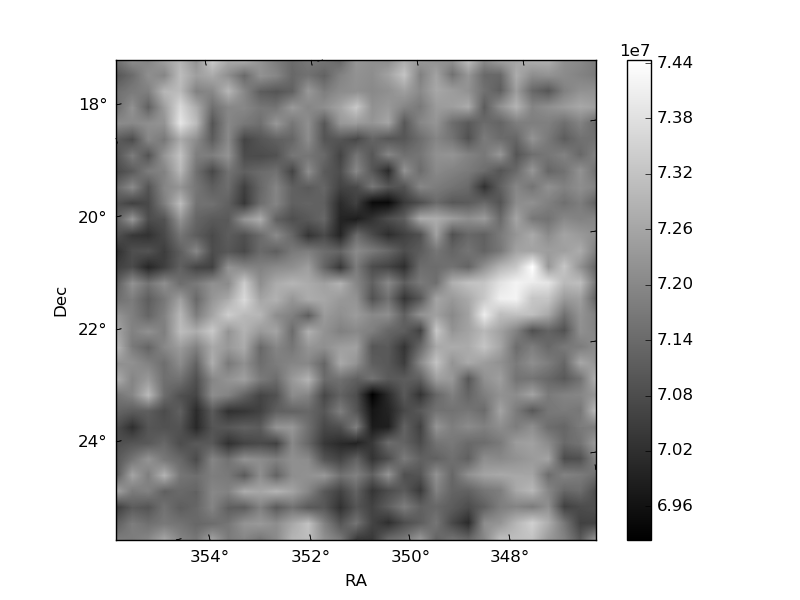
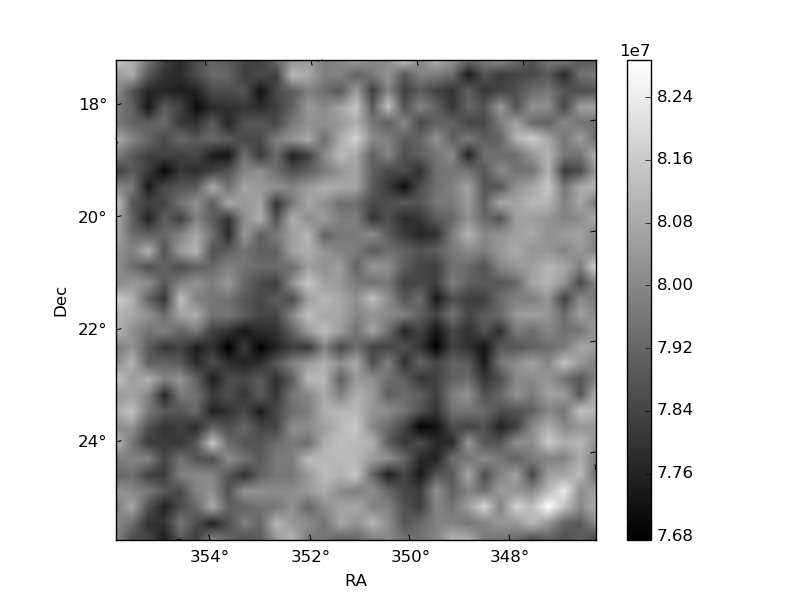
Histogram calculated using DETX and DETY for each event in the final _common_clean file
| Quadrant A | 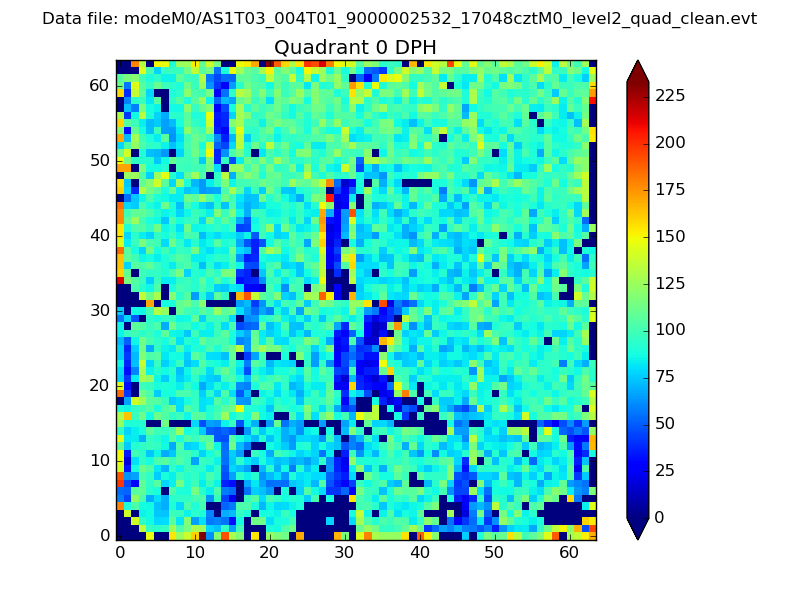 |
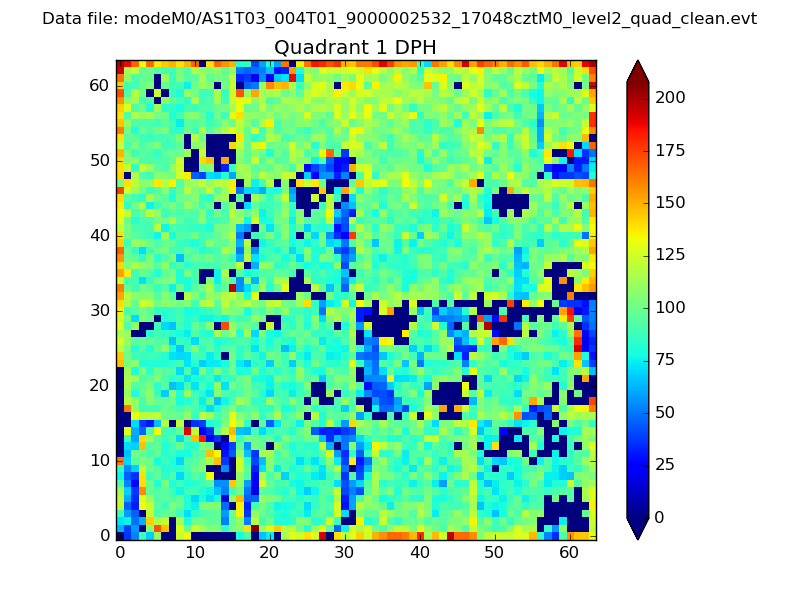 |
Quadrant B |
|---|---|---|---|
| Quadrant D | 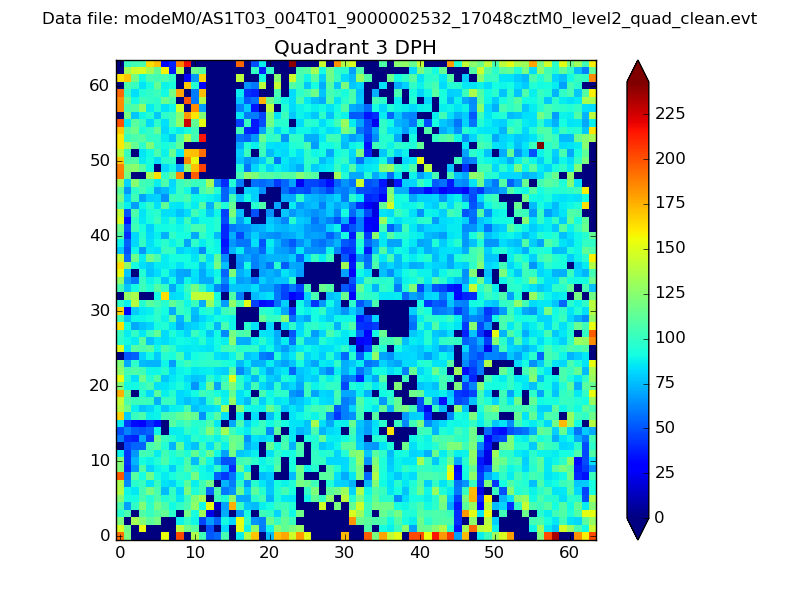 |
 |
Quadrant C |
| Plot type | Count rate plots | Images |
|---|---|---|
| Comparison with Poisson distribution Blue bars denote a histogram of data divided into 1 sec bins. Red curve is a Poisson curve with rate = median count rate of data. |
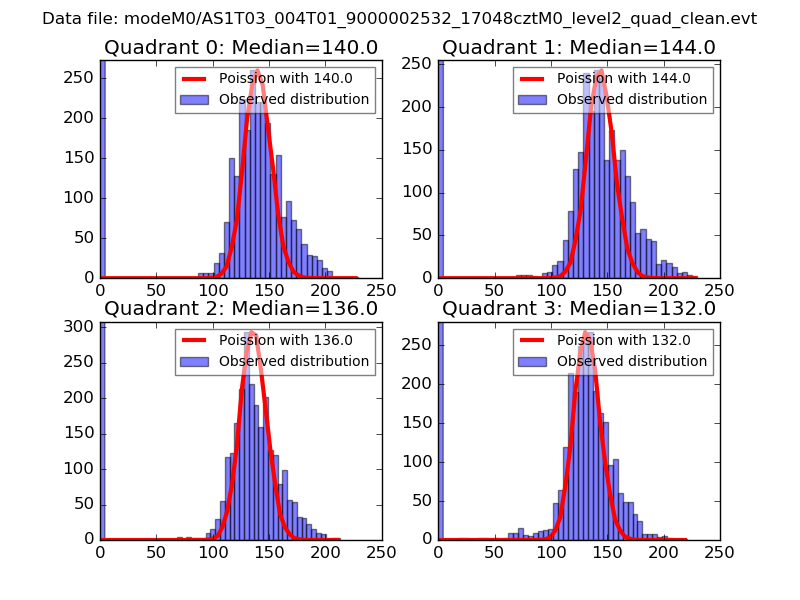 |
 |
| Quadrant-wise count rates Data is divided into 100 sec bins |
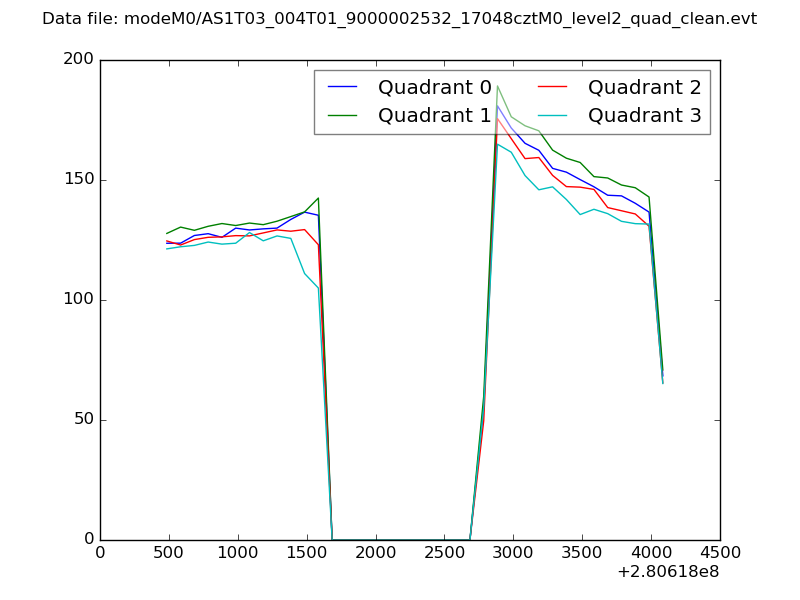 |
|
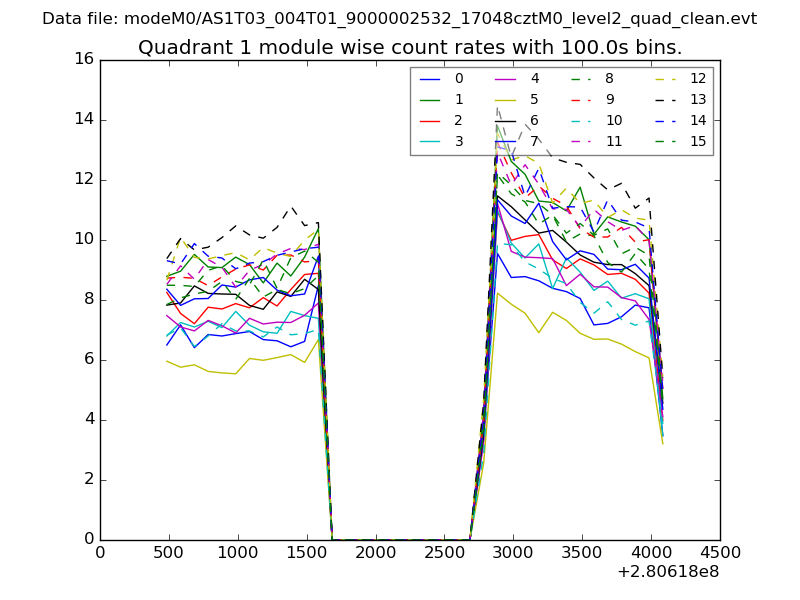
| Module-wise count rates for Quadrant A Data is divided into 100 sec bins |
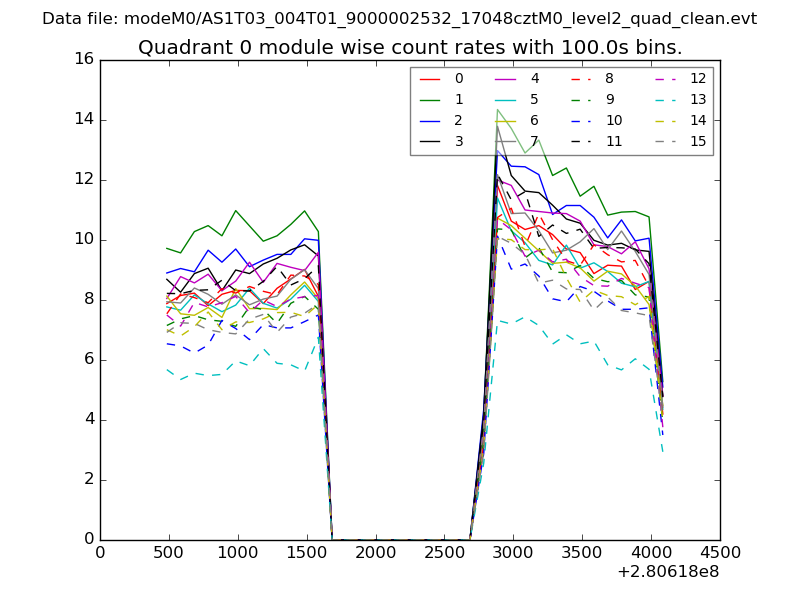 |
 |
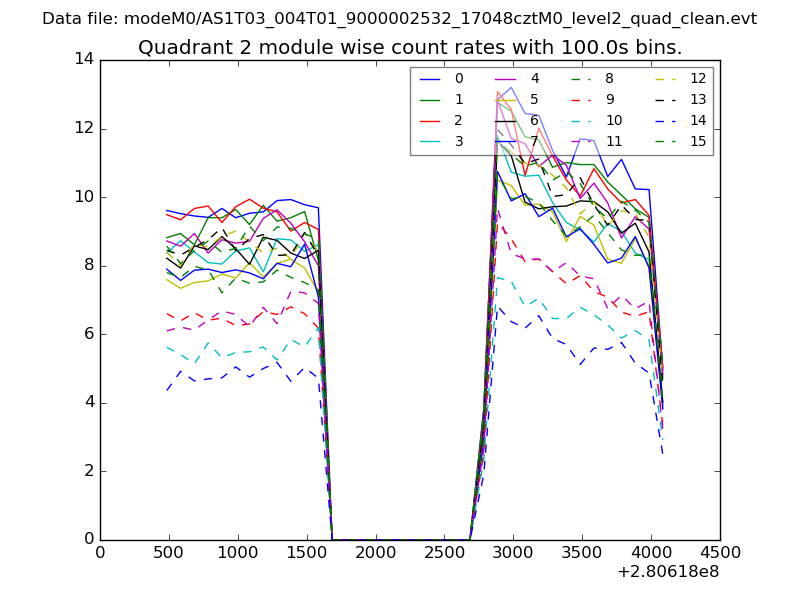
| Module-wise count rates for Quadrant B Data is divided into 100 sec bins |
 |
 |
| Module-wise count rates for Quadrant C Data is divided into 100 sec bins |
 |
 |
| Module-wise count rates for Quadrant D Data is divided into 100 sec bins |
 |
 |
| Parameter | Plot |
|---|---|
| CZT HV Monitor | 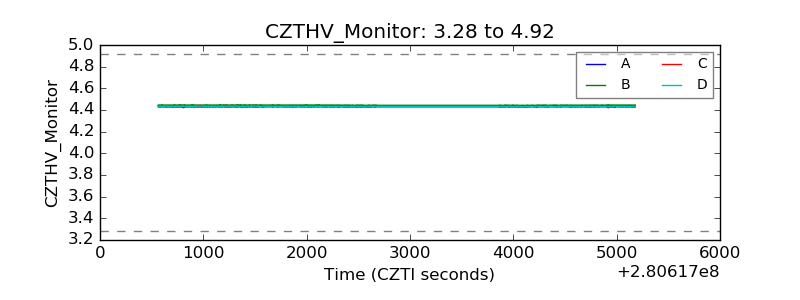 |
| D_VDD | 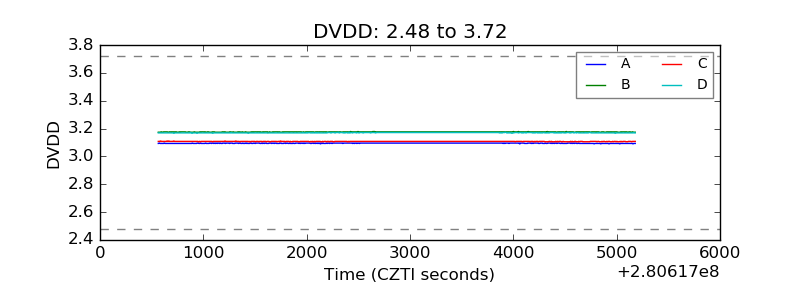 |
| Temperature 1 |  |
| Veto HV Monitor | 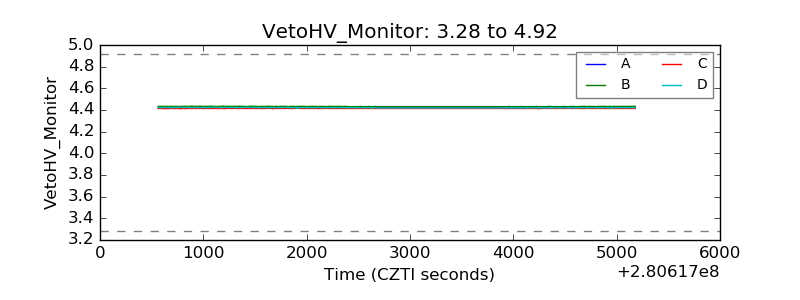 |
| Veto LLD | 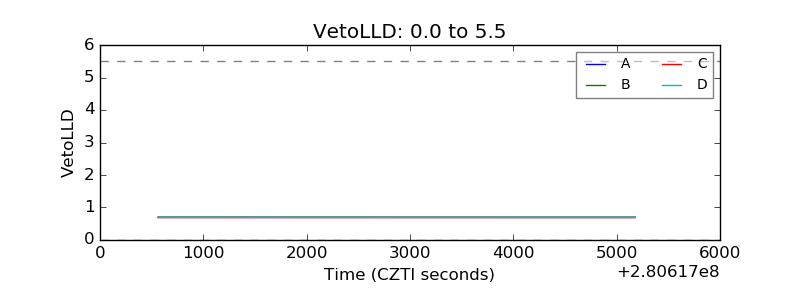 |
| Alpha Counter | 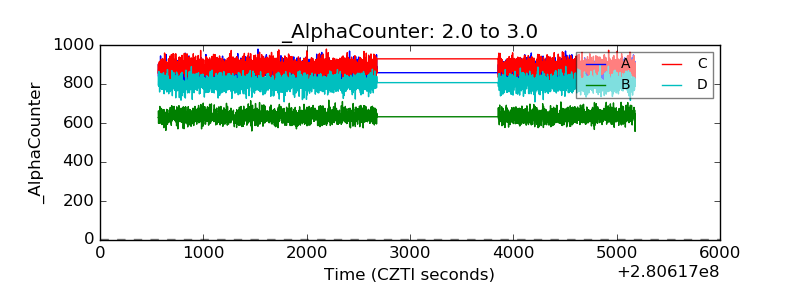 |
| _CPM_Rate | 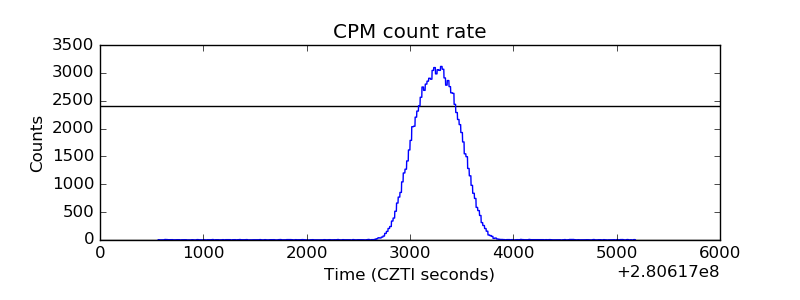 |
| CZT Counter | 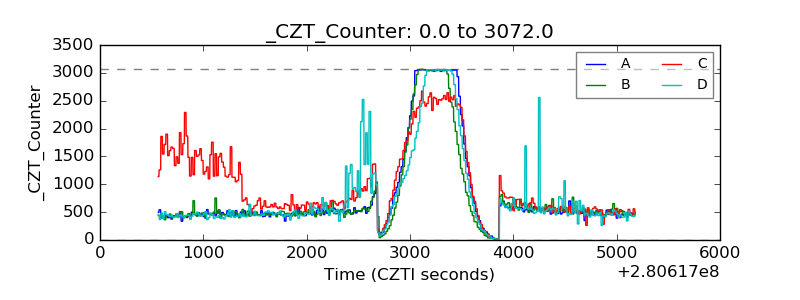 |
| +2.5 Volts monitor |  |
| +5 Volts monitor |  |
| _ROLL_ROT | 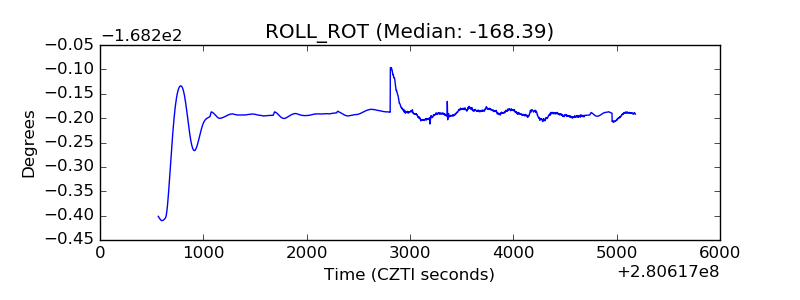 |
| _Roll_DEC |  |
| _Roll_RA | 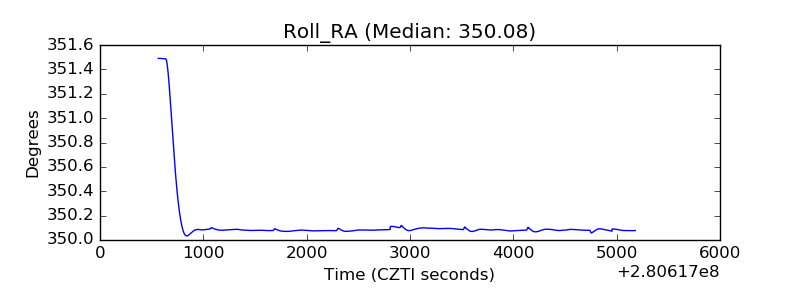 |
| Veto Counter | 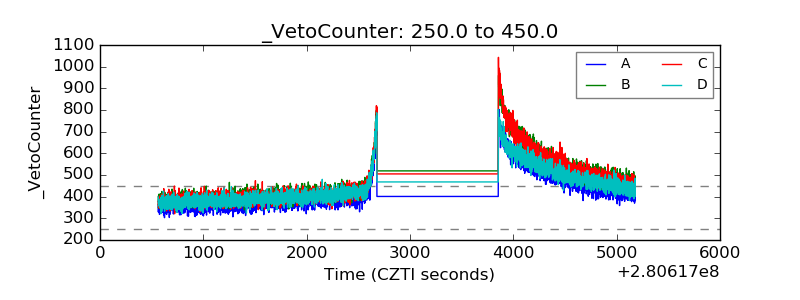 |