| Param | Original file | Final file |
|---|---|---|
| Filename | modeM0/AS1T03_004T01_9000002532_17049cztM0_level2.evt | modeM0/AS1T03_004T01_9000002532_17049cztM0_level2_quad_clean.evt |
| Size (bytes) | 462,536,640 | 85,377,600 |
| Size | 441.1 MB | 81.4 MB |
| Events in quadrant A | 3,079,956 | 544,767 |
| Events in quadrant B | 3,332,475 | 565,237 |
| Events in quadrant C | 3,757,789 | 527,640 |
| Events in quadrant D | 3,411,533 | 509,681 |
| Mode SS | |||
|---|---|---|---|
| Quadrant | BADHDUFLAG | Total packets | Discarded packets |
| A | 0 | 130 | 0 |
| B | 0 | 130 | 0 |
| C | 0 | 130 | 0 |
| D | 0 | 130 | 0 |
| Mode M9 | |||
|---|---|---|---|
| Quadrant | BADHDUFLAG | Total packets | Discarded packets |
| A | 0 | 25 | 0 |
| B | 0 | 25 | 0 |
| C | 0 | 25 | 0 |
| D | 0 | 25 | 0 |
| Mode M0 | |||
|---|---|---|---|
| Quadrant | BADHDUFLAG | Total packets | Discarded packets |
| A | 0 | 13089 | 2 |
| B | 0 | 13827 | 2 |
| C | 0 | 15376 | 2 |
| D | 0 | 14359 | 2 |
| Quadrant | Total seconds | Saturated seconds | Saturation percentage |
|---|---|---|---|
| A | 6275 | 24 | 0.382470% |
| B | 6275 | 55 | 0.876494% |
| C | 6275 | 77 | 1.227092% |
| D | 6275 | 87 | 1.386454% |
Noise dominated data is calculated using 1-second bins in cleaned event files. If a bin has >2000 counts, and if more than 50% of those come from <1% of pixels, then it is considered to be noise-dominated and hence unusable.
| Quadrant | # 1 sec bins | Bins with >0 counts | Bins with >2000 counts | High rate bins dominated by noise | Noise dominated (total time) | Noise dominated (detector-on time) | Marked lightcurve |
|---|---|---|---|---|---|---|---|
| A | 8751 | 6278 | 0 | 0 | 0.00% | 0.00% | 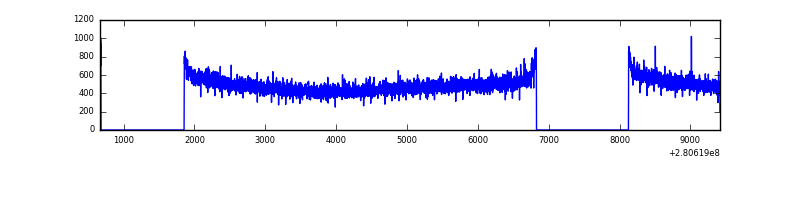 |
| B | 8751 | 6278 | 7 | 7 | 0.08% | 0.11% | 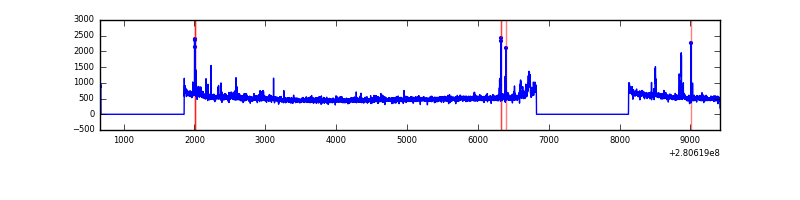 |
| C | 8751 | 6277 | 0 | 0 | 0.00% | 0.00% | 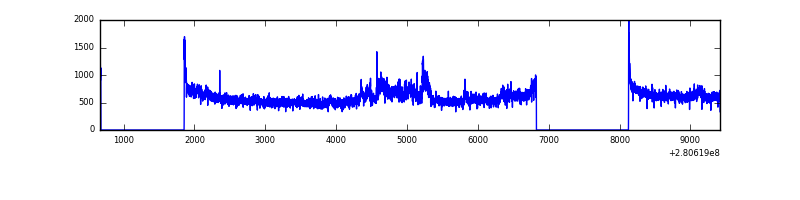 |
| D | 8751 | 6278 | 53 | 53 | 0.61% | 0.84% | 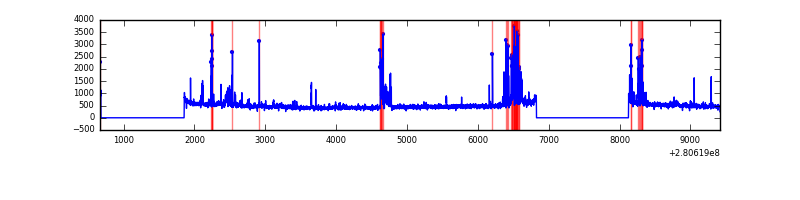 |
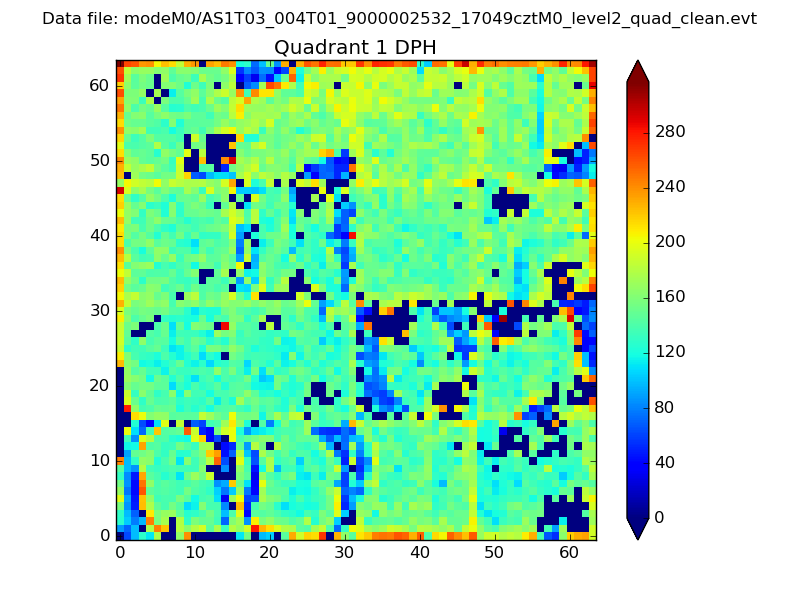
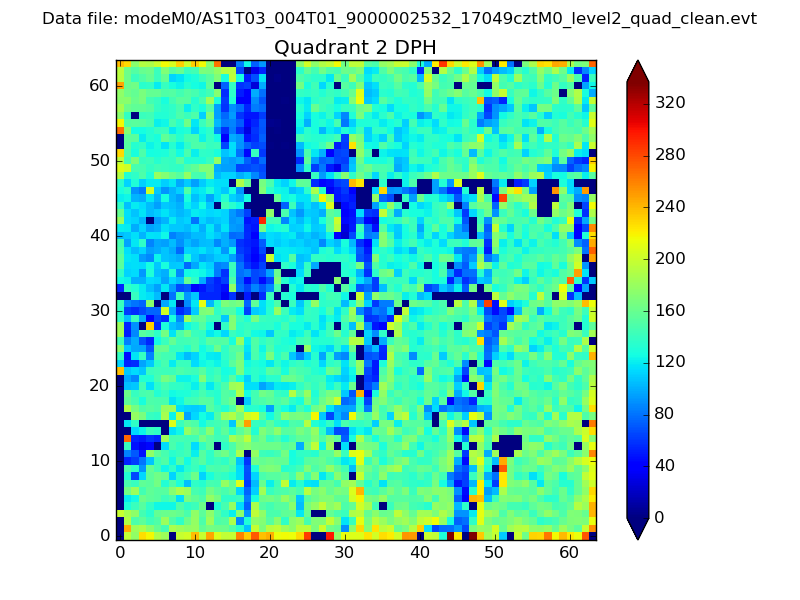
Top three noisy pixels from each quadrant. If the there are fewer than three noisy pixels in the level2.evt file, extra rows are filled as -1
| Pixel properties | Quadrant properties | ||||||
|---|---|---|---|---|---|---|---|
| Quadrant | DetID | PixID | Counts | Sigma | Mean | Median | Sigma |
| A | 0 | 226 | 7095 | 39.34 | 799 | 785 | 160.4 |
| A | 12 | 194 | 5798 | 31.25 | 799 | 785 | 160.4 |
| A | 3 | 137 | 5549 | 29.7 | 799 | 785 | 160.4 |
| B | 4 | 216 | 34762 | 223.57 | 811 | 792 | 151.9 |
| B | 0 | 197 | 34297 | 220.51 | 811 | 792 | 151.9 |
| B | 0 | 219 | 33204 | 213.32 | 811 | 792 | 151.9 |
| C | 3 | 233 | 619415 | 3461.81 | 774 | 781 | 178.7 |
| C | 14 | 238 | 118917 | 661.08 | 774 | 781 | 178.7 |
| C | 13 | 61 | 5360 | 25.62 | 774 | 781 | 178.7 |
| D | 10 | 70 | 187599 | 998.05 | 774 | 753 | 187.2 |
| D | 5 | 222 | 171380 | 911.42 | 774 | 753 | 187.2 |
| D | 13 | 168 | 65339 | 344.99 | 774 | 753 | 187.2 |
Histogram calculated using DETX and DETY for each event in the final _common_clean file
| Quadrant A | 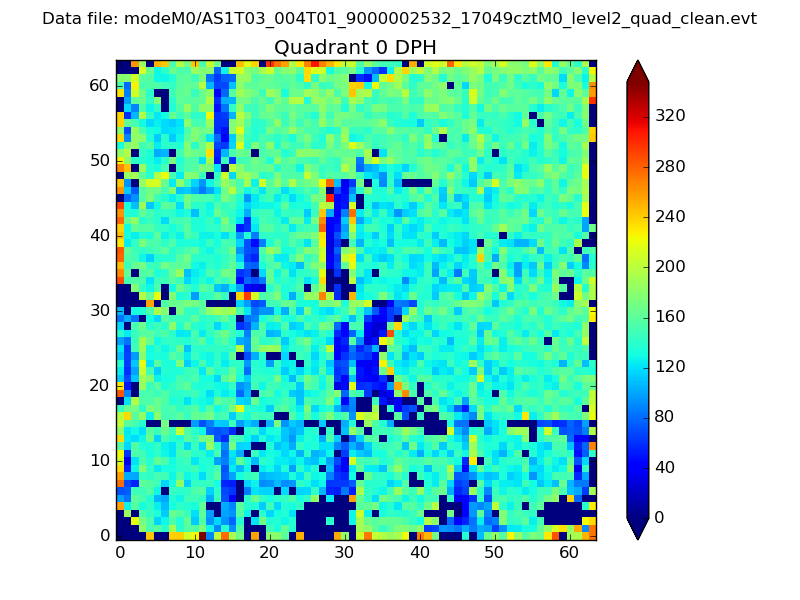 |
 |
Quadrant B |
|---|---|---|---|
| Quadrant D | 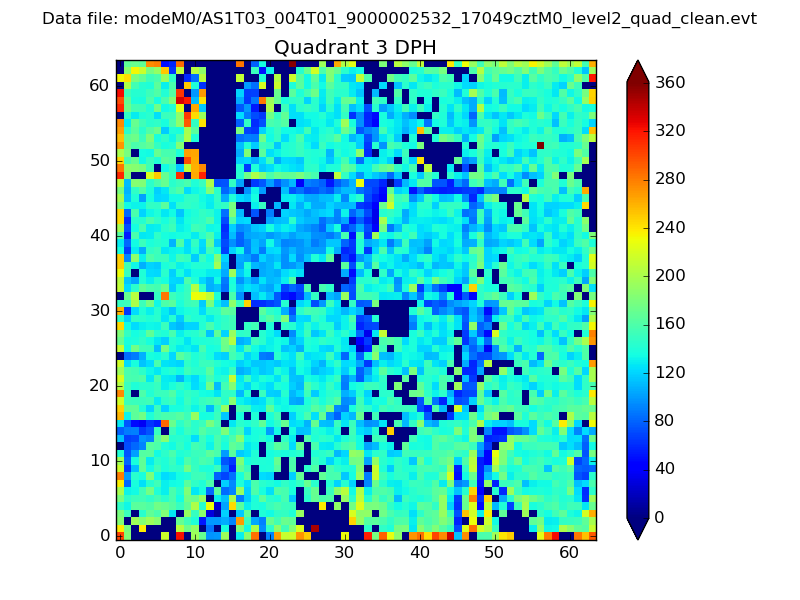 |
 |
Quadrant C |
| Plot type | Count rate plots | Images |
|---|---|---|
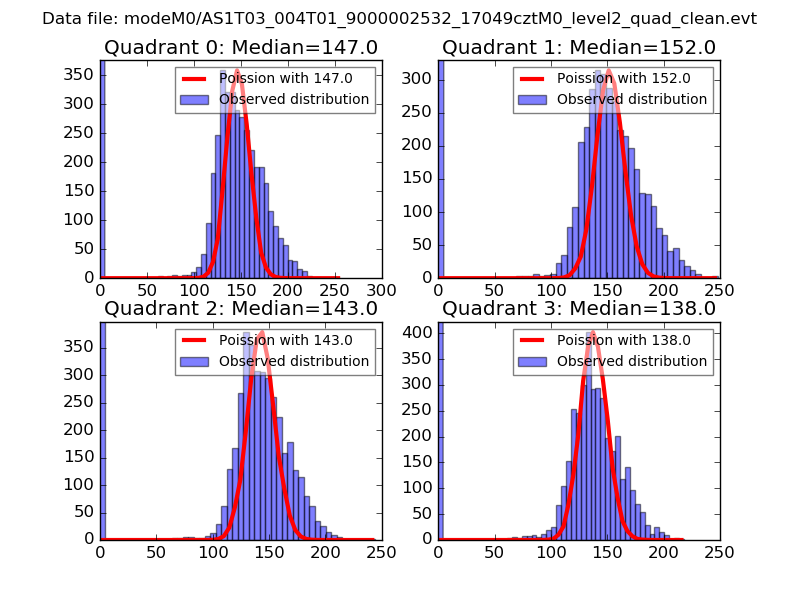
| Comparison with Poisson distribution Blue bars denote a histogram of data divided into 1 sec bins. Red curve is a Poisson curve with rate = median count rate of data. |
 |
 |
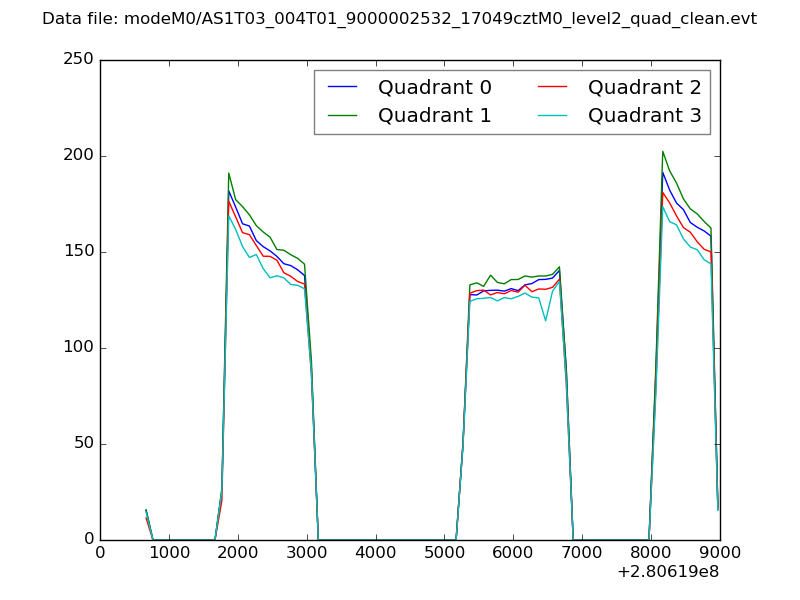
| Quadrant-wise count rates Data is divided into 100 sec bins |
 |
|
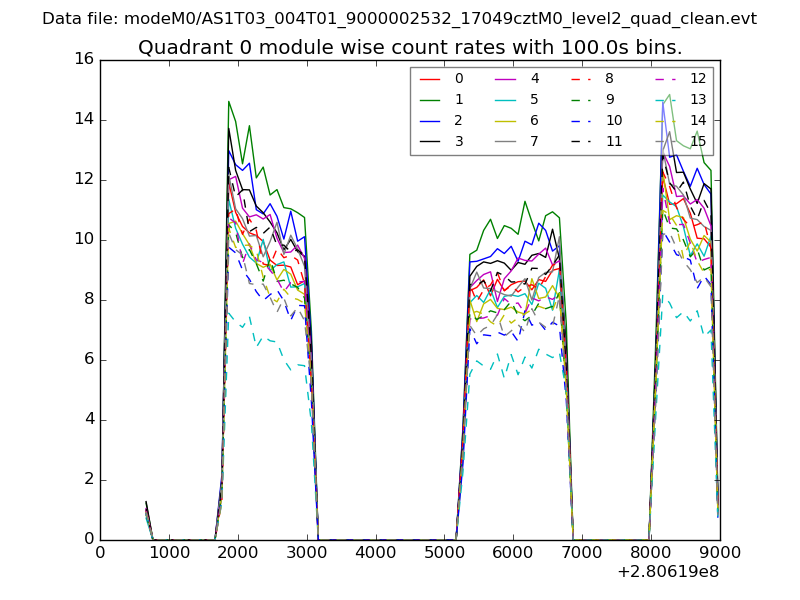
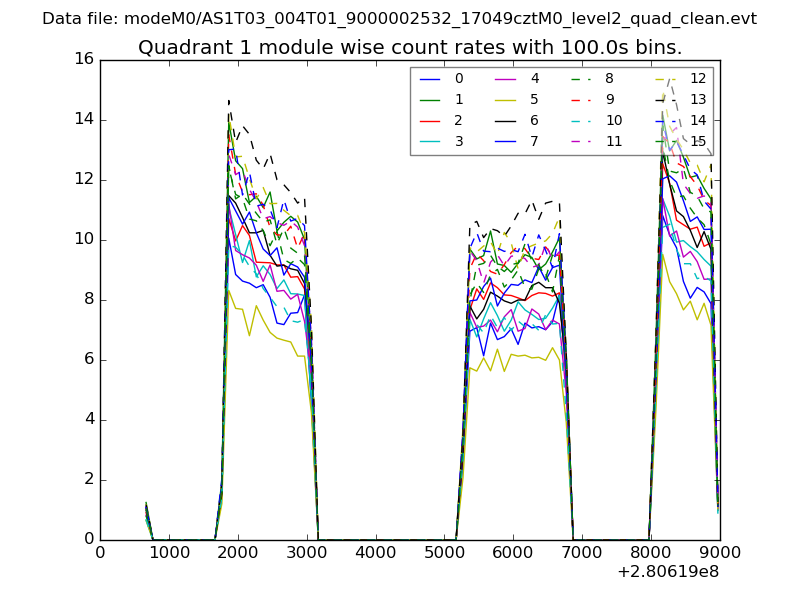
| Module-wise count rates for Quadrant A Data is divided into 100 sec bins |
 |
 |
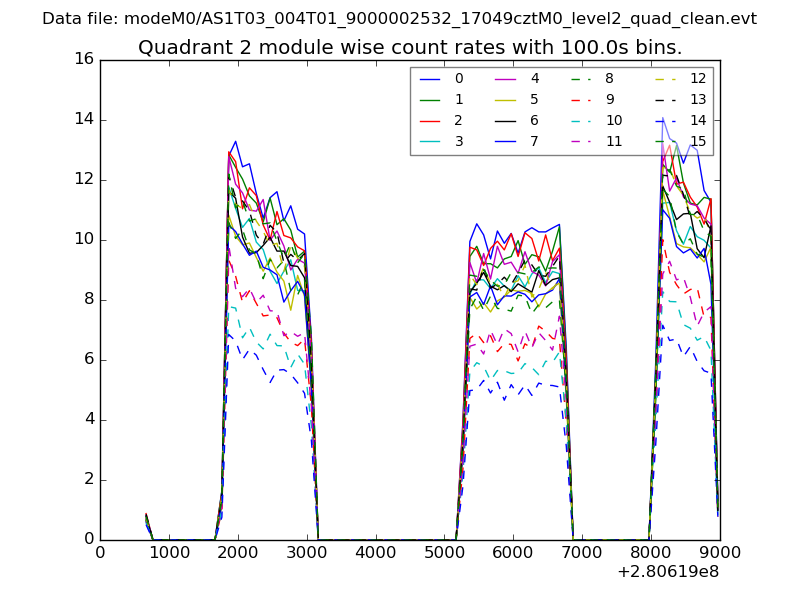
| Module-wise count rates for Quadrant B Data is divided into 100 sec bins |
 |
 |
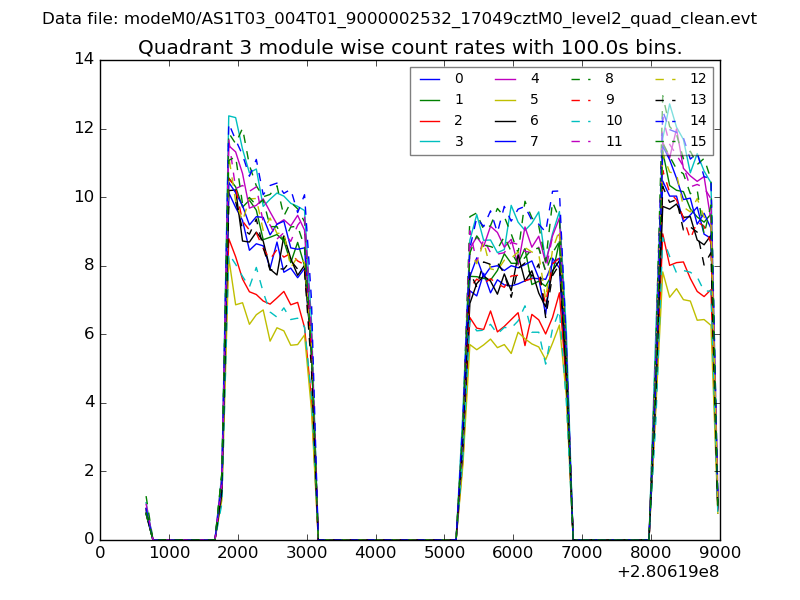
| Module-wise count rates for Quadrant C Data is divided into 100 sec bins |
 |
 |
| Module-wise count rates for Quadrant D Data is divided into 100 sec bins |
 |
 |
| Parameter | Plot |
|---|---|
| CZT HV Monitor | 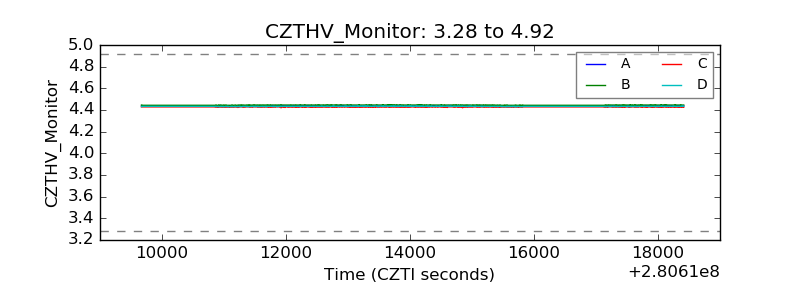 |
| D_VDD |  |
| Temperature 1 | 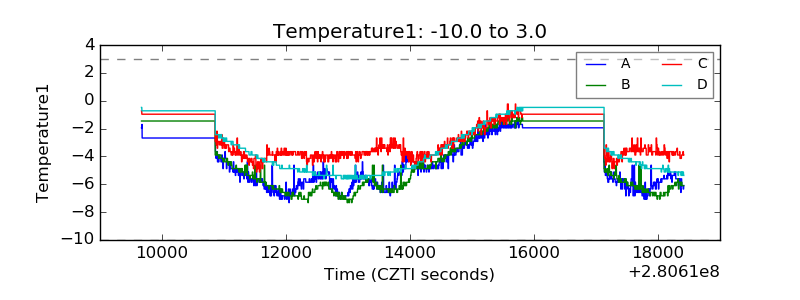 |
| Veto HV Monitor | 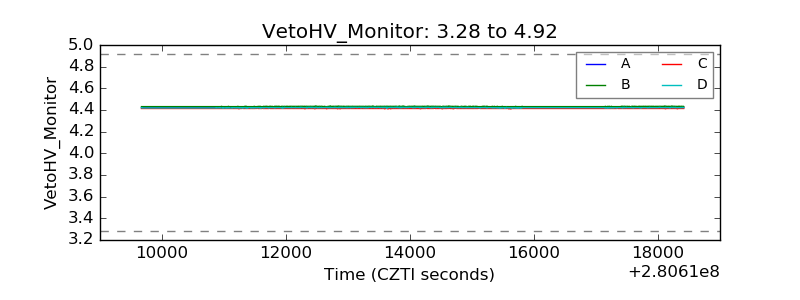 |
| Veto LLD | 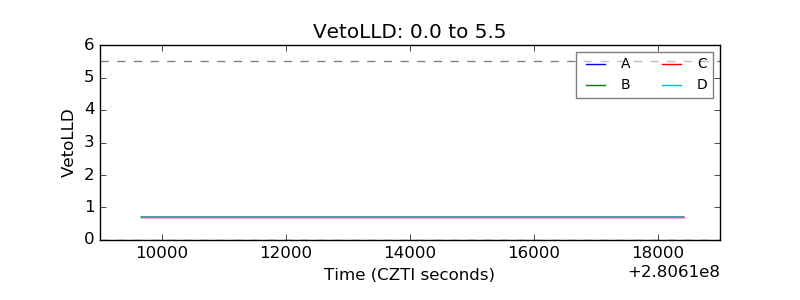 |
| Alpha Counter | 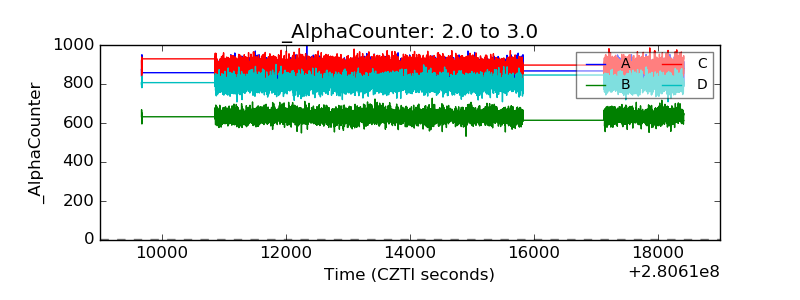 |
| _CPM_Rate | 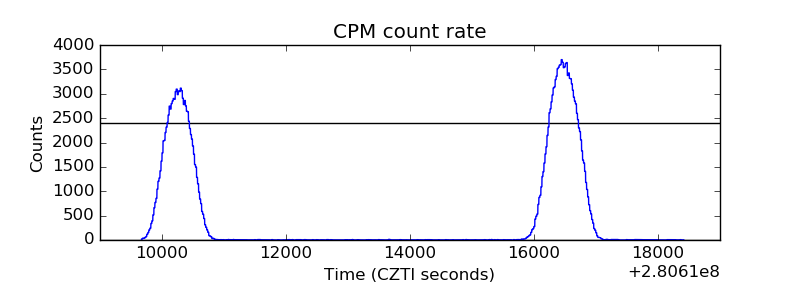 |
| CZT Counter | 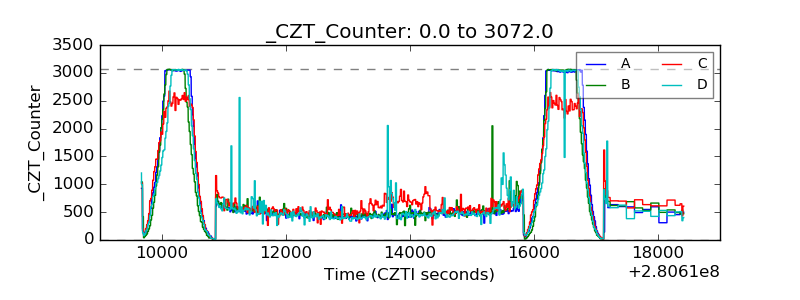 |
| +2.5 Volts monitor |  |
| +5 Volts monitor |  |
| _ROLL_ROT | 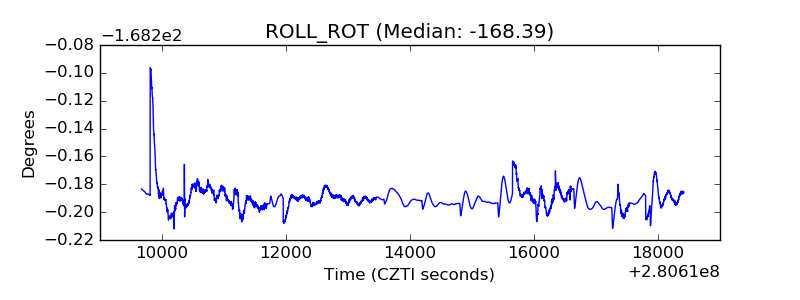 |
| _Roll_DEC | 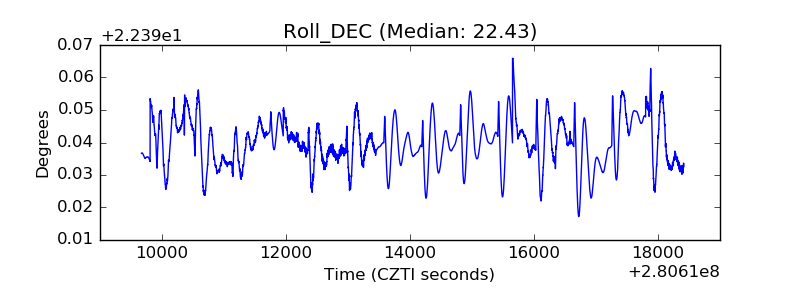 |
| _Roll_RA | 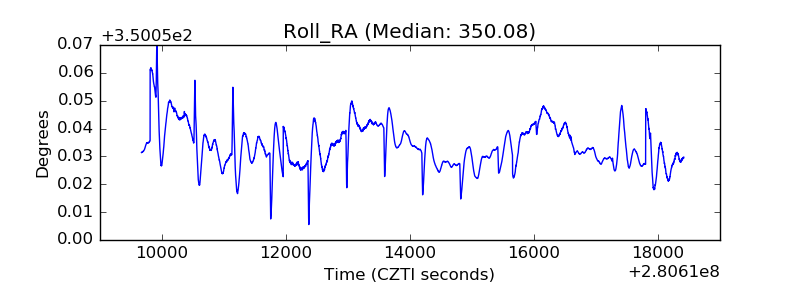 |
| Veto Counter | 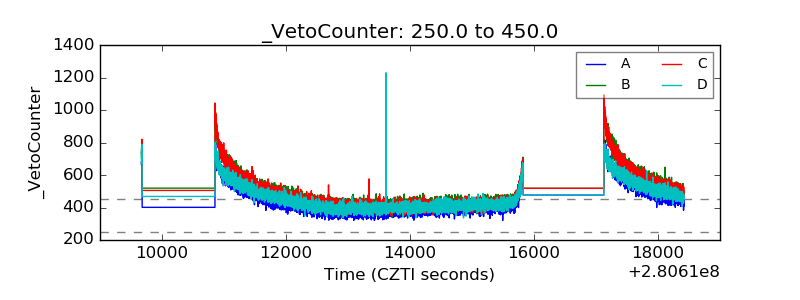 |