| Param | Original file | Final file |
|---|---|---|
| Filename | modeM0/AS1T03_004T01_9000002532_17050cztM0_level2.evt | modeM0/AS1T03_004T01_9000002532_17050cztM0_level2_quad_clean.evt |
| Size (bytes) | 489,890,880 | 76,913,280 |
| Size | 467.2 MB | 73.4 MB |
| Events in quadrant A | 3,240,085 | 481,071 |
| Events in quadrant B | 3,414,577 | 499,179 |
| Events in quadrant C | 4,365,752 | 460,578 |
| Events in quadrant D | 3,385,384 | 445,109 |
| Mode SS | |||
|---|---|---|---|
| Quadrant | BADHDUFLAG | Total packets | Discarded packets |
| A | 0 | 128 | 0 |
| B | 0 | 128 | 0 |
| C | 0 | 128 | 0 |
| D | 0 | 128 | 0 |
| Mode M9 | |||
|---|---|---|---|
| Quadrant | BADHDUFLAG | Total packets | Discarded packets |
| A | 0 | 18 | 0 |
| B | 0 | 19 | 0 |
| C | 0 | 19 | 0 |
| D | 0 | 19 | 0 |
| Mode M0 | |||
|---|---|---|---|
| Quadrant | BADHDUFLAG | Total packets | Discarded packets |
| A | 0 | 13425 | 2 |
| B | 0 | 13998 | 2 |
| C | 0 | 17973 | 2 |
| D | 0 | 14185 | 3 |
| Quadrant | Total seconds | Saturated seconds | Saturation percentage |
|---|---|---|---|
| A | 6351 | 20 | 0.314911% |
| B | 6351 | 38 | 0.598331% |
| C | 6351 | 102 | 1.606046% |
| D | 6350 | 89 | 1.401575% |
Noise dominated data is calculated using 1-second bins in cleaned event files. If a bin has >2000 counts, and if more than 50% of those come from <1% of pixels, then it is considered to be noise-dominated and hence unusable.
| Quadrant | # 1 sec bins | Bins with >0 counts | Bins with >2000 counts | High rate bins dominated by noise | Noise dominated (total time) | Noise dominated (detector-on time) | Marked lightcurve |
|---|---|---|---|---|---|---|---|
| A | 7732 | 6353 | 7 | 7 | 0.09% | 0.11% | 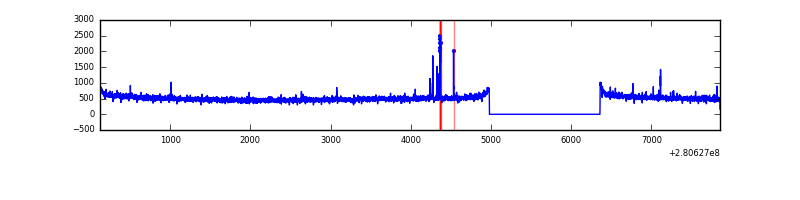 |
| B | 7732 | 6353 | 2 | 2 | 0.03% | 0.03% | 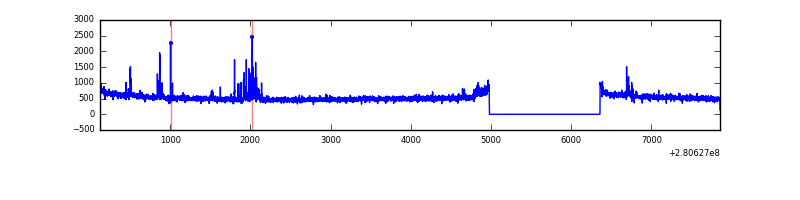 |
| C | 7732 | 6353 | 0 | 0 | 0.00% | 0.00% | 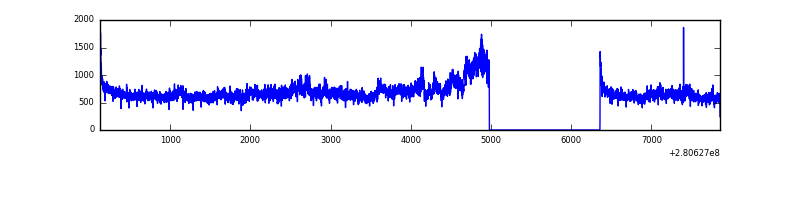 |
| D | 7731 | 6352 | 59 | 59 | 0.76% | 0.93% | 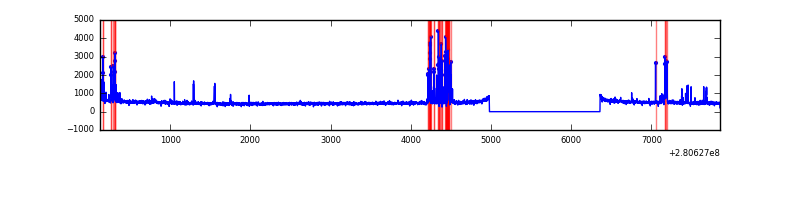 |
Top three noisy pixels from each quadrant. If the there are fewer than three noisy pixels in the level2.evt file, extra rows are filled as -1
| Pixel properties | Quadrant properties | ||||||
|---|---|---|---|---|---|---|---|
| Quadrant | DetID | PixID | Counts | Sigma | Mean | Median | Sigma |
| A | 4 | 2 | 37192 | 219.22 | 833 | 818 | 165.9 |
| A | 0 | 226 | 7394 | 39.63 | 833 | 818 | 165.9 |
| A | 12 | 194 | 5968 | 31.04 | 833 | 818 | 165.9 |
| B | 3 | 64 | 61922 | 390.89 | 844 | 826 | 156.3 |
| B | 0 | 230 | 21251 | 130.68 | 844 | 826 | 156.3 |
| B | 12 | 111 | 17736 | 108.19 | 844 | 826 | 156.3 |
| C | 3 | 233 | 1106981 | 6001.67 | 800 | 807 | 184.3 |
| C | 14 | 238 | 125418 | 676.09 | 800 | 807 | 184.3 |
| C | 13 | 61 | 5736 | 26.74 | 800 | 807 | 184.3 |
| D | 10 | 70 | 227114 | 1171.8 | 799 | 778 | 193.2 |
| D | 5 | 222 | 117863 | 606.18 | 799 | 778 | 193.2 |
| D | 2 | 234 | 22025 | 110.0 | 799 | 778 | 193.2 |
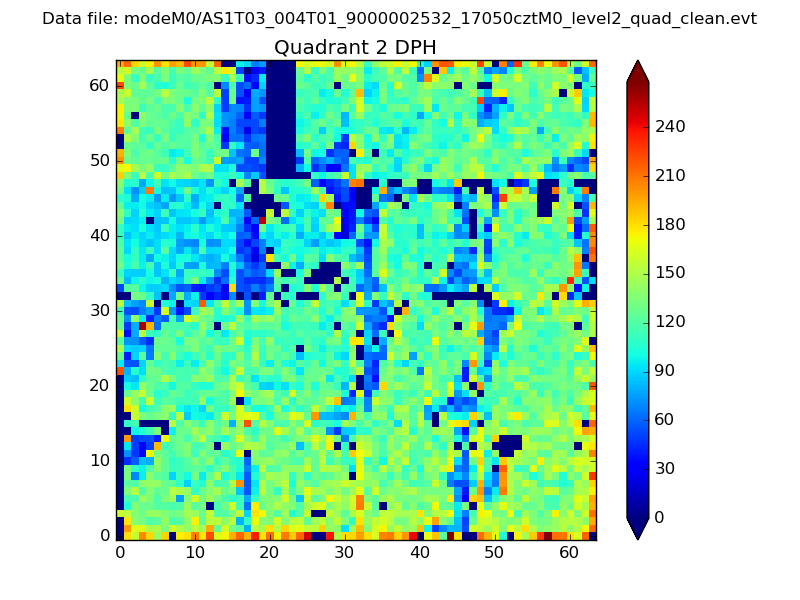
Histogram calculated using DETX and DETY for each event in the final _common_clean file
| Quadrant A | 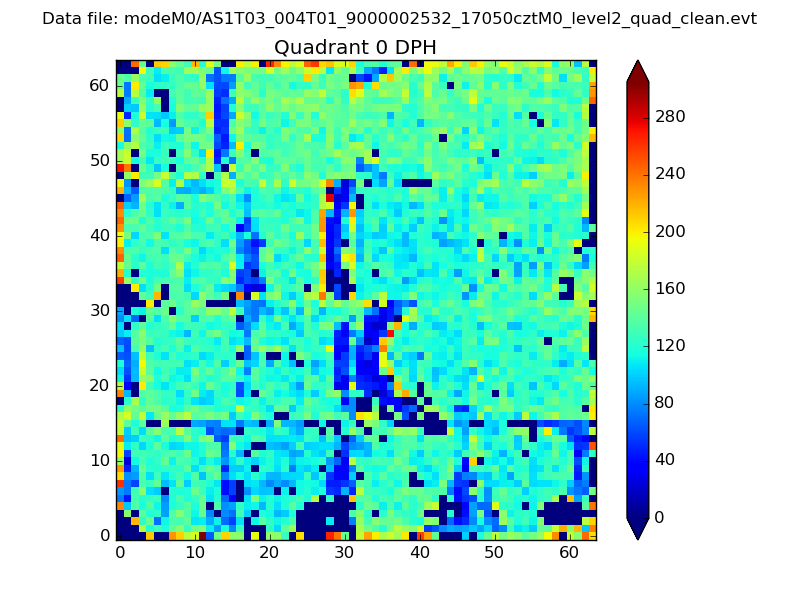 |
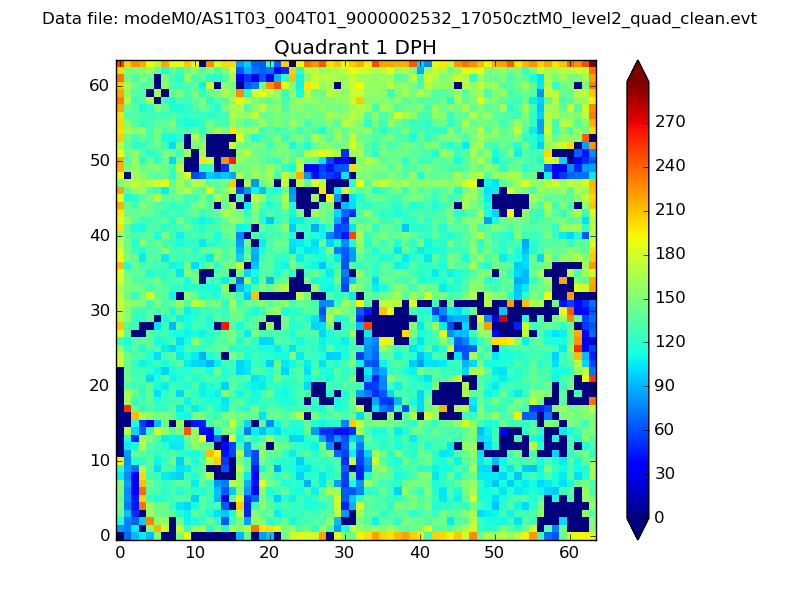 |
Quadrant B |
|---|---|---|---|
| Quadrant D | 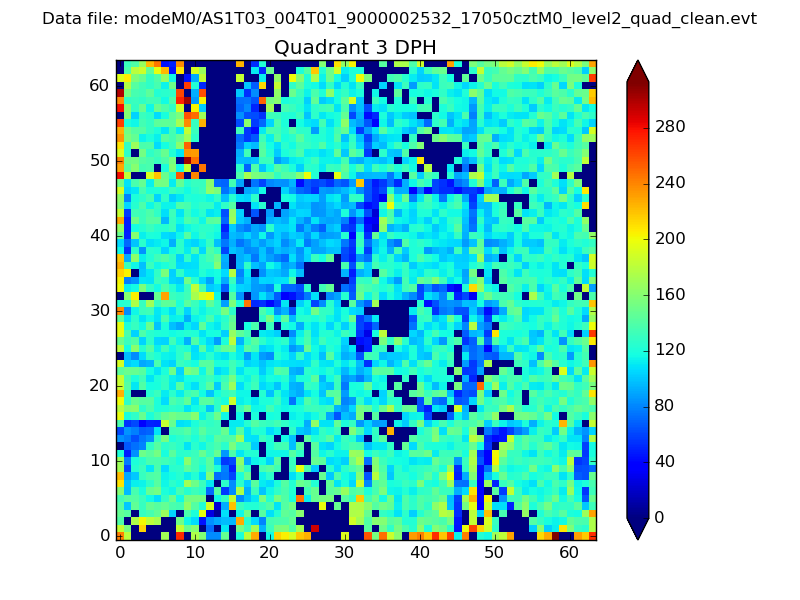 |
 |
Quadrant C |
| Plot type | Count rate plots | Images |
|---|---|---|
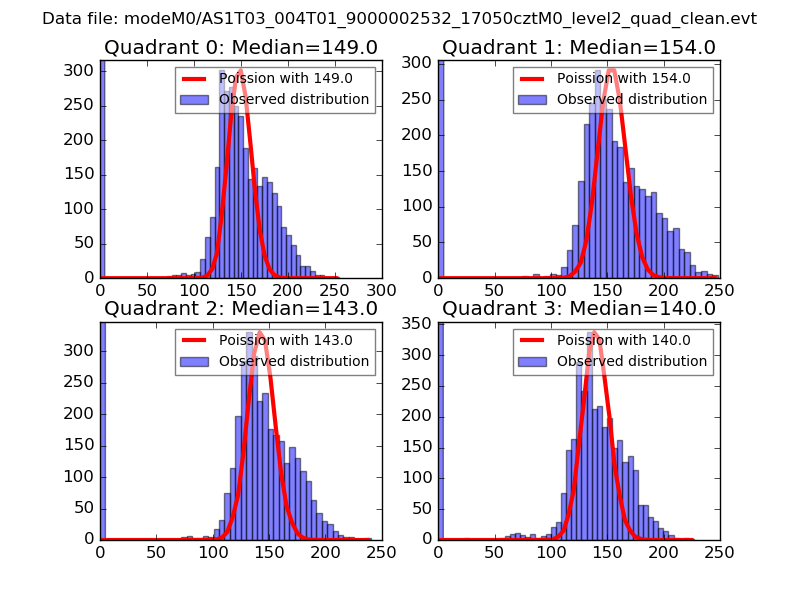
| Comparison with Poisson distribution Blue bars denote a histogram of data divided into 1 sec bins. Red curve is a Poisson curve with rate = median count rate of data. |
 |
 |
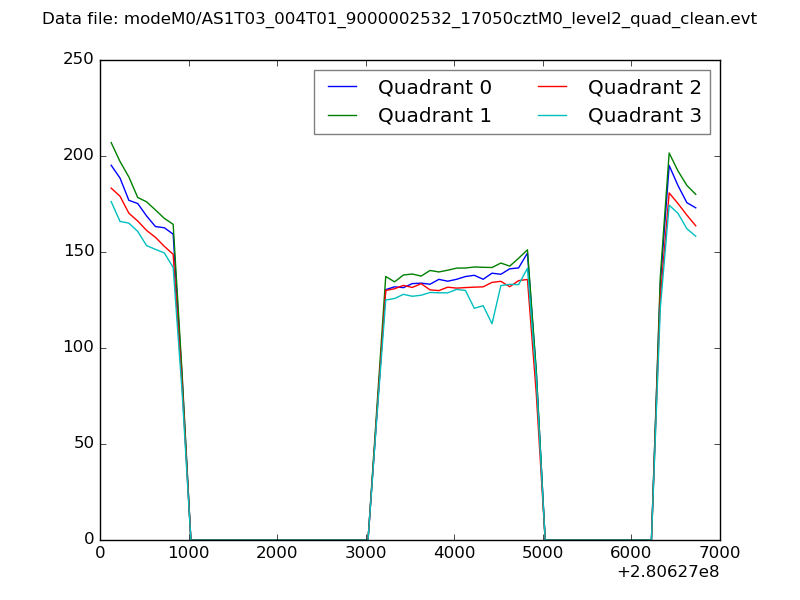
| Quadrant-wise count rates Data is divided into 100 sec bins |
 |
|
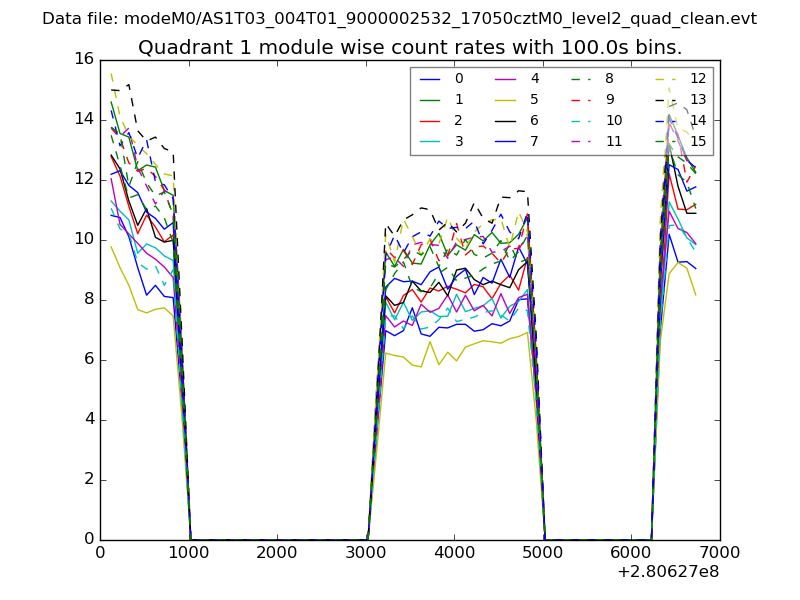
| Module-wise count rates for Quadrant A Data is divided into 100 sec bins |
 |
 |
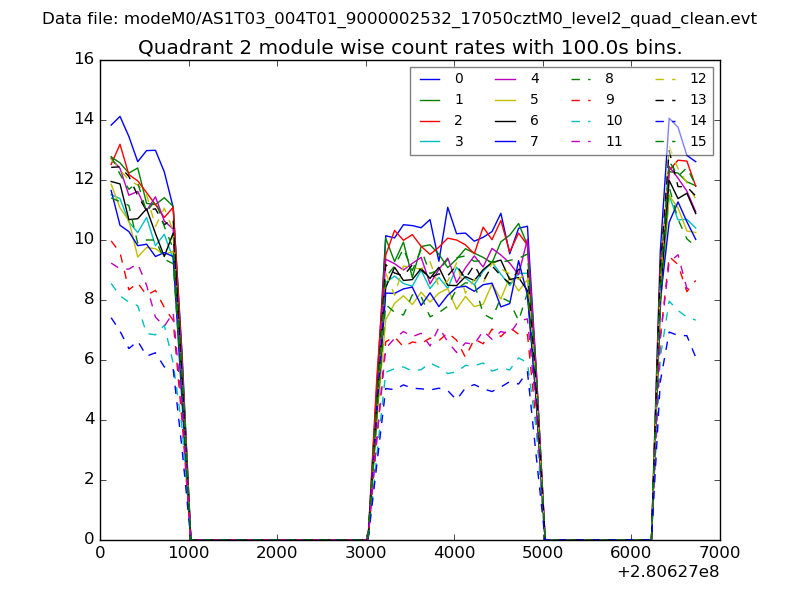
| Module-wise count rates for Quadrant B Data is divided into 100 sec bins |
 |
 |
| Module-wise count rates for Quadrant C Data is divided into 100 sec bins |
 |
 |
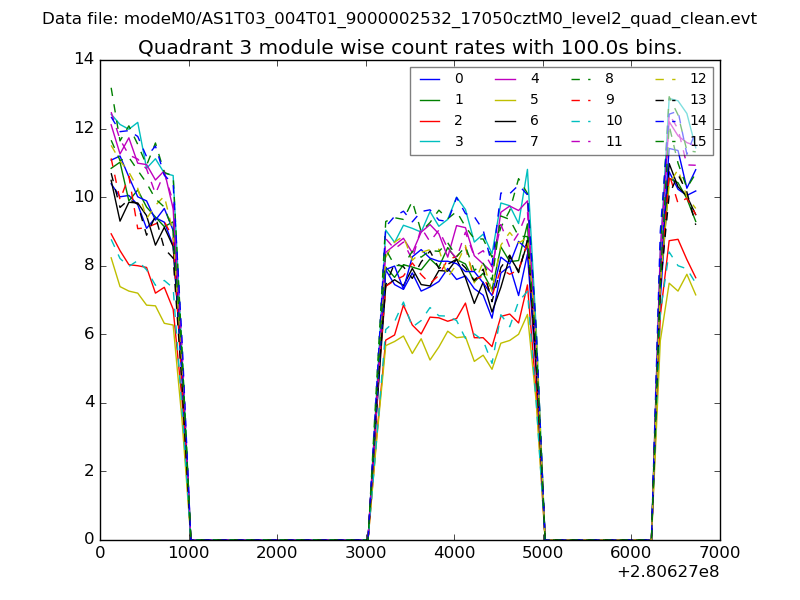
| Module-wise count rates for Quadrant D Data is divided into 100 sec bins |
 |
 |
| Parameter | Plot |
|---|---|
| CZT HV Monitor | 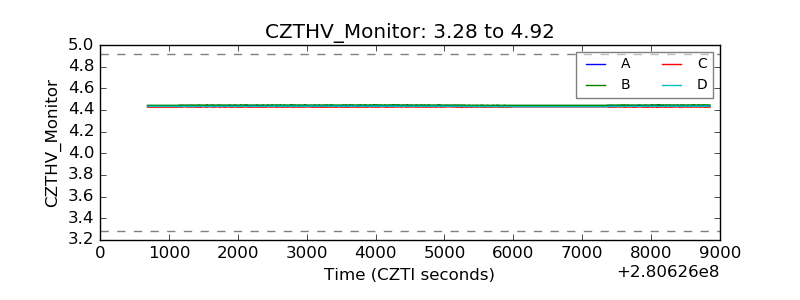 |
| D_VDD | 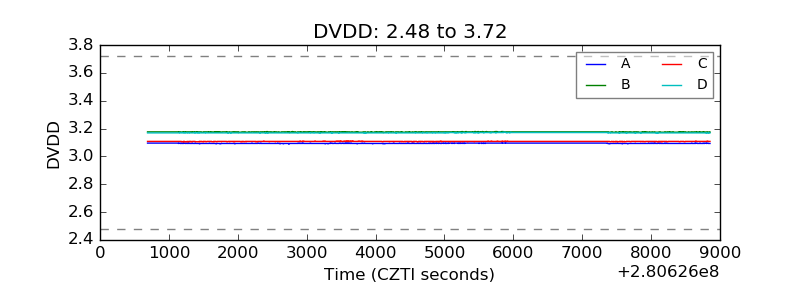 |
| Temperature 1 | 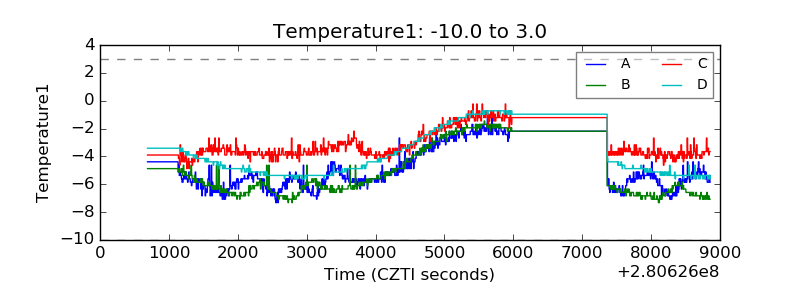 |
| Veto HV Monitor | 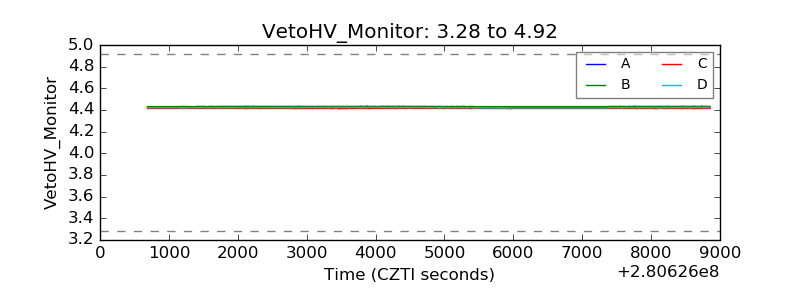 |
| Veto LLD |  |
| Alpha Counter | 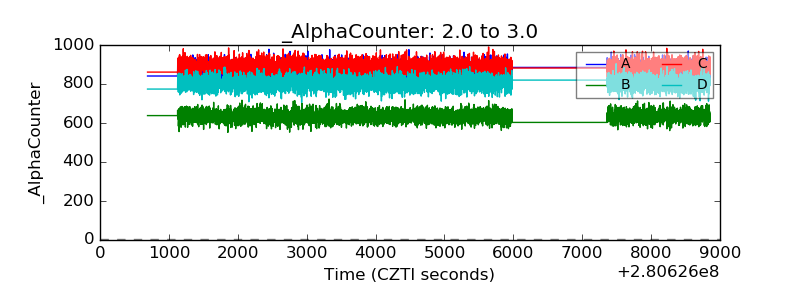 |
| _CPM_Rate | 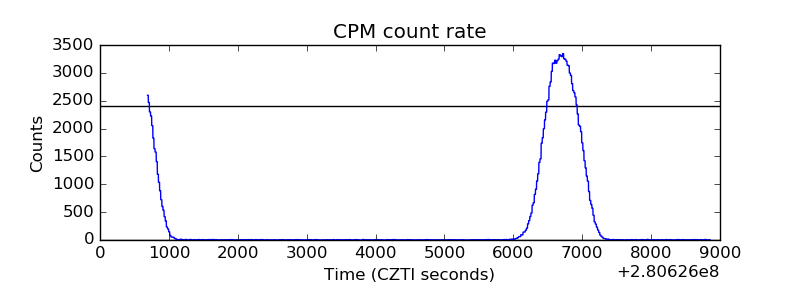 |
| CZT Counter | 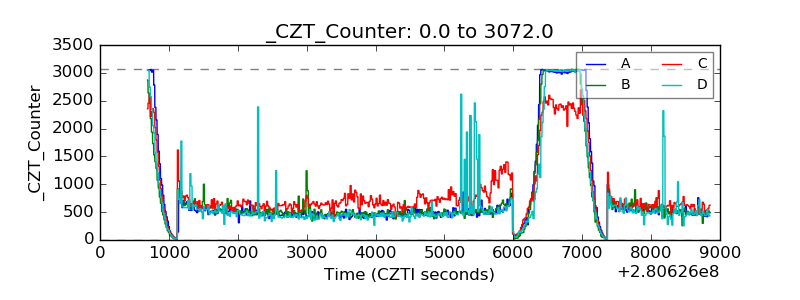 |
| +2.5 Volts monitor |  |
| +5 Volts monitor |  |
| _ROLL_ROT |  |
| _Roll_DEC | 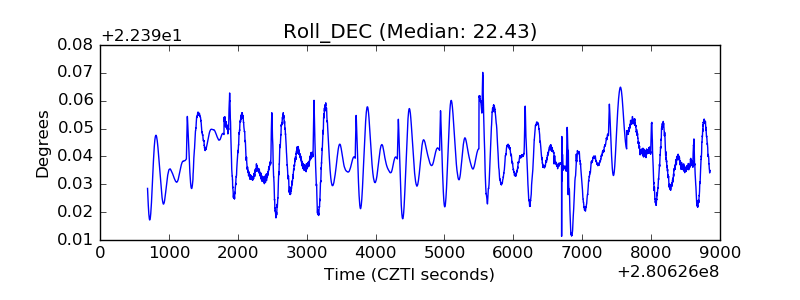 |
| _Roll_RA | 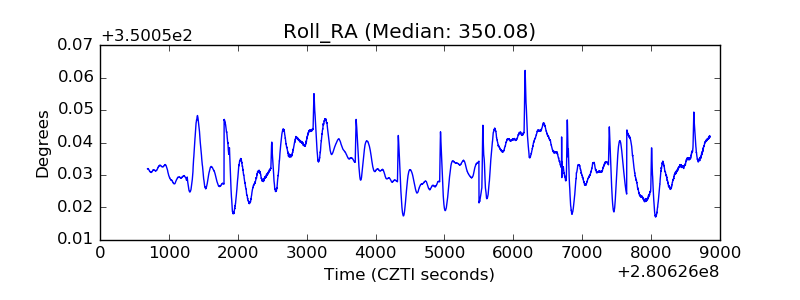 |
| Veto Counter | 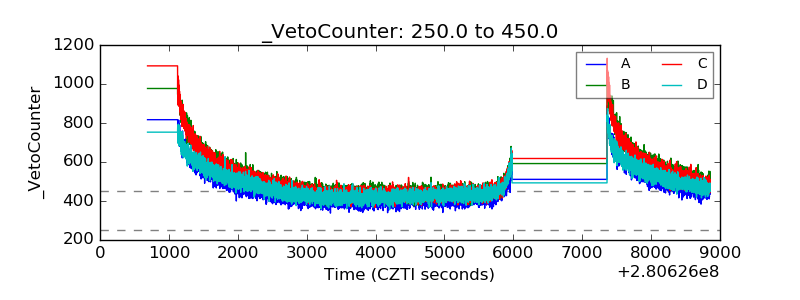 |